AN INNOVATIVE APPROACH BY MASS SPECTROMETRY FOR THE
RECOVERY OF HIGH-VALUE ANTIOXIDANT NUTRACEUTICALS
FROM PLANTS, DEVELOPMENT OF NEW FUNCTIONAL FOODS,
QUALITY AND SAFETY IN AGRI-FOOD.
Candidate Elvira Romano
UN APPROCCIO INNOVATIVO DI SPETTROMETRIA DI MASSA PER IL RECUPERO DI NUTRACEUTICI AD ALTO VALORE ANTIOSSIDANTE DA
PIANTE, SVILUPPO DI NUOVI ALIMENTI FUNZIONALI, QUALITÀ E SICUREZZA AGROALIMENTARE.
Coordinatore OMPI Candidato
Direttore della scuola Prof. Roberto Bartolino
Direttore della scuola
Supervisore Co-Supervisore Anno Accademico 2010/2011
Numerose ricerche hanno evidenziato gli effetti benefici per la salute dovuti alla “dieta Mediterranea” caratterizzata dal consumo di verdure, cereali, pesce e olio d’oliva. La gente che vive nel bacino del Mediterraneo è risultata più longeva e ha mostrato una minore incidenza di malattie cardiovascolari e cancro, grazie ad una alimentazione ricca in composti bioattivi antiossidanti come quelli biofenolici che non possono essere sintetizzati dagli esseri umani e di cui le piante sono particolarmente ricche.
Lo scopo del presente lavoro di dottorato è stato quello di recuperare composti nutraceutici da matrici alimentari (olio, olive e bergamotto) utilizzando delle procedure innovative e dei solventi non tossici e costosi. Il loro recupero oltre a favorire un abbassamento dei costi di smaltimento dei reflui agroalimentari, potrebbe trovare una diretta applicazione in campo cosmetico, farmaceutico e nello sviluppo di nuovi alimenti funzionali arricchiti in composti bioattivi.
Inoltre, le emergenze alimentari che si sono succedute negli ultimi anni, con grande rilievo mediatico, hanno sollecitato una maggiore attenzione ai temi della qualità e della sicurezza, sia nell’opinione pubblica che nel legislatore e negli stessi produttori, mostrando peraltro gli effetti disastrosi sul mercato della mancanza di fiducia nella sicurezza del cibo. Prima dell’adozione di specifiche leggi europee, alcuni Stati Membri – proprio con l’intento di recuperare la fiducia dei consumatori – avevano per lungo tempo legiferato autonomamente sulla qualità e sicurezza del cibo, ma applicando criteri di base diversi. Questa diversità di approcci, unitamente alla totale assenza di legislazione in materia in altri Stati Membri, iniziava però a minacciare seriamente il corretto funzionamento del Mercato Interno. Era necessaria, dunque, la definizione di un sistema di regole e di garanzie comune. È così che si giunse, fra le altre misure, alla creazione di un “sistema di allerta rapido” anche per i prodotti alimentari, sulla falsariga di quello già esistente sulla sicurezza generale dei prodotti (Direttiva (CEE) 29/06/1992 n.59). Un sistema che rendesse possibile un migliore coordinamento delle autorità preposte alla prevenzione e alla gestione delle emergenze e che, all’occorrenza, permettesse l’adozione di misure più efficaci sulla base di informazioni scientifiche precise. Il Parlamento europeo ed il Consiglio adottarono così il Regolamento (CE) 28/12/2002 n.178, in vigore dal Gennaio 2005, che traccia i principi generali e i requisiti di una nuova legislazione alimentare, istituendo l'Autorità Europea per la Sicurezza Alimentare (European Food Safety Agency = EFSA) e definendo procedure in materia di sicurezza degli alimenti. Una delle principali innovazioni del Regolamento consiste nell’imposizione all’industria alimentare della rintracciabilità degli alimenti durante tutte le fasi della filiera produttiva. Una misura atta a permettere, in caso di emergenza, ritiri dal mercato di lotti specifici di prodotti, evitando così interventi più drastici ed inutilmente distruttivi, e contribuendo nel contempo a trasmettere ai consumatori un’immagine di efficienza tale da arginare in qualche modo la loro progressiva perdita di fiducia. L’introduzione dell’obbligo di rintracciabilità, oltre a facilitare il compito delle autorità poste a garanzia della salute dei consumatori (Food Standards Agency), esercita anche un’importante funzione di deterrente a commettere irregolarità o imprudenze nei confronti di tutti gli operatori della filiera produttiva agroalimentare, consentendo di attribuire responsabilità precisamente definite a chiunque abbia preso parte al processo produttivo. A tale scopo, la spettrometria di massa risulta essere un metodo affidabile e sensibile per garantire la qualità e la sicurezza in campo alimentare.
campo dei prodotti alimentari, però, la qualità e sicurezza devono essere garantite: il consumatore che per motivi economici è costretto a fare la spesa nei discount o ad orientare i propri acquisti verso prodotti di seconda scelta, non deve trovarsi per questo ad esporre la propria salute a rischi maggiori rispetto a chi compra soltanto prodotti di qualità. Di fatto, nessuna delle norme comunitarie e nazionali in materia di sicurezza degli alimenti opera distinzioni sulla base della qualità o del prezzo: ogni consumatore, indipendentemente dal budget dedicato alla spesa alimentare, ha diritto allo stesso livello di tutela. La sicurezza e la salubrità degli alimenti, infatti, sono diritti di tutti, e sia le attività di prevenzione che di repressione volte a garantirle, devono interessare l’intera filiera di ogni prodotto immesso sul mercato.
AN INNOVATIVE APPROACH BY MASS SPECTROMETRY FOR THE
RECOVERY OF HIGH-VALUE ANTIOXIDANT NUTRACEUTICALS
FROM PLANTS, DEVELOPMENT OF NEW FUNCTIONAL FOODS,
QUALITY AND SAFETY IN AGRI-FOOD.
Curriculum Coordinator Candidate
School Director
Prof. Bartolino Roberto
Supervisor
Co-Supervisor
Introduction 1
1. Liquid chromatographic separations and mass spectrometry 3
1.1 Liquid chromatography 3
1.1.1 HPLC general features 3
1.1.2 Analytical and preparative chromatography 7
1.1.3 Detectors 8
1.2 Mass spectrometry 9
1.2.1 Electrospray Ionization (ESI) and atmospheric pressure chemical ionization (APCI) 10
1.2.2 Common Mass analyzers: quadrupole and TOF 12
1.2.3 Hybrid mass analyzers: triple quadrupole and QqTOF 15
1.3 Liquid chromatography-Mass spectrometry 16
1.3.1 LC-MS for low molecular weight compounds 16
References 18
2. LC/MS applications on food chemistry 19
2.1 Flavonoids 20
2.1.1 Flavonoids in food 21
2.1.2 Citrus flavonoids 22
2.1.3 Liquid chromatography/mass spectrometry for separation and structural determination 26
2.2 Phenolic compounds in Olea europaea L. 31
2.2.1 Analytical methods for the separation, identification and quantification of phenolic
compounds in Olea europaea L. 34
References 36
3. Experimental section 40
3.1 Recovery of nutraceuticals of high antioxidant value from Citrus Bergamia Risso and
development of new functional foods 40
3.1.1 Recycling of industrial essential oil waste: Brutieridin and Melitidin, two
anticholesterolaemic active principles from bergamot albedo 42 3.1.2 Purification of anticholesterolaemic nutraceuticals of Citrus juice flavonoids
by flash chromatography 49
3.2.1 Recovery of nutraceuticals of high antioxidant value from aqueous solution used
during the debittering processes of drupes 63
3.2.2 Composition of plant virgin oils obtained from Oleaceae fruits 75
3.3 Quality and safety in agri-food 81
3.3.1 Identification of new Phenolic Compounds in Extra Virgin Olive Oils by Applications
of Different Mass Spectrometry Scan Modes 82
3.3.2 Approach to the phenolic profile of a superintensive Arbosana cultivar by mass spectrometry 85 3.3.3 Determination of spinosad residues in olive drupes using high-performance liquid
1
Introduction
A number of researches have evidenced the beneficent effects on the health of the “Mediterranean diet” founded on the consumption of vegetables, cereals, fish and olive oil. Studies indicate people who eat a “Mediterranean diet” are less likely to have cardiovascular disease and cancer, and they live longer. It has been estimated that up to 70% of all cancer is
attributed to diet.
Biophenolic compounds are natural phenolic biomolecules widely distributed in plants (principally fruits, and in minor amount, flowers, leaves and other vegetable organs) that offer protection against cancer and others disorders. They may occur in various forms: free or in a conjugated form, mainly with a sugar molecule or as esters. With the term biophenols we include not only compounds with phenolic molecular structures, but also related compounds as metabolites or degradation products. The plant phenols being regarded as those substances derived from the shikimate pathway and phenylpropanoid metabolism. Their metabolic pathways are particularly complex with multiple alternative metabolic fates that may vary markedly from tissue to tissue, from one growing condition to another, and in response to environmental stimuli. Factors contributing to the variability in phenolic distribution include the cultivar and genetics, maturity, climate, position on the tree, rootstock and agricultural practices. In the case of processed products, technological processes to which olive fruits are exposed may also impact significantly on the phenolic content.
However, over the past few years, following the growing interest in antioxidant bioactive compounds and their dietary sources has attracted attention as a result of its remarkable flavonoid content. The development of new methods of extraction of nutraceuticals compounds without use of toxic and expensive solvents is crucial for the introduction of new active principles as drugs. Therefore, in this thesys we want to validate modern appropriate extracting procedures, meeting pharmacopoeia requirements, to set-up safety protocols for the recovery of the bioactive compounds present in food (bergamot, olive oils and drupes) using water as extracting solvent. The recovery of compounds of high antioxidant value can be useful as raw materials for the direct application in cosmetics, for the production of food supplements and the development of new functional foods enriched in bioactive compounds. Also, quality (e.g. olive oils) and safety control and the validation of origin are hot issues in the production of food and its distribution, and are of primary concern to food and agriculture organization. Quality and safety are the two main issues related to genuineness of processed and fresh aliments. In food safety, there are different problems related to chemicals in foodstuffs. Certain food has the potential of containing chemicals which, if eaten in sufficient quantities, are harmful to human health. Other food can be contaminated by illegal dyes. The White Paper on Food Safety outlines a comprehensive range of actions needed to complement and modernize existing EU food legislation. Moreover, the Food Standards Agency aims to protect the consumer from these chemicals, and for this reason must maintain the best knowledge base possible on the subject to provide the necessary tools to ensure that consumer exposure to these chemicals is kept as low as reasonably practicable. The quantitative LC-MS/MS methodology is utilized in food safety, agricultural and forensic chemistry. The Modern mass spectrometry (MS) provides unique, reliable and affordable methodologies to approach with a high degree of scientific nature any problem which may be
2
posed in this field.
The production and consumption of food is central to any society, and has economic, social and, in many cases, environmental consequences. Although health protection must always take priority, these issues must also be taken into account in the development of food policy.
3
1.
Liquid chromatographic separations and mass spectrometry
Mass spectrometry is an important tool virtually in all the application of atomic and molecular sciences. In some fields, the practice of mass spectrometry can be described as mature. In others, both the technology and the basic science associated with the application of mass spectrometry are rapidly evolving. The combination of chromatography and mass spectrometry is a subject that has attracted much interest over the last forty years or so because has had a tremendous impact on mass spectrometry with significant time and effort being expanded on improving the mating of the two techniques.1 Similarly, developments in mass spectrometry have also had a dramatic effect in the separation sciences. One of the most important field in which this combination has had a strong improvement is certainly the agricultural sciences.2 Tandem mass spectrometry has, in addition to single-stage mass spectrometry, become a particularly important analytical methodology in many application areas like a food safety or in the structure elucidation of unknown compounds from biological samples.3-4
Thus, mass spectrometry provides a perspective on the significant changes in strategies to solve specific problems in the life sciences.
1.1 Liquid chromatography
Liquid chromatography (LC), the generic name used to describe any chromatographic procedure in which the mobile phase is a liquid, is used for analysis of complex mixtures of unvolatile samples. Modern high resolution LC (HPLC), has now become firmly established at the forefront of chromatographic techniques. HPLC is used for a wide range of applications and offers significant advantages in the analysis of pharmaceutical formulations, biological fluids, environmental residues and trace element contaminants.5 Volatility or thermal stability of the analytes is no longer a limit, as in the Gas Chromatographic (GC) applications, thus making LC the method of choice for polymers, polar, ionic and thermally unstable materials. Moreover, sample detection and quantitation can be achieved by means of continuous flow detectors; thus improving accuracy and precision of analysis.
1.1.1 HPLC general features
In HPLC, a liquid sample, or a solid sample dissolved in a suitable solvent, is carried through a chromatographic column by a liquid mobile phase. Separation is determined by solute/stationary-phase interactions.
Different types of columns are available for various types of separation techniques referred as, normal phase, reverse phase, size exclusion, Ion exchange and affinity chromatography. In each case, however, the basic instrumentation is essentially the same(fig 1.1.1).
4
Figure 1.1.1 Schematic diagram of HPLC system.
In the normal phase mode, the retention is governed by the interaction of the polar parts of the stationary phase and solute. Retention occurs when the packing is more polar than the mobile phase with respect to the sample.
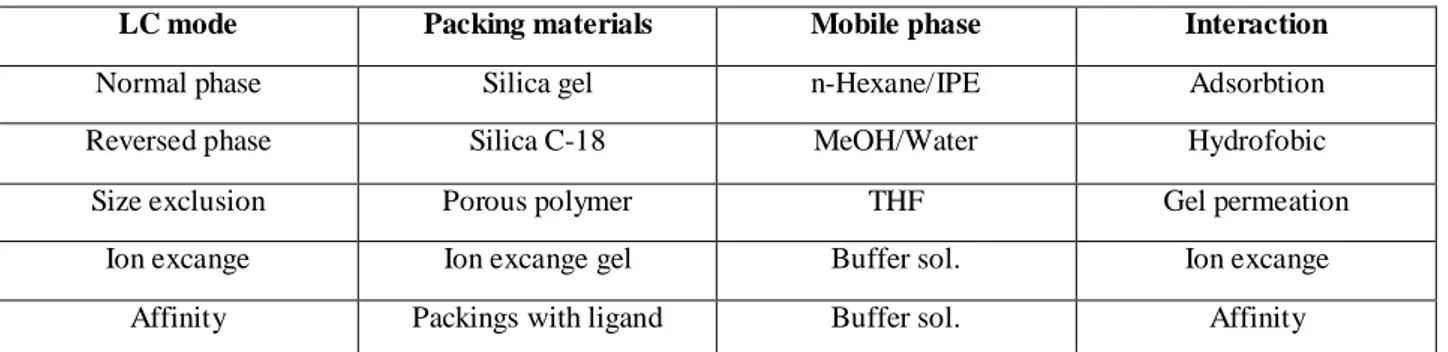
In the reverse phase approach, the packing material is relatively unpolar while the solvent is polar with respect to the sample. Retention is the result of interaction of the unpolar components of the solutes and the unpolar stationary phase. In the ion exchange column type, the mixture components are separated on the basis of attractive ionic forces between molecules carrying charged group of opposite charge on the stationary phase. Finally, affinity chromatography requires that an immobilized ligand, covalently coupled to the column’s stationary phase, interacts specifically and reversibly with the solute of interest. The table 1.1.1, summarizes the different HPLC performances and reports the most commonly used packing materials.
LC mode Packing materials Mobile phase Interaction
Normal phase Silica gel n-Hexane/IPE Adsorbtion
Reversed phase Silica C-18 MeOH/Water Hydrofobic
Size exclusion Porous polymer THF Gel permeation
Ion excange Ion excange gel Buffer sol. Ion excange
Affinity Packings with ligand Buffer sol. Affinity
Table 1.1.1. Common LC column characteristics.
Reversed phase separation6-7 are about the most used HPLC method in food analysis and high-performance columns that provide minimum broadening of the separated bands are the heart of the modern LC system. Besides the nature of the packing material, an important role is played by the way how the columns are packed. They need also to be appropriately designed in order to minimize the dispersion and to allow the individual solutes to reach the detector, after they have been moved apart and separated. After injection into an HPLC column, any sample components that does not interact with the stationary phase would be eluted in the void volume (vo) which is characteristic for that column. This void volume represents both the interstitial volume between the particles of the bonded phase and the available volume within the particle pores themselves. The retention times,
Pump Gradient Elution Unit Injector Auto sampler Column oven Column Reagent pump Detector Data processor Fraction collector Drain System Controller
5 tr(A) and tr(B), for the two sample components shown in Figure 1.1.2 are the times elapsed from injection to the times of maximum concentration in the eluted peaks. Similarly, the retention volumes are the amounts of solvent required for their elution. The basic principle of this separation techniques derive from various parameters that are summarized here:
• Theoretical plates
• HETP (height equivalent to a theoretical plate) • Retention factor
• Selectivity • Resolution
The number of theoretical plates (N) has traditionally been used as a measure of column efficiency. N = 16(tr/W)2 (eq. 1)
where tr is the retention time and W is the peak width at baseline (equation 1).
Figure 1.1.2. Important chromatographic parameters.
Generally, the measurement of peak width at half height has been found to be most useful, since it can be applied to peaks not completely resolved, that exhibit tailing , or that are otherwise asymmetrical in shape.
N = 5.54(tr /w½)2 (eq. 2) where w½ is peak width at half height (equation 2).
The value of N is a useful measure of the performance of a chromatographic column, and in general the more the theoretical plates, the better are the column performances. The number of theoretical plates can be calculated for any peak in a given separation, with each calculation resulting in a slightly different value. The value for N is to a first approximation, independent of retention time; however, it is proportional to column length. Therefore, height equivalent to a theoretical plate (HETP) is the better measure
of column efficiency since it allows for a comparison between columns of different lengths (equation 3):
H = HETP = L/N (eq 3) where L is the length of the column, usually in mm.
The retention factor (k’) is a measure of the degree of retention and can be calculated by the following equation:
k’ = (Vr - Vo)/Vo = (tr - to)/to (eq 4)
where k’ is the number of column volumes required to elute a particular solute Vo and to represent the void volume and void time, respectively.
6
adjacent resolved peaks. This value is the ratio of the retention factors for the two peaks (equation 5):
α = k’1/k’2 (eq 5)
Resolution is defined as the extent between separation of two chromatographic peaks.
It can be described as a measure of how well a given HPLC column separates the two components (equation 6).
Rs = 2(tr(B) - tr(A)) / (WA + WB) (eq 6)
Resolution can also be described in terms of an equation which includes three factors: the selectivity factor α, the capacity factor k’, and the plate number, N (equation 6). Thus:
Rs = α k’ N (eq 7) The characteristics of column are:
• Column dimension (length and internal diameter of packing bed)
• Particle shape (spherical or irregular)
• Particle size (average particle diameter, typically 3-20µm)
• Surface Area (sum of particle outer surface and interior pore surface, in m2/gram) • Pore size (average size of pores or cavities in particles, ranging from 60-10.000 Å
• Bonding type (monomeric: single-point attachment of bonded phase molecule; polymeric:
multi-point attachment of bonded phase molecule.
• Carbon load (amount of bonded phase attached to base material, expressed as % C
• Endcapping (capping of exposed silanols with short hydrocarbon chains after the primary
bonding step).
Column dimensions should be carefully chosen.8,9 The short columns (30-50 mm length) offer short run times, fast equilibration, low backpressure and high sensitivity. Long columns (250-300 mm length) provide higher resolving power, but create more backpressure, lengthen analysis times and use more solvent. Narrow column (2.1 mm and smaller) beds inhibit sample diffusion and produce narrower, taller peaks and a lower limit of detection.
They may require instrument modification to minimize distortion of the chromatography. Wider columns (10-22 mm) offer the ability to load more sample.
The table 1.1.2 shows the relationship between column internal diameter and flow, mass load and volume injection parameters.
Table 1.1.2. Setting of different parameters in HPLC.
ID (mm) Flow (ml/min) Mass load (mg) Injection vol (µl) 0,3-0,5 5-10 µl/min 0,00005-0,01 0,01-0,5 1 25-75 µl/min 0,005-0,05 0,2-5 2 0,15-0,25 0,002-0,3 1-20 3 0,3-0,6 0,1-1 2-40 4,6 0,5-1,5 0,2-5 5-100 10 2,5-10 1-40 20-50 21,2 15-40 5-200 100-2000 50 50-100 25-1000 600-10000 100 200-500 125-5000 2300-50000
7
1.1.2 Analytical and preparative chromatography
The difference between analytical and preparative HPLC concerns the aim of the separation. In analytical HPLC the aim is to separate all individual components of a mixture as completely as possible with subsequent identification of the peaks. In general, sample sizes are small. For 4 mm ID, typical sample sizes are 1 – 100 µg analyte per g adsorbent in normal phase columns and 10 – 1000 µg analyte per g adsorbent in RP columns. For columns with smaller inner diameters correspondingly smaller samples are applied. Thus analytical HPLC often requires maximum separation efficiency of a column. Due to the small inner diameter, expenses for solvents and packing are low, with the result that in analytical HPLC costs for separation time (solvent consumption) and packing material can be almost neglected for method development.
On the contrary, in preparative HPLC development of a separation often involves detailed economical-chemical optimization calculations.
Due to the column dimensions, costs for solvents and packing or prepacked columns become more and more important with increasing column diameters. The aim of HPLC now is isolation of the desired product with defined purity, in maximum amounts and with minimum time. The important parameter are called production rate and throughput. Definition of the production rate includes information about the required purity of the isolated product.
When speaking about the production rate of a preparative separation, the term loadability10-12 of the column should be considered, too. According to general understanding, this is the maximum sample size (with defined sample mass and volume) under which a column still provides optimum selectivity.
The parameters which are important for the optimization of the mass loadability of a column can be described by the formula:
M= C1 π r2 l k d AS [C2 (dP2/l)]2 M = maximum sample mass
C1, C2 = constants r = column radius l = column length k = partition coefficient d = packing density AS = adsorbent surface dP = particle diameter.
It is important to note how the mass loadability of the column decreases with increasing plate number (l/dP2 proportional to the plate number N).
If an increased loadability is required for a given separation efficiency, it is recommended to increase particle size and column length, the increase in column length being the square of the increase in particle diameter. Volume loadability can be related to the dead volume (V0), the maximum overload volume (VL), the relative retention (α), the plate number (N) and the capacity factors (kA’, kB’) by equation 8, hence it depends on the k’ values of the components to be separated and on the separation efficiency of the column.
VL = V0 [(α-1) kA’ – 2/N1/2 (2 + kA’ + kB’) (eq. 8)
The production rate is directly proportional to the column diameter, the linear flow velocity of the mobile phase, the concentration of the component to be isolated (unless under mass overload
8
conditions) and the term [1/N–H0 /l]1/2 , where H0 is the plate height of the column under ideal conditions, l is the column length, and N is the plate number required for separation of the desired product with the purity required.13
1.1.2 Detectors
Although over the years a large number of LC detectors have been developed and described, the vast majority of all contemporary LC analyses are carried out mainly using four detectors.
The UV, in one of its different forms, the electrical conductivity, the fluorescence and the refractive index.
The widespread use of the UV spectrophotometer approach deserves a detailed description of the method. The coupling with mass analyzers will be treated in a different paragraph. UV absorption detectors respond to those substances that absorb light in the range 180 to 350 nm. Many (but not all) substances absorb light in this wavelength range, including those having one or more double bonds (p electrons) and unshared (unbounded) electrons, e.g. olefin and aromatic compounds and species containing C=O, C=S and –N=N– groups.
The sensor of a UV detector consists of a short cylindrical cell having a capacity between 1 and 10 ml through which passes the column eluant. UV light is arranged to pass through the cell and fall on a photo–electric cell (or array). The signal from the photocell is transmitted to a modifying amplifier and then to a recorder or data acquisition system.
The relationship between the intensity of UV light transmitted through a cell (IT) and the concentration of solute contained by it (c) is given by Beer's Law (equation 9).
IT = IOe -klc
or ln (IT) = ln (IO) – kcl (eq 9)
where (IO) is the intensity of the light entering the cell, (l) is the path length of the cell, and (k) is the molar extinction coefficient of the solute for the specific wavelength of the UV light.
UV detectors can be used with elution gradients, providing the solvents do not absorb significantly in the wavelength range used for the detection. The solvents usually employed in reversed phase chromatography are water, methanol, acetonitrile and tetrahydrofuran (THF), all of which are transparent to UV light over the total wavelength range normally used by UV detectors. In normal phase operation more care is necessary in eluant selection since many solvents that might be appropriate for a given chromatographic phase strongly absorb at the wavelengths used by the detector. The n-paraffin, methylene dichloride, aliphatic alcohols and THF are useful solvents that are transparent in the UV and can be used with a polar stationary phase such as silica gel.
9 1.2 Mass spectrometry
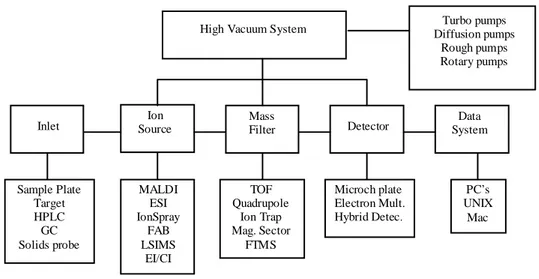
Mass spectrometry is essentially a technique for "weighing" molecules. Obviously, this is not done with a conventional balance. Instead, mass spectrometry is based upon the motion of a charged particle, called ion. Figure 1.2.1 is a block diagram that shows the basic parts of a mass spectrometer. The inlet transfers the sample into the vacuum of the mass spectrometer. In the source region, neutral sample molecules are ionized and then accelerated into the mass analyzer.
The mass analyzer is the heart of the mass spectrometer. This section separates ions, either in space or in time, according to their mass to charge ratio. After the ions are separated, they are detected and the signal is transferred to a data system for analysis. All mass spectrometers also have a vacuum system to maintain the low pressure, which is also called high vacuum, required for operation. A variety of ionization techniques are used for mass spectrometry.
Most ionization techniques excite the neutral analyte molecule which then ejects an electron to form a radical cation (M+•). Other ionization techniques involve ion molecule reactions that produce adduct ions (MH+). High vacuum minimizes ion-molecule reactions, scattering, and neutralization of the ions.
The most important considerations are the physical state of the analyte and the ionization energy. Electron ionization and chemical ionization are only suitable for gas phase ionization. Electrospray ionisation (ESI)14-15, and matrix assisted laser desorption (MALDI)16 are used to ionize condensed phase samples.
Figure 1.2.1. Mass spectrometry block diagram.
The ionization energy is significant because it controls the amount of fragmentation observed in the mass spectrum. Although this fragmentation complicates the mass spectrum, it provides structural information for the identification of unknown compounds. Some ionization techniques are very soft and only produce molecular ions, other techniques are very energetic and cause ions to undergo extensive fragmentation. Currently, API (ESI and APCI) and MALDI are the most commonly employed ionization methods and they opened doors to the widespread biological and biomedical application of mass spectrometry. These techniques are used to ionize thermally labile samples such as flavonoids, peptides, proteins and polymers directly from the condensed phase. Otherwise, the
Inlet Source Ion Mass Filter Detector System Data High Vacuum System Diffusion pumps Turbo pumps
Rough pumps Rotary pumps Sample Plate Target HPLC GC Solids probe MALDI ESI IonSpray FAB LSIMS EI/CI TOF Quadrupole Ion Trap Mag. Sector FTMS Microch plate Electron Mult. Hybrid Detec. PC’s UNIX Mac
10
selection of a mass analyzer is very important and depends upon the resolution, mass range, scan rate and detection limits required for an application.17 Each analyzer has very different operating characteristics and the selection of an instrument involves important tradeoffs. Analyzers are typically described as either continuous or pulsed. Continuous analyzers include quadrupole filters and magnetic sectors while pulsed analyzers include time-of-flight, ion cyclotron resonance, and quadrupole ion trap mass spectrometers. There are also different hybrid analyzers; two popular of these are triple quadrupole and Qq-TOF. The former is utilized for quantitative analysis in tandem mass spectrometry, the latter is applied in high resolution analysis.
1.2.1Electrospray Ionization (ESI) and atmospheric pressure chemical ionization (APCI)
The electrospray process involves the creation of a fine aerosol of highly charged micro droplets in a strong electric field. Electrospray as an ionization technique for mass spectrometry was developed by Dole and co-workers in the late 1960s14 and considerably improved upon by Yamashita and Fenn who in 1984 coupled an electrospray source to a quadrupole mass analyser15. A continuous flow of solution containing the analyte from a highly charged (2–5 kV) capillary generates an electrospray. The solution elutes from the capillary into a chamber at atmospheric pressure, producing a fine spray of highly charged droplets due to the presence of the electric field (figure 1.2.2), a process called nebulisation. A combination of thermal and pneumatic means is used to desolvate the ions as they enter the ion source.
Figure 1.2.2. The desolvation process.
The solvent contained in the droplets is evaporated by a warm counter-flow of nitrogen gas until the charge density increases to a point at which the repulsion becomes of the same order as the surface tension. The droplet then may fragment in what is termed a ‘Coulomb explosion’, producing many daughter droplets that undergo the same process, ultimately resulting in bare analyte ions.
An alternative picture is one in which the ions ‘evaporate’ from the surface of the droplet. Whatever the exact mechanism, ESI is a very ‘soft’ means of ionization that causes little or no fragmentation of the sample.20-21The electrospray ion source is at very high pressure (atmospheric) with respect to the very low pressure that is required for ion separation by a mass analyzer, so the interface between the two involve a series of skimmer cones (acting as small orifices) between the various differentially pumped regions (figure 1.2.3). Early designs had the capillary exit pointing directly
11 into the mass analyzer but to limit contamination practically all modern designs have an orthogonal (or at least off-axis) spray direction.
Figure 1.2.3. An electrospray source.
The ions are drawn into the spectrometer proper through the skimmer cones. A voltage can be applied (the cone voltage), which will accelerate the ions relative to the neutral gas molecules. This leads to energetic ion-neutral collisions and fragmentation due to what is termed collision induced dissociation (CID)22. The remaining bath gas is pumped away in stages (in order to attain the high vacuum necessary for separation of the ions) and the ions are focused through a lensing system into the mass analyzers.
The appearance of multiply charged species enables ESI to characterize compounds whose molecular weight would otherwise be far in excess of that accessible to most mass analysers23-24. Biological macromolecules tend to accumulate one unit of charge for every 1 – 2000 Da, so nearly all proteins, for example, produce signals in the region of 1 – 2000 m/z, regardless of their actual molecular weight. Ionization of a neutral analyte often occurs by protonation, or alternatively cationisation, with an adventitious cation present in the solvent used, such as Na+, K+ or NH4+. In some cases, adduct ions with several cations can occur, giving [M + H]+, [M + NH4]+, [M + Na]+ and [M + K]+ ions. Atmospheric-pressure chemical ionization (APCI)25-26 is another of the techniques in which the stream of liquid emerging from an HPLC column is dispersed into small droplets, in this case by the combination of heat and a nebulizing gas. In this case the liquid flow is passed through a pneumatic nebulizer where the droplets are both generated and desolvated. The successive neutral dried spray, obtained by a heated region, passed through a corona discharge were the analyte are ionized. The mechanism is a chemical ionization but an atmospheric pressure were is necessary, for initial gas ionization, utilized a corona discharge(fig. 1.2.4).
12
Figure 1.2.4. APCI source.
Then, the ions produced by the interaction of the electrons with the surrounding gas, undergo a number of reactions leading to the generation of reactive ions which interact with the analyte molecules present.
The reagent species in the positive-ion mode may be considered to be protonated solvent ions, and in the negative ion mode O2-, its hydrates and clusters. Is also possible the formation of cluster involving solvent molecules which can removed with use a “curtain gas”. Finally, this technique can be applied both volatile and thermally stable and moderate polar compounds but the ionization regime is much more harsh that ESI and this precludes its use for the study of large biomolecules, with the mass limit for APCI being generally considered as below 2000 Da.
1.2.2 Common Mass analyzers: quadrupole and TOF
Quadrupole mass analyzers consist of four parallel rods arranged as in Figure 1.2.5. Applied between each pair of opposite and electrically connected rods are a DC voltage and a superimposed radio-frequency potential.
A positive ion entering the quadrupole will be drawn towards a negatively charged rod but if the field changes polarity before the ion reaches it, it will change direction. Under the influence of the combination of fields the ions undergo complex trajectories27-29. Within certain limits these trajectories are stable and so ions of a certain m/z are transmitted by the device, whereas ions with different m/z values will have an unstable trajectory and be lost by collision with the rods.
The operation of a quadrupole mass analyzer is usually treated in terms of a stability diagram that relates the applied DC potential (U), the applied rf potential (V) and the radio frequency (ω) to a stable vs unstable ion trajectory through the quadrupole rods.
13 Figure 1.2.5. Diagram of a quadrupole mass analyzer.
A qualitative representation of a stability diagram for a given mass m is shown in figure 1.2.6; a and q are parameters that are proportional to U/m and V/m respectively: changing the slope of the scan line will change the resolution. Quadrupoles have other functions besides their use as a mass filter.
Figure 1.2.6. Stability diagram.
An rf-only quadrupole will act as an ion guide for ions within a broad mass range. In such applications, hexapoles or even octapoles are often employed.
The time-of-flight (TOF)29-30 mass analyzer separates ions in time as they travel down a flight tube These instruments have high transmission efficiency, no upper m/z limit, very low detection limits, and fast scan rates. In the source of a TOF analyzer, a packet of ions is formed by a very fast (ns) ionization pulse. These ions are accelerated into the flight tube by an electric field (typically 2-25 kV) applied between the backing plate and the acceleration grid. Since all the ions are accelerated across the same distance by the same force, they have the same kinetic energy. Because velocity (v) is dependent upon the kinetic energy (E ) and mass (m) lighter ions will travel faster.
The velocity of an ion (v) is determinate as a function of acceleration voltage and m/z value( equation 10):
m zeV
v= 2 (eq 10)
After the ions accelerate, they enter a 1 to 2 meter flight tube(fig. 1.2.7). The ions drift through this field free region at the velocity reached during acceleration. At the end of the flight tube they strike a detector. The time delay (t) from the formation of the ions to the time they reach the detector dependents upon the length of the drift region (L), the mass to charge ratio of the ion, and the acceleration voltage in the source (equation 11):
14 zeV mD t 2 = (eq 11)
This second equation shows that low m/z ions will reach the detector first. The mass spectrum is obtained by measuring the detector signal as a function of time for each pulse of ions produced in the source region. Because all the ions are detected, TOF instruments have very high transmission efficiency which increases the S/N level.
Figure 1.2.7. The essential of TOF optics.
The ions leaving the ion source of a time-of-flight mass spectrometer have neither exactly the same starting times nor exactly the same kinetic energies. Improvements in time of-flight mass spectrometer design have been introduced to compensate for these differences, and the most dramatic improvements in performance come with the use of a reflectron.31
This is an ion optic device in which ions in a time-of-flight mass spectrometer interact with an electronic ion mirror and their flight is reversed. Ions with greater kinetic energies penetrate deeper into the reflectron than ions with smaller kinetic energies. The reflectron will decrease the spread in the ion flight times, and therefore improve the resolution of the time-of-flight mass spectrometer. Orthogonal TOF32 analyzers are employed in conjunction with continuous ion sources, especially ESI33, and in hybrid instruments. The continuous ion beam is subjected to a pulsed electric field gradient at right angles (orthogonal) to the direction of the ion beam. A section of the ion beam is thus pulsed away instantaneously and can be measured using a TOF analyzer (fig. 1.2.8).
Figure 1.2.8. Orthogonal TOF.
Orthogonal TOF analyzers can accumulate tens of thousands of spectra per second and these are summed to provide spectra with high signal-to-noise ratios.
15
1.2.3 Hybrid mass analyzers: triple quadrupole and QqTOF
In a triple quadrupole, two mass analyzers are separated by an rf-only quadrupole used as a collision cell (fig. 1.2.9). MS/MS34 experiments are easy to set up on triple quadrupoles, and are especially valuable when examining complex mixtures of ions. Each ion may be selected and individually fragmented to provide structural information exclusively on that ion, without any need for consideration of interference from other ions in the mixture.
Figure 1.2.9. Scheme of triple quadrupole.
With this analyzer is possible to carry out different processes in tandem mass spectrometry. The processes are:
• Product ion scan; the first quadrupole is set so that it passes only ions of a certain m/z value, the rf-only quadrupole contains an inert collision gas (typically argon) to assist in the creation of fragment ions and the third quadrupole scan the mass range of interst and generates a daughter ion spectrum.
• Precursor ion scan; MS1 scan through all ions, which are fragmented in the collision cell, and MS2 is set to detect only product ions of a certain mass.
• Neutral loss scan; this involves setting up MS1 and MS2 to scan in parallel but offset by a set mass difference, ∆m.
• Select reaction monitoring; both MS1 and MS2 are settled on only one ion, father and daughter respectively.
The most popular Hybrid of TOF analyzer is certainly the quadrupole/oa-TOF35. In these instruments (fig. 1.2.10), the first mass analyzer (MS1) is a quadrupole, which acts simply as an rf-only ion guide in MS mode.
Figure 1.2.10. Quadrupole/oa TOF.
S D
16
Next is a collision cell, followed by the oa-TOF (MS2). To collect MS/MS data, MS1 is used to select a single ion, which is then fragmented in the collision cell, and MS2 is used to collect the daughter ion spectrum. Fast, highly efficient, sensitive and capable of high resolution, the Q/TOF provides higher quality data than the popular triple quadrupole, though it is less suitable for quantitative work.
1.3 Liquid chromatography-Mass spectrometry
The development of new ionization methods as ESI and APCI, has been fundamental for coupling liquid chromatography to mass spectrometry.1 They represents perfect LC-MS interfacing technologies. Even LC-nano ESI is feasible.36 With these interfaces is possible to remove the incompatibility between HPLC, utilizing flow rates of ml/min of a liquid, and the mass spectrometer, which operates under conditions of high vacuum. It’s due to the fact which ionization occurs directly from solution and consequently allows ionic and thermally labile compounds to be studied.
This combination allows more definitive identification and the quantitative determination of compounds that are not fully resolved chromatographically.
The major advantage of this coupling is the possibility to study a range of analyte, from low molecular-weight drugs and metabolites (<1000 Da) to high-molecular-weight biopolymers (>100 000 Da). Method development requires the analyst to identify the variables (factors) that are likely to affect the result of the analysis and to carry out experiments that allow those that have an effect on the final outcome to be identified. Having identified the factors of importance, experimental design finally allows the precise experimental conditions that give the ‘best’ result to be determined. This ‘factors’ could include for HPLC, the composition of the mobile phase, its pH and flow rate37, the nature and concentration of any mobile-phase additive, buffer or ion-pair reagent, the make-up of the solution in which the sample is injected for the ionization technique38, spray parameters for electrospray source, nebulizer temperature for APCI, nature and pressure of gas in the collision cell if MS–MS experiment is performed.22
1.3.1 LC-MS for low molecular weight compounds.
When ‘low’-molecular-weight compounds are involved, both APCI and electrospray ionization are potentially of value and the first task is to decide which of these will give the more useful data. The choice of interface is relative to polarity of sample: APCI for low- to medium-polarity and electrospray for medium- to high-polarity.
In general terms, electrospray ionization is considered to be concentration sensitive at ‘low’ flow rates and sensitive at ‘high’ flow rates, while APCI is considered to be mass-flow-sensitive. Some compounds may be ionized very effectively under positive-ionization conditions, while others may require the formation of negative ions to allow analysis. Structural studies of low molecular weight compounds may require the extent of fragmentation to be maximized, but in this way is important to have an high resolution analyzer for calculate an exact mass so father as daughters ions. This factor is fundamental for reveal compounds which differ few mDa one another. Quantification may require the opposite, the efficient production of a small number of ions of different m/z ratios, in order to maximize sensitivity.
17 Quantification involves the comparison of the intensity of response from an analyte (‘peak’ height or area) in the sample under investigation with the intensity of response from known amounts of the analyte in standards measured under identical experimental conditions.
The attributes required of a method usually include good sensitivity, low limits of detection, and selectivity. Good selectivity allows the measured signal to be assigned, with certainty, to the analyte of interest rather than any interfering compounds which may be present. Low limits of detection allows to reveal very few quantities of compounds. There are three methods for quantification utilizing the standard solution: external standard, standard additions and internal standard. The former is the main method used when the detector is a mass spectrometer. Quantitative methodology employing mass spectrometry usually involves selected-ion monitoring or multiple reaction monitoring, sometimes using a labelled internal standard for accurate quantification.39 It is the role of the analyst to choose these ions/decompositions, in association with chromatographic performance, to provide sensitivity and selectivity such that when incorporated into a method the required analyses may be carried out with adequate precision and accuracy.
18
References
1. K. B. Tomer. Chem. Rev. 2001, 101, 297-328.
2. M. Careri; F. Bianchi; C. Corradini. Journal of Chromatography A 2002, 970, 3-64.
3. L. Di Donna; G. Grassi; F. Mazzotti; E. Perri; G. Sindona. J. Mass Spectrom. 2004, 39, 1437-1440.
4. A. De Nino; N. Lombardo; E Perri; A Procopio; A. Raffaelli; G. Sindona. J. Mass Spectrom. 1997, 32, 533-541. 5. V.R.Meyer. Practical High Performance Liquid Chromatography Wiley, Chichester, UK, 1994.
6. H M. Merken; G. R. Beecher. J. Agr Food Chem. 2000, 48,3, 577-599.
7. R.W. Owen; A. Giacosa; W.E. Hull; R. Haubner; B. Spiegelhalder; H. Bartscha. European Journal of Cancer 2000, 36, 1235-1247.
8. J.S. Andersen; C.J. Wilkinson; T. Mayor; P. Mortensen; E.A. Nigg; M. Mann. Science 2005, 308,1472-1477. 9. Y. Takenaka.; T. Tanahashi; M. Shintaku; T. Sakai; N. Nagakura; Parida. Phytochemistry 2000, 55 275-284. 10. L.R. Snyder. Anal. Chem. 1967, 39, 698.
11. W. Beck; I. Halasz. Anal. Chem. 1978, 291,340.
12. T. Roumeliotis; K.K. Unger. J. Chromatogr. 1979, 185,445. 13. K.P. Hupe; H.H. Lauer. J. Chromatogr. 1981, 203, 41.
14. M. Dole; L. Mach; L.R. Hines; R.C. Mobley; L.P. Ferguson; M.B.Alice. J. Chem. Phys. 1968, 49, 2240-2249. 15. M. Yamashita; J.B. Fenn. J.Phys. Chem. 1984, 88, 4451-4459.
16. M. Karas; F. Hillenkamp. Anal. Chem. 1988, 60, 2299-2301. 17. M. Wells, S.A. McLuckey. Chem. Rev. 2001, 101, 571-606. 18. S.A. McLuckey. Adv. Mass Spectrom. 1998, 14, 153-196. 19. E.R. Badman; R.G. Cooks. J. Mass Spectrom. 2000, 35, 659-671. 20. S.J. Gaskell. J. Mass Spectrom. 1997, 32, 677-688.
21. P. Kebarle. J. Mass Spectrom. 2000, 35, 804-817.
22. V. Gabelica; E. De Pauw. Mass Spectrometry Reviews 2005, 24, 566-587.
23. H.M. Amad; N.B. Cech; G.S. Jackson; C.G. Enke. J. Mass Spectrom. 2000, 35, 784-789. 24. R.B. Cole. 2000, 35, 763-772.
25. F. Hillenkamp. Advance in Mass Spectrom. 1989, 11, 354.
26. M. Karas; F. Hillenkamp. Methods in Enzimology. 1990, 193, 280.
27. J.F.J. Todd. International Journal of Mass Spectrometry and Ion Processes.1984, 60, 3. 28. P.H. Dawson. Mass Spectrometry Reviews. 1986, 5, 1.
29. M. Guilhaus; V. Mlynski; D. Selby. Rapid Commun. Mass Spectrom. 1997, 11, 951. 30. K.G. Standing. Int. J. Mass Spectrom. 2000, 200, 597.
31. B.A. Mamyrin; V.I. Karataev; D.V. Shmikk; V.A. Zagulin. Sov. Phys. JETP 1973, 37,45. 32. J.H.J. Dawson; M. Guilhaus. Rapid Commun. Mass Spectrom. 1989, 3, 155.
33. I.V. Chernushevich; W. Ens; K. G. Standing. Anal. Chem. 1999, 71, 452A. 34. A. Benninghoven; D.Jasper; W. Sichtermann. Appl. Phys. 1976, 11, 36.
35. I.V. Chernushevich; A.V. Loboda; B.A. Thomson. J. Mass Spectrom. 2001, 36, 849.
36. F. Hsieh; E. Baronas; C. Muir; S.A. Martin. Rapid Commun. Mass Spectrom. 1999, 13,67-72. 37. A. Asperger; J. Efer; T. Koal; W. Engewald; J. Chromatogr. A 2001, 937, 65-72.
38. W.Naidong; Y. Chen; W Shou; X. Jiang. J. Pharm. Biomed. Anal. 2001, 26, 753-767. 39. D.C. Harris. Quantitative Chemical Analysis, 4th Edn, W. H. Freeman, New York, 1995.
19
2.
LC/MS applications on food chemistry
The development of LC/MS techniques1-2 has been fundamental for the analysis of mixtures of secondary metabolites from plants and fruits.3-14 The powerful of this type of analysis is very important in order to improve the research in a life science.
Historically, consumption of particular fruits and vegetables was thought to prevent or cure aliments ranging from headaches to heart disease. In fact, early medicine revolved largely around the prescription of specific food concoctions for certain disorders. Until relatively recently, these attributes of vegetables and fruits were based more on beliefs than on scientific evidence, but during the recent years many studies have examined the relationship between vegetables fruit and health. It has been estimated that up to 70% of all cancer is attributed to diet.15 Nowadays, the scientific evidence regarding a role for vegetable and fruit consumption in cancer prevention is generally consistent and is supportive of current dietary recommendations. A different type of micro-components called PPT (phenols, polyphenols and tannins) with various mechanisms, may help protect against cancer.16-17 Continued attention to increasing vegetable and fruit intake is important. For this reason the structural identification of new compounds derived from these matrixes was becoming an important field of research in which the development of hyphenated methods, like automated semi- or preparative LC-MS, given a very significant contribution.18 For a more complete structure elucidation, the complementary information derived from NMR is indispensable. Further developments may be expected with regards to miniaturization, that is, the coupling of micro- and/or nano-LC, to tandem-MS and NMR instruments: this should facilitate the analysis of minute samples, and help to create better operating conditions for NMR detection. However, the progress in this area has been slower than was expected several years ago.19 In the near future, both, LC with tandem MS detection and preparative LC/MS, will continue to play a dominant role in this analysis.
On other hand, quantitative LC-MS/MS methodology is utilized in food safety, agricultural and forensic chemistry.20-22 In food safety, there are different problems related to chemicals in foodstuffs. Quality and safety control and the validation of origin are hot issues in the production of food and its distribution, and are of primary concern to food and agriculture organization. Modern mass spectrometry (MS) provides unique, reliable and affordable methodologies to approach with a high degree of scientificity any problem which may be posed in this field. Quality and safety are the two main issues related to genuineness of processed and fresh aliments. The specificity and sensitivity of MS methodologies has become officially recognized by international quality-system control-bodies and the exploitation of multistage ion analysis has become mandatory to adhere to worldwide regulations regarding the recognition of fraud and bad practices in food manipulation. The production and consumption of food is central to any society, and has economic, social and, in many cases, environmental consequences. Although health protection must always take priority, these issues must also be taken into account in the development of food policy.
20
2.1 Flavonoids
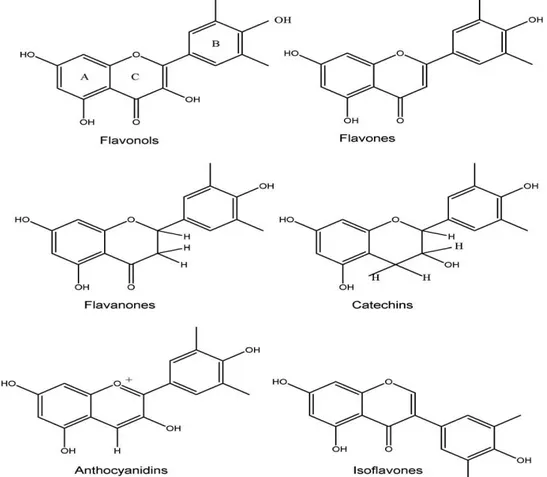
Flavonoids constitute a large group of naturally occurring plant phenols that cannot be synthesized by humans. They are characterised by the carbon skeleton C6-C3-C6 derived from shikimic acid pathway. The basic structure of these compounds consists of two aromatic rings (commonly designated as A and B)linked by a three-carbon aliphatic chain which normally has been condensed to form a pyran (C) or, less commonly, a furan ring.
The main classes of flavonoids, including flavones, flavonols, isoflavones, flavonones (fig. 2.1.1) occur in all types of higher plant tissues.23-24 Approximately 90 % of the flavonoids in plants occur as glycosides.25 Usually the aglycones are more active in bulk phase,26,27 as well as in phospholipid bilayers oxidation.28 Many studies have suggested that flavonoids exhibit biological activities, including antiallergenic, antiviral, anti-inflammatory, and vasodilating actions. However, most interest has been devoted to the antioxidant activity of flavonoids, which is due to their ability to reduce free radical formation and to scavenge free radicals.29-32 Other mechanisms of action of selected flavonoids include singlet oxygen quenching,33-34 metal chelation,35-36 as well as lipoxygenases inhibition.37-40 The glycosides are less effective as antioxidants than are the aglycones.41
Flavonoids with free hydroxyl groups act as free-radical scavengers, and multiple hydroxyl groups, especially in the B-ring, enhance their antioxidant activity.42 There is no evidence that flavonoid intake is protective against some types of cancer,43 but they have a possible role again coronary heart disease as some epidemiological studies reported.44
Fig. 1. Molecular structures of flavonoids. The basic structure consists of the fused A and C ring, with the phenyl ring B attached to through its 10 position to the 2-position of the C ring (numbered from the pyran oxygen).
21 The antioxidant efficacy of flavonoids in vivo is less documented, presumably because of the limited knowledge on their uptake in humans. For example only a weak but insignificant inverse correlation was observed for flavonoid consumption and coronary mortality.45 They are generally poorly absorbed from food, and extensively degraded to various phenolic acids, some of which still possess a radical scavenging ability.Finally, accordingly, the present epidemiological data, far from conclusive, evidence a possible protective role of dietary flavonoids, thus making desirable a regular consumption of foods and beverages rich in flavonoids but is also important to change their role as health-promoting dietary antioxidants and place these observations in a broader context embracing other dietary phenols, and mechanisms other than simple radical scavenging and radical suppression.46
2.1.1 Flavonoids in food
All foods of plant origin potentially contain flavonoids47,48 and over 4000 individual compounds have previously been identified.49
Catechins, flavonols, and proanthocyanidins are abundant in fruits. In contrast, flavanones and flavones are restricted to citrus varieties such as oranges and lemons; in some fruits (e.g., apples), flavonols are principally present in the skin and hence peeling significantly reduces levels unlike catechins which are found in the flesh of fruits.
Quercetin is the most common flavonol in fruits; although kaempferol and myricetin have also been identified in fruits such as peaches and pears, concentrations are generally too low to be readily quantified in the whole fruit. Often termed the citrus flavonoids, flavanones are only found in citrus fruits such as oranges, grapefruit, and lemons.
Allium, Brassica, and Lactuca varieties of vegetables are abundant sources of flavonols, primarily quercetin and kaempferol while catechins are often the most common flavonoids in beverages such as fruit juice, tea, and wine. Wine also contains a complex mix of catechins, flavonols, procyanidins, and flavanones. Procyanidins usually represent 50% of the flavonoids found in red wine, followed by catechins (37%). A similar profile is observed with beer where again procyanidins dominate accounting for 42% of total flavonoid content. Concentrations of flavonoids in foods can vary by many orders of magnitude due to the influence of numerous factors such as species, variety, climate, degree of ripeness, and post harvest storage.48 The flavonoid content of plant foods may be affected by growing conditions. Flavonoid profiles are also influenced by irrigation, which, for example, modifies concentrations and types of anthocyanins and catechins in berries.50
Effects of varietal differences as flavonoid subclasses can vary widely between different cultivars of fruits and vegetables.51 In general, industrially produced products such as tea, red wine, and fruit juice have significantly different flavonoid levels and profiles than the original fresh product.52,53 Processing and preservation can expose fresh products to increased risk of oxidative damage and the activation of oxidative enzymes such as polyphenol oxidase.54Domestic preparation procedures may also affect flavonoid content.55 Initial estimate of flavonoid intake of 1000 mg/day48, has been increased including the aglycon form51 and the different source related to different countries.56
22
2.1.2 Citrus flavonoids
Bergamot is the common name of the fruit Citrus bergamia Risso, which belongs to Rutaceae family, a subfamily of Esperidea. The uniqueness of bergamot trees is represented by a habitat that is virtually restricted to the coastal region of the Ionian Sea in the southern Calabrian region of Italy. This area presents favorable weather and pedoclimatic conditions for its cultivation. Three cultivars of bergamot (“Castagnaro”, “Fantastico”, and “Femminello”) are commercially grown and then industrially processed, exclusively to extract their essential oils. The industrial processing uses an indiscriminate mix of the three cultivars. In the past, bergamot has been highly valued by the cosmetic and perfume industry since its essence is very rich in terpenes, esters, and alcohols possessing a very characteristic and intense fragrance. The development of synthetic essential oil production led to a drastic drop in commercial demand for bergamot. However, over the past few years, following the growing interest in antioxidant bioactive compounds and their dietary sources, such as Citrus juices, bergamot juice has attracted attention as a result of its remarkable flavonoid content.
Flavonoids identified in Citrus fruits cover over 60 types, divided in five classes: flavones, flavanones, flavonols, flavans and anthocyanins (the last only in blood oranges). In particular, this genus is characterized by the accumulation of large quantities of glycosylated flavanones, which are the first intermediaries in the flavonoid biosynthetic pathway. The most common sugar moieties include D-glucose and L-rhamnose. The glycosides are usually O-glycosides, with the sugar moiety bound generally to the aglycone hydroxyl group at C-7, or at the C-3 in some cases. In addition to these, C-glycosides have also been detected in various Citrus fruits or juices. Table 1 presents the flavanone aglycones of recovered glycosides in Citrus juices. All these aglycones have a skeleton in which two hydroxyls are present at the C-5 and C-7 positions. In hesperetin (1) and isosakuranetin (4) the C-4’ position is methoxylated. The flavanone taxifolin (3) contains a hydroxyl group in the C ring C-3 position, and can thus also be classified as a flavanol.
Table 1. Flavanone aglycones.
Flavone aglycones are summarized in Table 2. Acacetin (6) and diosmetin (12) present a methoxy moiety at C-4’ position, whereas in chrysoeriol the methoxyl group is bound to C-3’. Kaempferol (9) and quercetin (10) both bear hydroxyl group at the 3 position and are often referred to as flavonols. Table 3 shows the group of compounds classified as polymethoxyflavones (PMFs). These are usually found as components of the essential oils fraction of Citrus peels57. Hand-squeezed juices contain no detectable traces of this class of compounds58. Commercial juices, on the other hand, are rich in PMFs because the industrial processing of fruits leads to juices being contaminated with the peel constituents.
23 The flavanone O-glycosides found so far in juices are listed in Table 4. These derivatives have a glycosyl substitution exclusively at the C-7 position (on ring A). Furthermore, only two disaccharides have so far been identified in this group of compounds, and both are L-rhamnosyl-D-glucosyl derivatives: rutinose, which presents a α-1,6 interglycosidic linkage, and neohesperidose, in which the two sugars are linked via a α-1,2 interglycosidic bond (Figure 2).
24
Flavone O-glycosides found in Citrus juices are generally rutinosides or 7-O-neohesperidosides (Table 5), although a 3-O-rutinoside has also been reported, namely rutin (39).
Citrus juices also contain a large number of di-C-glycosides, along with smaller amounts of mono-C-glycosides. For these compounds, substitution is generally on either the C-6 or the C-8, or on
25 Recently, our research group has identified, in the whole fruit juice, the presence of two new statin-like flavonoids61, Brutieridin and Melitidin (1, 2, chart), which have been isolated by liquid chromatography (LC) assisted by UV and Mass Spectrometric (MS) detection and whose structure was determined by extensive use of LC-MS/MS and high field Nuclear Magnetic Resonance (NMR) methods8 Figure 3.
26
Figure 3: Brutieridin and Melitidin (1, 2, chart)
Brutieridin and melitidin, isolated and identified as HMG conjugates of neohesperidin and naringin, are present in bergamot fruit in concentrations ranges of approximately 300-500 and 150-300 ppm, respectively, as a function of the ripening stage; these compounds may be found either in the juice or in the albedo and flavedo of bergamot. To the best of our knowledge, the identification of similar HMG conjugates in plants has been described only for Roman chamomile (Chamaemelum nobile) 62-65.
Flavanone glycosyl compositions of peels and seeds are quite unlike those of juices. The Citrus peel and seeds are very rich in phenolic compounds, such as phenolic acids and flavonoids. The peels are richer in flavonoids than the seeds66. The seed and peel compositions are not always the same in Citrus fruits. The seeds of bergamot are the most important source of the glycosylated flavanones, naringin and neohesperidin66-67. The 7-O-glycosyl flavanones are the most abundant flavonoids in all Citrus fruits68-69. The neohesperidoside flavanones, naringin, neohesperidin and neoeriocitrin, are mainly present in bergamot, grapefruit and bitter orange juices, while rutinoside flavanones, hesperidin, narirutin and didymin, are present in bergamot, orange, mandarin and lemon juices70. Different tissues of the fruit also produce compounds such as diosmin and poncirin71 . Flavanone chemical structures are specific for every species, which renders them markers of adulteration in commercial juices 72-74
2.1.3 Liquid chromatography/mass spectrometry for separation and structural determination.
A number and variety of methods for the detection and quantification of flavonoid compounds in fruit have already been developed 75-77 . Several analytical procedures allow the simultaneous determination of the various kinds of flavonoid glycosides as flavanone-O-glycosides, flavone-O-glycosides, flavone-C-glucosides and polymethoxyflavones.
Qualitative and quantitative applications of high performance liquid chromatography (HPLC) for flavonoids analysis are nowadays, very common. These compounds can be separated, quantified, and identified in one operation by coupling HPLC to ultraviolet (UV), mass, or nuclear magnetic resonance (NMR) detectors. This excellent chromophore is, of course, UV active and provides the reason why flavonoids are so easy to detect. For the analytical HPLC of a given subclass of flavonoids (flavones, flavonols, isoflavones, anthocyanins, etc.), the stationary phase, solvent, and gradient have to be optimized. A very high proportion of separations are run on octadecylsilyl bonded (ODS, RP-18, or C18) phases. As solvents for application, acetonitrile–water or methanol– water mixtures, with or without small amounts of acid, are very common. These are compatible