QUADERNI DEL DIPARTIMENTO DI ECONOMIA POLITICA E STATISTICA
Ali Asadi, Gianni Betti
Francesca Gagliardi, Hossein Khoshbakht
Multidimensional and fuzzy poverty at regional level in Iran
1
Multidimensional and fuzzy poverty at regional level in Iran
Ali Asadia, Gianni Bettib, Francesca Gagliardib, Hossein Khoshbakhta,ba Faculty of Agriculture Economics & Development, University of Tehran, Iran b Department of Economics and Statistics, University of Siena, Italy
Abstract
In the present paper we propose a multidimensional and fuzzy set approach for measuring poverty at province level in Iran. We go beyond the conventional study of poverty based simply on the poor/non-poor dichotomy defined in relation to some poverty line chosen on the basis of income or total expenditure only. On the contrary, multidimensional poverty is treated as matters of degree determined in terms of the relative position of individuals in Iran, i.e. in the distribution of some aspects of their living conditions. The state of deprivation is thus seen in the form of ‘fuzzy sets’ to which all members of the population belong but to varying degrees. The methodology is the applied to HBS survey in Iran, collected from March 2016 to March 2017 (1395 Solar Hijri year in Iran).
2
1. Introduction
In the last thirty years many researchers have underlined the necessity to consider deprivation aspects simultaneously in its multiple dimensions. In fact, outstanding authors such as Atkinson and Bourguignon (1982), Kolm (1977), Maasoumi (1986), Sen (1999) and Tsui (1985), have repeatedly stressed the need to adopt a multidimensional approach.
The many attempts to study the poverty phenomenon under a multidimensional perspective appear to fall into two brad categories: non-axiomatic versus axiomatic approaches. A non-axiomatic approach implicitly considers indicators to be perfectly substitutable form an economic point of view. In such approach different indicators or items are combined in order to obtain a multidimensional index; this combination can be done at macro level (Anand and Sen, 1997) or at individual level (Klasen, 2000; Smeeding et al., 1993; Townsend, 1979). By contrast, Chakravarty, Mukherjee and Ranade (1998) and Bourguignon and Chakravarty (2003), have more recently contributed to the development of an axiomatic approach.
In the present work we follow a non-axiomatic approach, and go beyond the conventional study of poverty based simply on the poor/non-poor dichotomy defined in relation to some chosen poverty line. On the contrary, multidimensional poverty is treated as matters of degree determined in terms of the relative position of individuals in Iran, i.e. in the distribution of some aspects of their living conditions. The state of deprivation is thus seen in the form of ‘fuzzy sets’ to which all members of the population belong but to varying degrees. In this way, we are able to clarify and propose a solution for one of the problems raised in the literature (Atkinson et al., 2002; Duclos, Sahn and Younger, 2001; and especially Atkinson, 2003): “…How can different attributes be aggregated?
3
… A distinction may be drowning between those who adopt a union approach and those who use an intersection measure…”.
The paper is composed of four sections; in this introduction we provide a description of economic situation of Iran, which is essential to understand the trend of poverty in the country, measured according to traditional approaches and; then Section 2 describes the wide literature review on fuzzy sets approach to poverty measurement, starting from the seminal paper of Cerioli and Zani (1990), until the very brand new contributions of recent years; moreover, it explains the methodology proposed. Empirical analysis is reported in Section 3, and it is based on the Household Budget Survey (HBS) collected in 1395 Solar Hijri year in Iran, which corresponds to the period from March, 20 2017 to March, 20 2017: a list of 29 indicators have been selected in order to investigate the latent dimensions of non-monetary poverty. Finally, Section 4 concludes the paper.
1.1 Overview of Iranian economy
Islamic republic of Iran as 18th largest country of the world, is the world’s 27th largest economy based on GDP (current prices) and 18th based on GDP (PPP). Ranks 69th in the world in human development index (value of 0.774) based on the 2016 human development report, and is in the high HD category (UNDP, 2016). Iran’s economy is characterized by the over-reliance on hydrocarbon sector and an outstanding government presence in manufacturing and financial sector. Iran gross domestic product (GDP) at factor prices grew by 12.5 percent (Real non-oil GDP, at factor cost 3.3 percent) in 2016 (up from 0.5 percent average in 2013–2015) and was US$425.4 billion and oil sector was the main contributor to the overall growth in 2016 (United Nation, 2017; World Bank, 2017). With increasing oil production, due to the lifting of sanctions and growing oil prices, the surplus swelled from 2.3 percent of GDP in 2015 to 3.9 percent of
4
GDP in 2016. In 2016, total exports increased sharply by 41.3 percent as a result of the rising oil exports following the lifting of sanctions from January 2016. Since five years of double digit inflation, the data from the CBI reveal that Inflation rate was fallen from 11.9 percent in 2015 to 9 percent in 2016 that its lowest rate for a quarter of a century; it is said that the decline in inflation was driven by a stable exchange rate and suitable food prices. Iran's unemployment rate was estimated at 12.5 percent in 2016, according to the International Labour Organization (ILO). While it displays a slightly rising in comparison with the previous year (11 percent). Differences between Male and female unemployment indicate large gender gaps in the labor market (World Bank, 2016). Further the Underemployment was concentrated across the youth and in rural population. The official figure is put at a Gini ratio of 0.38.8 in 2014 that rise in comparison with previous year (UNDP, 2014).
1.2 Trend of poverty in Iran
Over the half past century, Iran implemented diverse development strategies for poverty reduction. The pre-revolutionary period (before 1979), growth oriented development was dominant strategy to poverty reduction. But in the first decades of revolution the equitable development strategies and social justice was considered (Assadzadeh and Paul, 2004; Salehi-Isfahani, 2009; Zonooz, 2005; Nowshirvani and Clawson, 1994). In more recent years, the government has implemented a major reform of its subsidy program on key staples and the indirect subsidies have been replaced by a direct cash transfer program to Iranian households, which has had an impact on household’s standard living (World Bank, 2018). There has been much attention in how extent of poverty in Iran has evolved over the half past century. However, till recently, to the best of our knowledge there does not exist any official information regarding the exact number of poor population and the government has not measured or tracked poverty systematically (Atamanov et al., 2016; Hayati et al., 2010;
Salehi-5
Isfahani, 2009; Assadzadeh and Paul, 2004; Zahedi-Mazandarani, 2005). Thus, it is not possible to make any definitive express on how poverty rate have been changing in these years. Nevertheless, there are a limited empirical evidence of estimates of poverty trends available in case of Iran in the academic literature and international organization documents in English and Persian that they cover periods between 1976 and 2014 (Zahedi-Mazandarani, 2005; Salehi-Isfahani, 2009; Mehran, 1975; Pesaran, 1976; Nowshirvani and Clawson, 1994; Assadzadeh and Paul, 2004; Mahmoudi, 2011; Maasoumi and Mahmoudi, 2013, Atamanov et al., 2016; Zonooz, 2005; World Bank, 2008). Often, such poverty rates are calculated either based on the authors’ own assessment of an appropriate national line, or according to international poverty lines based on US dollars. Because they employ varying methodologies and reaches widely different conclusions, they have failed to present a consistent picture of poverty for Iran (Salehi-Isfahani, 2006; Zonooz, 2005). Anyways, in order to better understand the trend of poverty in Iran, we will investigate the most leading studies over this period.
As a prominent study, Salehi-Isfahani (2009), studied the trends of poverty and inequality for the three decades after the revolution (1979-2005 period), and reveal that the 1979 Revolution and Iraq and Iran war declined the welfare of Iranian people and poverty rate strongly increased (Zonooz, 2005). The results suggest that after the revolution and between 1984 and 1989 years the poverty rate rose sharply from 29 to 42 percent. Following the war and in period of reform and economic reconstruction the poverty rate declined from 42 percent in 1989 to 12 percent in 2005. The evidence shows that proportion of individuals under the international standard of $2 per day ($2.90 in 2005) has dropped in these years, and is about one-fourth of its level before the Revolution and is actually low by the standards of the World Bank for developing countries. There is suggestive evidence that growth and pro-poor social policies like subsidies for
6
food, energy, and medicine, and investment in electricity, water, and health and family planning services have helped in poverty reduction in Iran (Salehi-Isfahani, 2009). According to Assadzadeh and Paul (2004), the poverty rate from 1983 to 1993 in rural area declined, in contrast the poverty rate in urban area had increased sharply. This study reveal that the extent of poverty from 1983 to 1988 increased from about 47 to 55 percent in rural sector and from 24 to 51 in urban sector, whereas from 1988 to 1993 a reverse change in the direction of poverty rate occurred and the poverty rate had fallen from 55 to 46 in rural and from 51 to 33 percent in urban areas.
The World Bank (2008), using the international poverty line ($2.9 in 2005 PPPs) and in local currency units, examined the poverty rate in Iran for 1998-2005 period; the results represent that poverty fell both in rural and urban regions and in most provinces, Regardless of the choice of each poverty line. According to Maasoumi and Mahmoudi (2013), that examine robust growth-equity decomposition of change in poverty in Iran, for 2000, 2004 and 2009 (covering the country’s third and fourth five-year development plans), suggest that poverty unambiguously decreased during the third development plan (1999–2004), but then rose during the fourth development plan (2004–2009) both in rural and urban areas. Where the growth component is the largest part of the change in Poverty it indicates that growth has played a more important role than redistribution in achieving the change in poverty and vice versa (Maasoumi and Mahmoudi, 2013). This is in line with findings in Maasoumi and Mahmoudi (2010) who reported a falling in poverty from 2004 to 2007 and Mahmoudi (2011) who also reported an increase in poverty between 2004 and 2007. The World Bank (2017) estimated that Poverty had been fallen from 13 percent in 2009 to 8 percent in 2013 (US$5.5 per day in 2011 PPP). And suggest that the declining was probably due to the offer of the direct cash transfer program in 2010, and. Also Poverty increased in 2014 to 10.5 percent though and this may be related
7
via declining social assistance in real terms. According to most recent work by Atamanov et al. (2016) who measured the trends of poverty in Islamic republic of Iran from 2008 to 2014 period, using international poverty line based on USD at 2011 purchasing power parity (PPP). They reviled that poverty in period between 2008 and 2009 increased, between 2009 and 2012 poverty was decreased and after 2012 to 2014 the poverty rate gradually increased; and exhibited that income poverty rates are higher and more volatile than the ones based on expenditure per capita (Atamanov et al., 2016). The empirical evidence since Islamic revolution indicate that in some period the poverty rate was increased, however, generally most of them are somewhat in agreement that in the last three decades, Iran has experienced a rising standard of living of its lower class population and the poverty rates declined steadily during this period, in contrast, inequality has been stable and there is not the empirical evidence which would appear to controvert these evidence (Isfahani, 2009; Salehi-Isfahani and Majbouri, 2013).
Most of the above presented papers have lacked in analyzing the regional dimension of poverty; for this reason, we believe that the multidimensional and fuzzy approach proposed in the paper, with the specific focus on the 31 provinces in Iran, could constitute an innovative and original contribution in the literature of poverty analysis in the country.
2. Fuzzy and multidimensional approach to poverty measurement In this section we describe the basic fuzzy methodology for constructing monetary and non-monetary measures of deprivation. Fuzzy set approach (Zadeh, 1965) treats poverty as a matter of degree, replacing the classical {0, 1} dichotomy, non-poor/poor into which statistical units (individuals or households) are traditionally divided. In the fuzzy conceptualization, all individuals are subject to poverty but at different degrees, so that each individual has a certain propensity to poverty in the continuum whole range [0, 1]. There are several
8
advantages of treating poverty as a matter of degree, applicable to all members of the population, rather than as simply ‘yes-no’ state. These are summarized by Verma et al. (2017) as follows:
1. Non-monetary poverty depends on forced non-access to various facilities or possessions determining the basic conditions of life. An individual may have access to some of those but not to others. Hence, clearly, non-monetary poverty is inherently a matter of degree, and some quantitative approach (such as the present one) is essential.
2. The fuzzy approach provides more robust and stable indicators of poverty (Betti et al., 2018). Apart from the various methodological choices involved in the construction of conventional poverty measures, the introduction of fuzzy measures carries in additional factors on which choices have to be made. The fundamental factor concerns the choice of “membership functions”, meaning a quantitative specification of the propensity to poverty of each statistical unit (household/person), given the level and distribution of income of the population.
2.1 Fuzzy membership function
Betti et al. (2008) have proposed two fuzzy membership functions (m.f., one for monetary and the other for non-monetary deprivation), based on the basic contributions of Cerioli and Zani (1990), Cheli and Lemmi (1995); these m.f. have been further elaborated in Betti et al. (2016) for some particular aspects of Quality of Life. In the generalized form, such membership functions are defined for any statistical unit (household/individual) i as follows:
𝑖: 1, … , 𝑛 − 1 ; 𝜇𝑛,𝑘 = 0 (1)
n n i i n n i i K i X X X w X X X w X X w X X w K 2 1 1 1 2 1 1 , | | | | 9
where X is the equivalised income in the monetary poverty, or the overall score s in the non-monetary poverty (see section 2.2 below); is the sample weight of unit of rank in the ascending distribution, and (K = 1, 2) are two parameters corresponding, respectively, to monetary and non-monetary dimensions of poverty. Betti et al. (2008) have proven that this a variant of the - Generalized Gini index. The two parameters are computed so that the mean of the corresponding membership function is equal to the
At-Risk-of-Poverty-Rate (ARPR, Eurostat, 2002) computed on the basis the official poverty
line. Betti et al. (2008) have termed the monetary-based indicator as Fuzzy Monetary (FM), and the non-monetary indicator as Fuzzy Supplementary (FS).
2.2 Construction of the FS measure
The construction of the Fuzzy Supplementary index follows a step-by-step. First of all, the items to be included in the index or indices are identified, which should be the more meaningful and useful ones (see Eurostat, 2002). In fact, it is desirable to avoid items where issues of choice in terms of possession versus non-possession cannot be satisfactory resolved, where the possession is relatively rare (i.e. possession of a boat), or where the degree of comparability among regions or countries is not sufficient. Then, for each item, we determine a quantitative deprivation indicator in the range [0,1]: when the item is constituted by a fixed number of categories, then it is transformed using the following procedure. For each item we determine a deprivation score as follows:
(2) where is the value of the category of the j-th item for the i-th individual and
is the value of the j-th item cumulation function for the i-th individual. We transform the deprivation score to a positive score as follows:
w
K K K n i k j F c F dji ji ; 1,2,..., ; 1,2,..., ) 1 ( 1 ) ( 1 , , i jc
,)
(
c
j,iF
10
(3) In the special, but also common case, where the variable is a dichotomy, the deprivation index d is 1 for deprivation and 0 otherwise, while the positive score
s is 0 for deprivation and 1 otherwise. Such indicators are used in a first
exploratory factor analysis in order to identify underlined “dimensions”. By dimension we intend a distinct group of items of non-monetary poverty, ideally independent from other dimensions, and which should describe a particular facet of living conditions. After this first exploratory factor analysis we proceed to rearrange some items in the dimensions identified in order to create more meaningful groups: to test the goodness of fit of such final grouping, a confirmatory factor analysis is necessary. Then, the weights to be assigned to each item are determined within each dimension; they are based on two elements, namely the dispersion of the item (prevalence weights) and the correlation with other items in the same dimension (correlation weights): for a detailed description of the weight construction, see Betti et al. (2008).
The score within each dimension h, si,h, is calculated as a weighted mean of
items in such dimension, the overall score si is defined as the simple average of
the dimension scores si,h , thus giving the same importance to all the dimensions,
each of which represents a different facet of non-monetary (supplementary) poverty. Finally, as explained above, the membership function FS is defined in formula (1), which could be rewritten for every dimension h as:
n i k j F F c F F c F sji ji ji ; 1,2,..., ; 1,2,..., ) 1 ( 1 ) 1 ( ) ( ) 1 ( 1 ) ( 1 1 , , ,
0 ; ..., , 2 , 1 ; ..., , 2 , 1 , | | | | 1 1 2 1 1 1 2 1 1 ), ( 1 ), (
hn n h h h h n i hi h h h n h h h n i hi h h hi S hi S hi i n i m h s s s w s s s w s s w s s w L F FS 11 3. Empirical analysis
The presented methodology has been applied to HBS survey in Iran, collected from 20 March 2016 to 20 March 2017 (1395 Solar Hijri year in Iran). The target population of the survey are all of household in rural and urban region on Iran. According to Central Bank of the Islamic Republic of Iran (2017), the selection of sample household was based on a three stage-sampling scheme; the total amount of consumption expenditure had an increase of about 11.4% compared to the previous year 1394, while the amount spent on food reached 22.9% of total expenditure. Apart from total consumption expenditure, a list of 29 indicators have been selected in order to investigate the latent dimensions of non-monetary poverty. Applying the methodology described in Section 2.2 above, the exploratory factor analysis identified 7 dimensions, listed in Table 2. A confirmatory factor analysis has then been conducted to test the goodness of the 7-dimension model hypothesized. The results of the analysis, reported in Table 1, are very good; in fact, all the indicators of goodness of the model are significant.
Table 1. Confirmatory factor analysis results
Goodness of fit (GFI)a 0.9288
Adjusted GFIb 0.9132
Parsimonious GFIc 0.8167
RMSEAd 0.0523
a It is based on the ratio of the sum of squared discrepancies to the observed variances; it ranges from 0 to 1 with higher values indicating a good fit
b It is the GFI adjusted for degrees of freedom of the model, that is, the number of the fixed parameters. It can be interpreted in the same manner
c. It adjusts GFI for the number of estimated parameters in the model and the number of data points
d. The Root Mean Squared Error of Approximation (RMSEA) is based on the analysis of residuals, with small values indicating a good fit
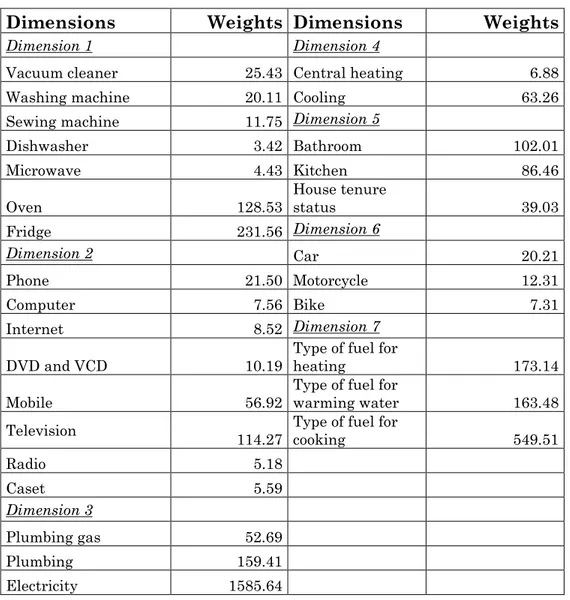
12 Table 2. Dimensions and weights
Dimensions Weights Dimensions Weights
Dimension 1 Dimension 4
Vacuum cleaner 25.43 Central heating 6.88 Washing machine 20.11 Cooling 63.26
Sewing machine 11.75 Dimension 5
Dishwasher 3.42 Bathroom 102.01
Microwave 4.43 Kitchen 86.46
Oven 128.53 House tenure status 39.03
Fridge 231.56 Dimension 6
Dimension 2 Car 20.21
Phone 21.50 Motorcycle 12.31
Computer 7.56 Bike 7.31
Internet 8.52 Dimension 7
DVD and VCD 10.19 Type of fuel for heating 173.14 Mobile 56.92 Type of fuel for warming water 163.48 Television 114.27 Type of fuel for cooking 549.51
Radio 5.18 Caset 5.59 Dimension 3 Plumbing gas 52.69 Plumbing 159.41 Electricity 1585.64
Columns two and four of Table 2 report the results from our data for the weight of each deprivation variable in the considered dimension.
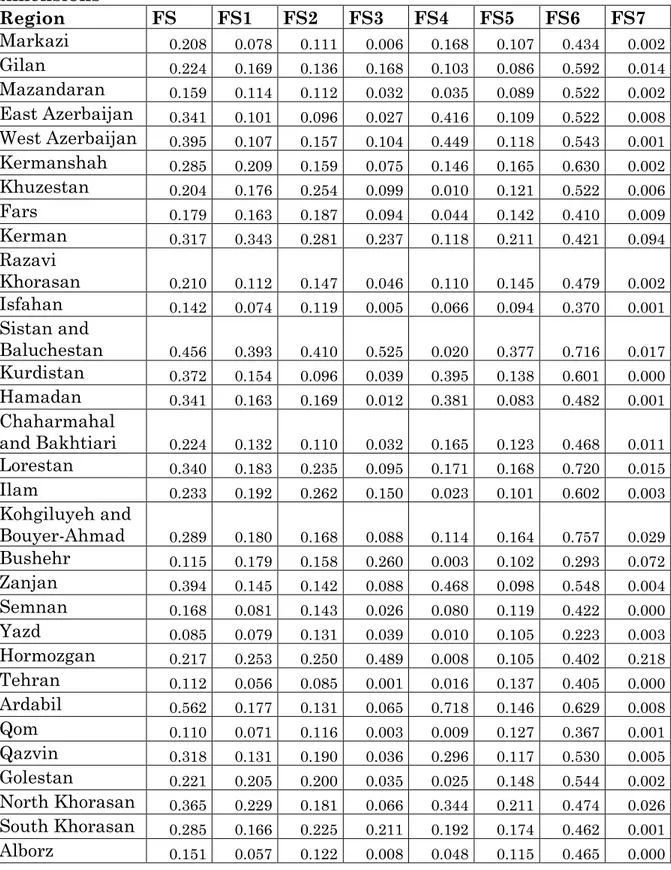
Table 3 reports the results of the overall and decomposed in all dimensions FS for all the 31 Iranian provinces. The overall FS ranges from 0.085 in Yazd to 0.562 in Ardabil. An overall picture of the situation is provided by Figure 1: darker areas, which correspond to most deprived regions, are more concentrated in the North-West and in the South of the Country. In general, Central Iran and the Capital Tehran are the better off (and most populated) areas.
13
Table 3. Results of the fuzzy supplementary (FS) poverty in all its dimensions Region FS FS1 FS2 FS3 FS4 FS5 FS6 FS7 Markazi 0.208 0.078 0.111 0.006 0.168 0.107 0.434 0.002 Gilan 0.224 0.169 0.136 0.168 0.103 0.086 0.592 0.014 Mazandaran 0.159 0.114 0.112 0.032 0.035 0.089 0.522 0.002 East Azerbaijan 0.341 0.101 0.096 0.027 0.416 0.109 0.522 0.008 West Azerbaijan 0.395 0.107 0.157 0.104 0.449 0.118 0.543 0.001 Kermanshah 0.285 0.209 0.159 0.075 0.146 0.165 0.630 0.002 Khuzestan 0.204 0.176 0.254 0.099 0.010 0.121 0.522 0.006 Fars 0.179 0.163 0.187 0.094 0.044 0.142 0.410 0.009 Kerman 0.317 0.343 0.281 0.237 0.118 0.211 0.421 0.094 Razavi Khorasan 0.210 0.112 0.147 0.046 0.110 0.145 0.479 0.002 Isfahan 0.142 0.074 0.119 0.005 0.066 0.094 0.370 0.001 Sistan and Baluchestan 0.456 0.393 0.410 0.525 0.020 0.377 0.716 0.017 Kurdistan 0.372 0.154 0.096 0.039 0.395 0.138 0.601 0.000 Hamadan 0.341 0.163 0.169 0.012 0.381 0.083 0.482 0.001 Chaharmahal and Bakhtiari 0.224 0.132 0.110 0.032 0.165 0.123 0.468 0.011 Lorestan 0.340 0.183 0.235 0.095 0.171 0.168 0.720 0.015 Ilam 0.233 0.192 0.262 0.150 0.023 0.101 0.602 0.003 Kohgiluyeh and Bouyer-Ahmad 0.289 0.180 0.168 0.088 0.114 0.164 0.757 0.029 Bushehr 0.115 0.179 0.158 0.260 0.003 0.102 0.293 0.072 Zanjan 0.394 0.145 0.142 0.088 0.468 0.098 0.548 0.004 Semnan 0.168 0.081 0.143 0.026 0.080 0.119 0.422 0.000 Yazd 0.085 0.079 0.131 0.039 0.010 0.105 0.223 0.003 Hormozgan 0.217 0.253 0.250 0.489 0.008 0.105 0.402 0.218 Tehran 0.112 0.056 0.085 0.001 0.016 0.137 0.405 0.000 Ardabil 0.562 0.177 0.131 0.065 0.718 0.146 0.629 0.008 Qom 0.110 0.071 0.116 0.003 0.009 0.127 0.367 0.001 Qazvin 0.318 0.131 0.190 0.036 0.296 0.117 0.530 0.005 Golestan 0.221 0.205 0.200 0.035 0.025 0.148 0.544 0.002 North Khorasan 0.365 0.229 0.181 0.066 0.344 0.211 0.474 0.026 South Khorasan 0.285 0.166 0.225 0.211 0.192 0.174 0.462 0.001 Alborz 0.151 0.057 0.122 0.008 0.048 0.115 0.465 0.000
14
Figure 1. Map of Iran according to overall Fuzzy Supplementary deprivation
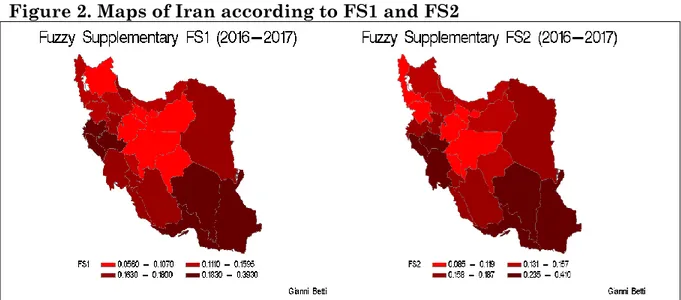
If we look at the single dimensions the situation is more heterogeneous. Sistan and Baluchestan is generally the most deprived province in all dimensions while the Capital Tehran is the best performing. Taking into account dimension FS1, which contains very basic consumer durables, regions Kerman and again Sistan and Baluchestan result to be the most deprived provinces; however, the situation is much more heterogeneous in the North-West (see Figure 2, left), since provinces in that area show deprivation scores both low and high. n dimension FS2, referring to less frequent durables, again Sistan and Baluchestan is the most deprived province. Central Iran and Tehran are still the better off areas, although the more “reddish” provinces are less concentrated here, compared to FS overall or FS1 (see Figure 2, right).
15
Figure 2. Maps of Iran according to FS1 and FS2
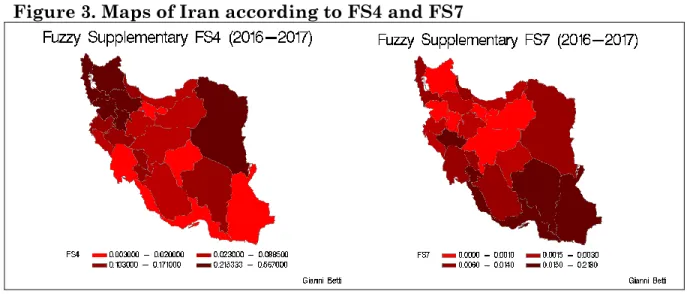
According to dimension FS3, which refers to electricity, plumbing and gas in the house, again Sistan and Baluchestan is the most deprived together with Hormozgan. Dimension FS4 represents the presence of central heating or cooling in the house: here the situation is quite different, since the Southern and Western provinces (excluding Fars) are the better off ones (see Figure 3, left). Dimension FS5 takes into account house tenure and characteristics (the tenure status and presence of kitchen and bathroom); here again Sistan and Baluchestan is the most deprived while Gilan and Mazandaran are the less deprived.
Dimension FS6 identify the possession of car, motorcycle or bike; here the level of deprivation is generally very high in all regions, with the exceptions of Yazd and Bushehr provinces.
Finally, dimension FS7 identifies the type of fuel used in the house for different purposes. Generally, in this dimension the level of deprivation is very low, and even most of Northwestern provinces are performing quite well (see Figure 3, right).
16
Figure 3. Maps of Iran according to FS4 and FS7
4. Concluding remarks
In the present work we have proposed a multidimensional and fuzzy set approach for measuring poverty at province level in Iran. We discovered a quite heterogeneous picture of the country, where the most deprived regions are more concentrated in the North-West and in the South of the Country, and where Central Iran and the Capital Tehran are the better off (and most populated) areas. However, a more detailed analysis focused on the seven fuzzy dimensions FS1-FS7, permit us to discover some unknown results; this because multidimensional poverty is treated as matters of degree determined in terms of the relative position of individuals in Iran, i.e. in the distribution of some aspects of their living conditions. Such results could be summarized as follows:
i) North-Western provinces, including Iranian Azerbaijan and Kurdistan, are quite heterogeneous in regards to fuzzy Dimensions FS1 and FS2, while are all performing quite well in Dimension FS7
ii) Southern provinces, which are the worst off according to the overall FS measure, and many dimensions, are surprisingly the better off for dimension FS7.
17 References
Anand S. and Sen A.K. (1997), Concepts of human development and poverty: a
multidimensional perspective. Human Development Papers, United
Nations Development Programme (UNDP), New York.
Assadzadeh A. and Paul S. (2004), Poverty, growth, and redistribution: a study of Iran, Review of Development Economics, 8(4), pp. 640-653.
Atamanov A., Mostafavi M.H., Salehi-Isfahani D. and Vishwanath T. (2016),
Constructing Robust Poverty Trends in the Islamic Republic of Iran: 2008– 14. The World Bank.
Atkinson A.B. (2003), Multidimensional deprivation: contrasting social welfare and counting approaches, Journal of Economic Inequality, 1, pp. 51-65. Atkinson A.B. and Bourguignon F. (1982), The comparison of multidimensional
distributions of economic status, Review of Economic Studies, 49, pp. 183-201.
Atkinson A.B., Cantillon B., Marlier E. and Nolan B. (2002), Social Indicators:
The EU and Social Inclusion, Oxford University Press, Oxford.
Betti G., Cheli B., Lemmi A. and Verma V. (2008), The Fuzzy Approach to Multidimensional Poverty: the Case of Italy in the 1990s, in Kakwani N. and Silber J. (eds.), Quantitative Approaches to Multidimensional Poverty
Measurement, Palgrave Macmillan, pp. 30-48.
Betti G., Gagliardi F. and Verma V. (2018), Simplified Jackknife Variance Estimates for Fuzzy Measures of Multidimensional Poverty, International
18
Betti G., Soldi R.and Talev I. (2016), Fuzzy Multidimensional Indicators of Quality of Life: The Empirical Case of Macedonia, Social Indicators
Research, 127(1), pp. 39-53.
Bourguignon F. and Chakravarty S.R. (2003), The measurement of multidimensional poverty, Journal of Economic Inequality, 1, pp. 25-49. Central Bank of the Islamic Republic of Iran (2017), Household Budget Survey
in Iran, 1395 (March 20, 2016 – March 20, 2017), General Directorate of
Economic Statistics, September 2017.
Cerioli A. and Zani S. (1990), A fuzzy approach to the measurement of poverty. In: Dagum C. and Zenga M. (eds.), Income and wealth distribution,
inequality and poverty, Springer Verlag, Berlin, pp. 272-284.
Chakravarty S.R., Mukherjee D. and Ranade R. (1998), On the family of subgroup and factor decomposable measures of multidimensional poverty,
Research on Economic Inequality, 8, pp. 175-194.
Cheli B. and Lemmi A. (1995), A Totally Fuzzy and Relative Approach to the Multidimensional Analysis of Poverty, Economic Notes, 24, pp. 115-134. Duclos J.-Y., Sahn D. and Younger S.D. (2001), Robust multidimensional poverty
comparisons, Université Laval, Canada.
Hayati D., Yazdanpanah M. and Karbalaee F. (2010), Coping with drought: The case of poor farmers of south Iran. Psychology and Developing Societies,
22(2), pp. 361-383.
Kolm S.C. (1977), Multidimensional egalitarism, Quarterly Journal of
Economics, 91, pp. 1-13.
Maasoumi E. (1986), The measurement and decomposition of multidimensional inequality, Econometrica, 54, pp. 771-779.
19
Maasoumi E. and Mahmoudi V. (2013), Robust growth-equity decomposition of change in poverty: The case of Iran (2000–2009). The Quarterly Review of
Economics and Finance, 53(3), pp. 268-276.
Maasoumi E. and Vahid M. (2010), Decomposition of Change of Poverty in Growth and Redistribution Components. Mimeo University of Illinois,
Available from: URL (Accessed date: 13 October 2018):
http://iraneconomy.csames.illinois.edu/full%20papers/Maasoumi%20-%20Decomposition%20of%20a%20Change%20in%20Poverty%20in%20Ter ms%20of%20Growth%20and%20Redistribution%20Factors%20in%20Iran. pdf .
Mehran, F. (1975), Income distribution in Iran: The statistics of inequality. International Labour Office.
Nowshirvani V.F. and Clawson P. (1994), The State and Social Equity in Post-revolutionary Iran. The politics of social transformation in Afghanistan,
Iran, and Pakistan, 228.
Pesaran M.H. (1975), Income Distribution and Its Major Determinants in Iran, CBI.
Salehi-Isfahani D. (2006), Revolution and redistribution in Iran: poverty and inequality 25 years later. In: Third Annual World Bank Conference on
Inequality, Washington DC. Available from: URL (Accessed Date: 20 October 2018): https://econpapers.repec.org/paper/vpiwpaper/e06-3.htm
Salehi-Isfahani D. (2009), Poverty, inequality, and populist politics in Iran. The
Journal of Economic Inequality, 7(1), 5-28.
Salehi-Isfahani D. and Majbouri M. (2013), Mobility and the dynamics of poverty in Iran: Evidence from the 1992–1995 panel survey. The quarterly review
20
Sen A.K. (1999), Development as freedom, Oxford University Press, Oxford. Tsui K. (1985), Multidimensional generalisation of the relative and absolute
inequality indices: the Atkinson-Kolm-Sen approach, Journal of Economic
Theory, 67, pp. 251-265.
UNDP (2016), Human Development Report. United Nations Development Program.
United Nations (2017), GDP and its breakdown at current prices in US Dollars. United Nations Statistics Division. December 2017.
Verma V., Lemmi A., Betti G., Gagliardi F. and Piacentini M. (2017), How precise are poverty measures estimated at the regional level? Regional Science and
Urban Economics, 66, pp. 175-184.
World Bank (2008), Islamic Republic of Iran. Spatial Patterns of Poverty and
Economic Activity. Washington, DC: World Bank.
World Bank (2017), Iran Economic Monitor. World Bank.
Zahedi-Mazandarani M.J. (2005), Rural poverty in Iran: trend and measurement, The Quarterly of Social Welfare, 17(4), pp. 289-326.
Zonooz B.H. (2005), Poverty and inequality of income in Iran, The Quarterly of