Two Single-Nucleotide Polymorphisms in the 5
⬘ and 3⬘ Ends of
the Osteopontin Gene Contribute to Susceptibility to
Systemic Lupus Erythematosus
S. D’Alfonso,
1N. Barizzone,
1M. Giordano,
1A. Chiocchetti,
1C. Magnani,
1L. Castelli,
1M. Indelicato,
2F. Giacopelli,
3M. Marchini,
4R. Scorza,
4M. G. Danieli,
5M. Cappelli,
5S. Migliaresi,
6B. Bigliardo,
6M. G. Sabbadini,
7E. Baldissera,
7M. Galeazzi,
8G. D. Sebastiani,
9G. Minisola,
9R. Ravazzolo,
10U. Dianzani,
1and P. Momigliano-Richiardi
1 Objective. To test the association of osteopontin(OPN) polymorphisms with systemic lupus erythemato-sus (SLE).
Methods. The coding 5ⴕ and 3ⴕ flanking regions of
the OPN gene were scanned for polymorphisms by denaturing high-performance liquid chromatography. A case–control association study was performed in 394 Italian SLE patients and 479 matched controls. OPN serum levels were determined by enzyme-linked immu-nosorbent assay in 40 patients and 124 controls, and the mean levels were compared between the different OPN genotypes.
Results. Among the 13 detected single-nucleotide
polymorphisms (SNPs), allelesⴚ156G (frequency 0.714 versus 0.651; P ⴝ 0.006, corrected P [Pcorr] ⴝ 0.036)
and ⴙ1239C (0.377 versus 0.297; P ⴝ 0.00094, Pcorr ⴝ 0.0056) were significantly increased in the SLE patients compared with the controls. The presence of the asso-ciated allele in single or double dose conferred an odds ratio (OR) of 2.35 (95% confidence interval [95% CI] 1.38–4.02) for SNP ⴚ156 and an OR of 1.57 (95% CI 1.16–2.13) for SNPⴙ1239. These effects were indepen-dent of each other, i.e., not a consequence of linkage disequilibrium between the 2 alleles. The risk associated with a double dose of susceptibility alleles at both SNPs was 3.8-fold higher (95% CI 2.0–7.4) relative to the complete absence of susceptibility alleles. With regard to individual clinical and immunologic features, a sig-nificant association was seen between lymphadenopathy andⴚ156 genotypes (overall P ⴝ 0.0011, Pcorrⴝ 0.046). A significantly increased OPN serum level was detected in healthy individuals carrying ⴙ1239C (P ⴝ 0.002), which is indicative of an association between the SLE susceptibility allele and OPN levels.
Conclusion. These data suggest the independent
effect of a promoter (ⴚ156) and a 3ⴕ-untranslated region (ⴙ1239) SNP in SLE susceptibility. We can speculate that these sequence variants (or others in perfect linkage disequilibrium) create a predisposition to high production of OPN, and that this in turn may confer susceptibility to SLE.
Systemic lupus erythematosus (SLE) is an auto-immune disease with a multifactorial etiology that is characterized by impaired T cell responses and dysregu-lation of B cell activation, leading to B cell hyperactivity and production of autoantibodies. Several lines of evi-Supported by the Telethon (grants E1221 and E566), Eastern
Piedmont University (fondi ex 60%), the FISM (grants from the Italian Foundation for Multiple Sclerosis), the Italian Ministry of University and Research (grants from the PRIN and FIRB), and the CARIPLO Foundation.
1S. D’Alfonso, PhD, N. Barizzone, BD, M. Giordano, PhD, A.
Chiocchetti, PhD, C. Magnani, MD, L. Castelli, BD, U. Dianzani, MD, P. Momigliano-Richiardi, PhD: Department of Medical Sciences and IRCAD, University of Eastern Piedmont, Novara, Italy;2M.
Indeli-cato, BD: University of Eastern Piedmont, Novara, and University of Catania, Catania, Italy; 3F. Giacopelli, PhD: G. Gaslini Institute,
Genoa, Italy;4M. Marchini, PhD, R. Scorza, MD: IRCCS Ospedale
Maggiore, and Milano University, Milan, Italy;5M. G. Danieli, MD,
M. Cappelli, MD: Universita` Politecnica delle Marche, Ancona, Italy;
6S. Migliaresi, MD, B. Bigliardo, MD: Napoli Second University,
Naples, Italy; 7M. G. Sabbadini, MD, E. Baldissera, MD: “Vita e
Salute” University, and IRCCS San Raffaele Hospital, Milan, Italy;
8M. Galeazzi, MD: Siena University, Siena, Italy;9G. D. Sebastiani,
MD, G. Minisola, MD: San Camillo-Forlanini Hospital, Rome, Italy;
10R. Ravazzolo, MD: G. Gaslini Institute, and Genova University,
Genoa, Italy.
Address correspondence and reprint requests to S. D’Alfonso, PhD, Department of Medical Sciences, Eastern Piedmont University, Via Solaroli 17, 28100 Novara, Italy. E-mail: dalfonso@ med.unipmn.it.
Submitted for publication April 1, 2004; accepted in revised form October 29, 2004.
dence suggest that early T cell activation gene 1, or osteopontin (OPN), may have a role in the pathogenesis of SLE as well as other autoimmune disorders.
OPN is a 60-kd secreted phospho-protein func-tioning as a free cytokine in body fluids or as an immobilized extracellular matrix molecule in mineral-ized tissues (1,2). OPN may influence autoimmune diseases through its immunoregulatory effects, enhanc-ing the proinflammatory Th1 cell response and inhibit-ing the Th2 responses (3,4). Moreover, OPN stimulates T cell proliferation, interferon-␥ production, and CD40 ligand expression, which in turn sustains the prolifera-tion of B cells and producprolifera-tion of antibodies (5). In mice, transgenic overexpression of OPN on a nonautoimmune background produces an autoimmune pattern with ac-cumulation of B1 lymphocytes, hypergammaglobuline-mia, and production of autoantibodies, including anti– double-stranded DNA antibodies (6). In humans, the serum level of OPN is increased in patients with SLE (7), and lupus nephritis is associated with increased OPN expression in renal tissue (8,9). A synonymous sequence variation in exon 7 (Ala236Ala) of the OPN gene was significantly associated with SLE in a sample of 81 American patients with SLE (10).
A pathogenetic role of OPN has been strongly suggested in MRL-lpr/lpr mice (11–14) and in patients affected by the autoimmune lymphoproliferative syn-drome (ALPS) (15); in both mice and patients with ALPS, an autoimmune pattern partially similar to SLE develops, associated with hypergammaglobulinemia, lymphadenopathy and/or splenomegaly, and peripheral expansion of CD4/CD8 double-negative T cells. In both mice and humans, the disease has been attributed to inherited mutations targeting the function of the Fas death receptor involved in switching of the immune response (16,17). Several studies have suggested that high OPN levels contribute to the disease. Observations in mice revealed that 1) CD4/CD8 double-negative T cells constitutively expressed high levels of OPN, and this elevation of OPN coincided with the appearance of immunologic abnormalities (11–13), and 2) onset of polyclonal B cell activation was delayed by crossing MRL-lpr/lpr with opn⫺/⫺ mice (13,14), while observa-tions in humans demonstrated that 3) high OPN levels directly correlated with hypergammaglobulinemia (15), and 4) 2 SNPs in the OPN 3⬘-untranslated region (3⬘-UTR) (⫹1083A/G and ⫹1239A/C) were associated with high production of OPN and increased the risk of ALPS by 8-fold (15). Intriguingly, families of ALPS patients display an increased frequency of several com-mon autoimmune diseases, including SLE, which
sug-gests that they carry an autoimmune-prone genetic background.
The present study sought to test the involvement of OPN in SLE. To this purpose, the coding 5⬘ and 3⬘ flanking regions of the OPN gene were screened for sequence variations in SLE patients. The identified SNPs were tested for an association with SLE in a large panel of Italian patients and controls. The frequencies of the associated SNPs were then compared in patient subsets subdivided according to their clinical and immu-nologic features. Finally, the association of SLE-associated OPN genotypes with OPN serum production was investigated.
PATIENTS AND METHODS
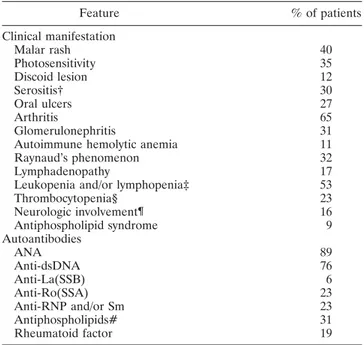
Subjects. A total of 394 Italian patients with SLE (7.5:1 female:male ratio) were included in this study. All patients fulfilledⱖ4 of the American College of Rheumatology 1997 revised criteria for the classification of SLE (18). Enrollment was completed when the patients provided their informed consent. The clinical and immunologic features of the SLE patients are shown in Table 1. A random panel of 479
Table 1. Clinical and immunologic features of the patients with SLE* Feature % of patients Clinical manifestation Malar rash 40 Photosensitivity 35 Discoid lesion 12 Serositis† 30 Oral ulcers 27 Arthritis 65 Glomerulonephritis 31
Autoimmune hemolytic anemia 11
Raynaud’s phenomenon 32
Lymphadenopathy 17
Leukopenia and/or lymphopenia‡ 53
Thrombocytopenia§ 23 Neurologic involvement¶ 16 Antiphospholipid syndrome 9 Autoantibodies ANA 89 Anti-dsDNA 76 Anti-La(SSB) 6 Anti-Ro(SSA) 23 Anti-RNP and/or Sm 23 Antiphospholipids# 31 Rheumatoid factor 19
* SLE⫽ systemic lupus erythematosus; ANA ⫽ antinuclear antibod-ies; anti-dsDNA⫽ anti–double-stranded DNA.
† Includes pericarditis and/or pleuritis.
‡ Leukocyte count⬍4,000/mm3; lymphocyte count⬍1,500/mm3.
§ Platelet count⬍100,000/mm3.
¶ Includes seizures and/or psychosis and/or transient ischemic attack. # Presence of anticardiolipin antibodies and/or lupus anticoagulant activity.
Caucasian individuals from Italy (comprising medical students, university and hospital staff, and blood donors) were used as control subjects (2.6:1 female:male ratio). The regional origin of the patients and controls was similar and included⬃65% of individuals residing in northern Italy and the remaining in central-southern Italy. Individuals with Sardinian ancestors were excluded.
Search for sequence variations in the OPN gene. The OPN gene was amplified from genomic DNA as 12 polymerase chain reaction (PCR) fragments covering a total of 4,401 bp, including the 7 exons, the intron-exons boundaries, 2,083 bp upstream of the transcription start site, and 383 bp in the 3⬘-UTR region. PCR primers were designed on the genomic DNA GenBank sequence D14813 (version GI: 506341). The search for sequence variations was performed by denaturing high-performance liquid chromatography (DHPLC) on an automated HPLC instrument (WAVE; Transgenomic, Santa Clara, CA) as previously reported (19).
The temperature required for successful resolution of heteroduplex molecules was determined using a specific pro-gram (available at the Web site http://insertion.stanford.edu/ melt.html). Samples were analyzed at the predicted tempera-tures (RTm) and at RTm ⫹2°C, as recommended by the software authors (20), and were eluted from the column using a linear acetonitrile gradient at a constant flow rate of 0.9 ml/minute. The gradient was created by mixing elution buffers A (0.1M triethylamine acetate buffer [TEAA], pH 7) and B (25% acetonitrile in 0.1M TEAA, pH 7). The start and end points of the gradient depended on the size of the PCR fragments. Primers used for amplification and DHPLC condi-tions are available from the authors upon request. The PCR products displaying a heteroduplex peak were sequenced and compared with the sequence of a homozygous sample.
Sequencing. Prior to sequencing, unincorporated dNTPs and primers were removed by 0.5 units of shrimp alkaline phosphatase and 5 units of exonuclease I (both from Amersham, Arlington Heights, IL) at 37°C for 30 minutes, after which the enzymes were inactivated by incubation at 80°C for 15 minutes. Samples were sequenced in both directions on an Applied Biosystems 3100 Genetic Analyzer using the Big-Dye terminator cycle-sequencing reaction kit (Applied Biosys-tems, Foster City, CA).
Genotyping of OPN SNPs. In a preliminary screening on a small panel of patients and controls, all of the detected SNPs were genotyped by primer extension followed by HPLC analysis on the WAVE (Transgenomic) instrument (21). The 6 SNPs selected after this analysis were tested on a larger panel by the SNaPshot method on an ABI 3100 Genetic Analyzer (Applied Biosystems). Because of random technical reasons, different numbers of individuals, ranging from 366 to 394 patients and from 420 to 479 controls, were genotyped for each SNP. Two SNaPshot reactions were designed, one for the 4 SNPs in the 5⬘ region (⫺616G/T, ⫺443T/C, ⫺156G/GG, ⫺66T/G) amplified in the same amplicon, and one for the 2 SNPs in the 3⬘ region (⫹1083A/G and ⫹1239A/C), also amplified in one fragment. Samples were electrophoresed on the ABI 3100 Genetic Analyzer. Resulting electropherograms were analyzed using ABI GeneScan, version 3.7 software. SNaPshot conditions are available from the authors upon request.
Enzyme-linked immunosorbent assay (ELISA). Serum OPN concentrations were evaluated by a capture ELISA in accordance with the protocol provided by the manufacturer (Calbiochem, La Jolla, CA). The optical density was measured at 450 nm with a microplate reader (Bio-Rad, Hercules, CA). The I-smart program was used to create a regression curve.
Statistical analysis. The statistical significance of the difference in gene and genotype frequencies between patients and controls was evaluated for each polymorphism using the chi-square test with Yates’ correction. When required by the small number of expected cases, Fisher’s 2-tailed exact test was used. When specified,P values were corrected (Pcorr) for the number of comparisons, according to the Bonferroni method. Maximum-likelihood estimation of haplotype frequen-cies and corresponding standard deviations were calculated from data with unknown gametic phase, using an expectation-maximization (EM) algorithm (Arlequin, version 2.0 [22]). The significance of the difference in single haplotype frequencies between patients and controls was evaluated by analyzing the standard deviation, in which a P value of less than 0.05 corresponds to patient/control haplotype frequencies that do not overlap when considering frequencies of ⫾2 SD. The significance of the overall difference in haplotype frequencies between patients and controls was evaluated by estimating the value as follows: L⫽ (L1 ⫹ L2) ⫺ L3, where L1, L2, and L3 are the ⫺2 log likelihood estimated in the patients (L1), the controls (L2), and patients ⫹ controls (L3). The L value follows a chi-square distribution with degrees of freedom (df) corresponding to the total number of estimated haplotypes⫺1. Pairwise linkage disequilibrium was evaluated by calculating the D⬘ (23) and r2(24) values.
The association of each polymorphism with the disease was measured by the odds ratio (OR) and its 95% confidence interval (95% CI), while the joint effect of different polymor-phisms was tested by multivariate logistic regression (25) using SAS Proc Logistic (SAS Institute, Cary, NC). The departure of the observed ORs from those predicted under additivity of effects (additive-effects model) was measured by computing the RERI index and its 95% CI (26). The departure from a multiplicative model was tested by inclusion of an interaction term in the logistic regression model (27). In addition, data were made to fit a parametric model (reparametrization) by creating a set of dummy variables for the different possible combinations of genotypes (26); this procedure was used for descriptive purposes (as in Table 6), for computing the RERI as suggested by Hosmer and Lemeshow (26), and also for estimating the departure from a multiplicative model when the product term could not fit because of lack of data.
The distribution of OPN serum levels in the study population was right-skewed. A logarithmic transformation of the OPN serum levels was introduced to approximate a normal distribution. Relevant comparisons were performed using Stu-dent’st-test.
RESULTS
Analysis of the OPN gene-sequence variations.
The 7 exons, the exon-intron boundaries, 2,083 bp of the 5⬘ flanking region, and 383 bp of the 3⬘-UTR of the OPN
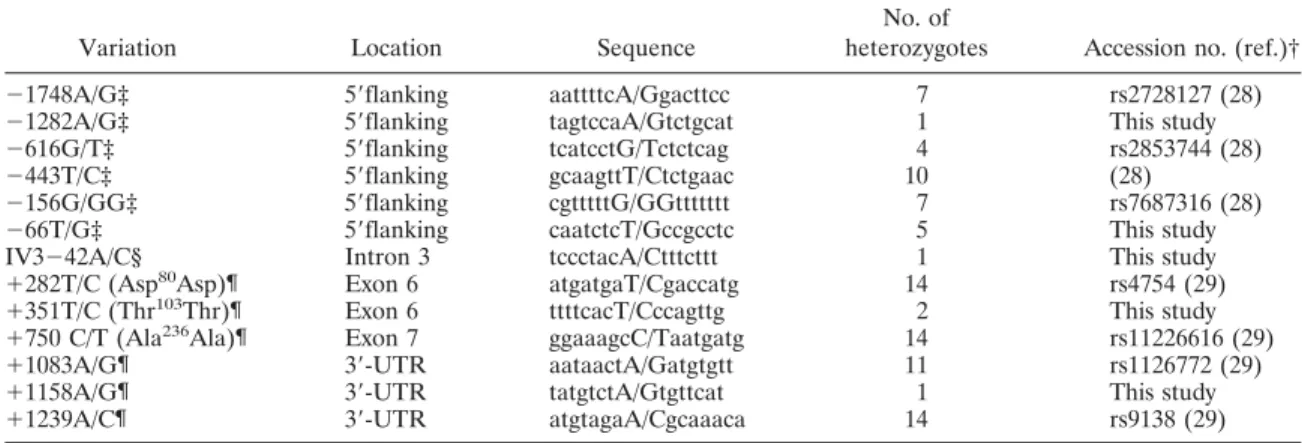
gene were screened for sequence variations by DHPLC in 23 SLE patients. A total of 13 SNPs were identified (6 in the 5⬘ flanking region, 1 in intron 3, 3 synonymous variations in exons 6 and 7, and 3 in the 3⬘-UTR) (Table 2). Five of these SNPs were newly identified, whereas the remaining were previously reported in the literature (28,29) or in SNP databases.
About 70 patients and 100 controls were then genotyped for all of the SNPs reported in Table 2 and, in addition, for a recently published TG/TGTG biallelic polymorphism in the first intron (30). Four SNPs (namely, ⫺1282A/G, IV3⫺42A/C, ⫹351T/C, and ⫹1158A/G) with a minor allele frequency of ⬍3% in
both patients and in controls were not tested further. SNPs at positions ⫹282, ⫹750, and ⫹1239 showed a perfect linkage disequilibrium between each other, and therefore given the redundant genetic information, only 1 of them, namely ⫹1239A/C, was further considered. The same was true for⫺1748A/G, ⫺156G/GG, and the intron 1 polymorphism, and consequently, only ⫺156G/GG was further considered.
Thus, starting from 14 validated SNPs, a set of 6 SNPs was further tested with a larger panel. A significant pairwise linkage disequilibrium was observed among these 6 SNPs, as shown in the healthy controls (Table 3); similar values were also observed in the patients (data
Table 2. Osteopontin single-nucleotide polymorphisms (SNPs) identified in patients with systemic lupus erythematosus*
Variation Location Sequence
No. of
heterozygotes Accession no. (ref.)†
⫺1748A/G‡ 5⬘flanking aattttcA/Ggacttcc 7 rs2728127 (28)
⫺1282A/G‡ 5⬘flanking tagtccaA/Gtctgcat 1 This study
⫺616G/T‡ 5⬘flanking tcatcctG/Tctctcag 4 rs2853744 (28)
⫺443T/C‡ 5⬘flanking gcaagttT/Ctctgaac 10 (28)
⫺156G/GG‡ 5⬘flanking cgtttttG/GGttttttt 7 rs7687316 (28)
⫺66T/G‡ 5⬘flanking caatctcT/Gccgcctc 5 This study
IV3⫺42A/C§ Intron 3 tccctacA/Ctttcttt 1 This study
⫹282T/C (Asp80Asp)¶ Exon 6 atgatgaT/Cgaccatg 14 rs4754 (29)
⫹351T/C (Thr103Thr)¶ Exon 6 ttttcacT/Cccagttg 2 This study
⫹750 C/T (Ala236Ala)¶ Exon 7 ggaaagcC/Taatgatg 14 rs11226616 (29)
⫹1083A/G¶ 3⬘-UTR aataactA/Gatgtgtt 11 rs1126772 (29)
⫹1158A/G¶ 3⬘-UTR tatgtctA/Gtgttcat 1 This study
⫹1239A/C¶ 3⬘-UTR atgtagaA/Cgcaaaca 14 rs9138 (29)
* Sequence variations are shown in upper case. Heterozygotes were detected by denaturing high-performance liquid chromatography in 23 patients.
† Accession number in the National Center for Biotechnology Information SNP data bank (http://www.ncbi.nlm.nih.gov/SNP). Thirteen additional SNPs are reported in the database in the sequences screened in this report (namely, rs3891314, rs2853745, rs2853747, rs2859696, rs2728128, rs2853748, rs2859697, rs4660, rs1126859, rs112688, rs1126893, rs6812524, and rs7435825), but these were not detected in the tested individuals.
‡ Numbering is relative to the transcription start site (⫹1) corresponding to nucleotide 2268 in the GenBank sequence number D14813 (GI: 506341).
§ Numbering is relative to the last (⫺1) nucletotide of intron 3.
¶ Position in the cDNA considering the A nucleotide of the first ATG as⫹1.
Table 3. Pairwise linkage disequilibrium (LD) between osteopontin single-nucleotide polymorphisms in controls*
Allele ⫺616 (G) ⫺443 (C) ⫺156 (G) ⫺66 (T) ⫹1083 (G) ⫹1239 (C) ⫺616 (G) 0.125 0.259 NS† 0.053 0.072 ⫺443 (C) 1.00‡ 0.519 0.317 0.229 0.134 ⫺156 (G) 1.00‡ 1.00‡ 0.660 0.185 0.232 ⫺66 (T) NS† 1.00‡ 1.00‡ 0.104 0.146 ⫹1083 (G) 1.00§ 0.861‡ 0.966‡ 0.929‡ 0.687 ⫹1239 (C) 1.00§ 0.524‡ 0.942‡ 0.942‡ 1.00‡
* Values for r2and D⬘ (Lewontin D values) are reported in the upper-right triangle and lower-left triangle of the table,
respectively. All values refer to the variant allele indicated in parentheses. A minimum of 345 individuals were analyzed for each comparison. All r2valuesⱖ0.5 and D⬘ values ⱖ0.95 are shown in boldface.
† Linkage disequilibrium between⫺66T and ⫺616G was not significant (NS). A significant linkage disequilibrium was detected between⫺66T and the ⫺616T allele (P ⫽ 0.006, D⬘ ⫽ 1, r2⫽ 0.045) (not shown).
‡P ⬍ 0.05. §P ⬍ 0.001.
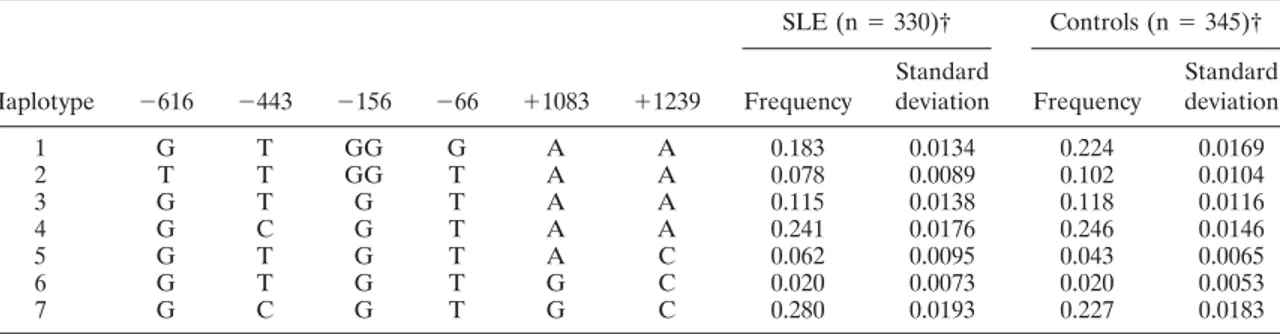
not shown). The frequency of the 7 haplotype combina-tions, accounting for 98% of the total (Table 4), were estimated in both patients and controls by the maximum-likelihood method based on the EM algorithm (22).
Association with SLE susceptibility. The overall
haplotype distribution was significantly different be-tween patients and controls (P ⫽ 0.024, 11 df). However, none of the specific haplotype frequencies was signifi-cantly distorted. The haplotype showing the highest frequency in the patients (haplotype 7 in Table 4) carried alleles that were all individually increased in the patients. The association with SLE was significant for 3 of the alleles, namely, ⫺156G (frequency in SLE pa-tients versus controls 0.714 versus 0.651; P ⫽ 0.0060,
Pcorr⫽ 0.036), ⫹1083G (0.303 versus 0.244; P ⫽ 0.0077, Pcorr ⫽ 0.046), and ⫹1239C (0.377 versus 0.297; P ⫽
0.00094, Pcorr ⫽ 0.0056), withstanding Bonferroni
cor-rection for the number of tested SNPs (n ⫽ 6). For simplicity, alleles significantly increased in the patients (⫺156G, ⫹1083G, and ⫹1239C) were named 1 (i.e., susceptibility alleles), whereas alleles significantly de-creased in the patients (⫺156GG, ⫹1083A, and ⫹1239A) were named 0 (i.e., protective alleles).
The genotype distribution at the 3 positions (Table 5) was significantly different between patients and controls. The presence of the disease-associated allele, in single or in double dose, conferred an OR of 2.35 (95% CI 1.38–4.02) for SNP ⫺156, an OR of 1.56
Table 4. Estimated SNP haplotype combinations in patients with SLE and controls*
Haplotype ⫺616 ⫺443 ⫺156 ⫺66 ⫹1083 ⫹1239 SLE (n⫽ 330)† Controls (n⫽ 345)† Frequency Standard deviation Frequency Standard deviation 1 G T GG G A A 0.183 0.0134 0.224 0.0169 2 T T GG T A A 0.078 0.0089 0.102 0.0104 3 G T G T A A 0.115 0.0138 0.118 0.0116 4 G C G T A A 0.241 0.0176 0.246 0.0146 5 G T G T A C 0.062 0.0095 0.043 0.0065 6 G T G T G C 0.020 0.0073 0.020 0.0053 7 G C G T G C 0.280 0.0193 0.227 0.0183
* The displayed 7 haplotypic combinations account for 98% of the total haplotype frequencies. The remaining 2% were distributed in 5 rare haplotypes in both patients and controls. SLE⫽ systemic lupus erythematosus.
† Number of individuals tested with the complete set of the 6 selected single-nucleotide polymorphisms (SNPs).
Table 5. Genotype distribution in patients with SLE and controls for osteopontin SNPs⫺156, ⫹1083, and⫹1239* SNP site, genotype† SLE, % (n⫽ 330)‡ Controls, % (n⫽ 401)‡ Crude OR (95% CI) Adjusted OR (95% CI)§ ⫺156 00 0.07 0.15 1.00 (referent) 1.00 (referent) 01 0.40 0.40 2.19 (1.29–3.73) 1.95 (1.12–3.38) 11 0.53 0.45 2.58 (1.53–4.35) 2.04 (1.16–3.59) ⫹1083 00 0.49 0.60 1.00 (referent) 1.00 (referent) 01 0.40 0.33 1.46 (1.07–2.00) 1.08 (0.63–1.85) 11 0.11 0.07 1.82 (1.08–3.06) 0.80 (0.27–2.34) ⫹1239 00 0.40 0.51 1.00 (referent) 1.00 (referent) 01 0.45 0.39 1.49 (1.09–2.04) 1.21 (0.70–2.10) 11 0.15 0.10 2.07 (1.29–3.33) 2.03 (0.74–5.56)
* Odds ratios (ORs) and 95% confidence intervals (95% CIs) are relative to the referent genotype. See Table 4 for other definitions.
† Alleles significantly increased in the patients (⫺156G, ⫹1083G, and ⫹1239C) are named 1, while alleles significantly decreased in the patients (⫺156GG, ⫹1083A, and ⫹1239A) are named 0.
‡ The total comprises the number of tested individuals. Only individuals tested for all 3 SNPs are included. Genotypes were distributed according to Hardy-Weinberg equilibrium.
§ Calculated with the use of a multivariate logistic regression analysis adjusted for⫺156, ⫹1083, and ⫹1239 SNPs. Results adjusted for the remaining 2 SNPs are reported for each SNP.
(95% CI 1.15–2.12) for SNP⫹1083, and an OR of 1.57 (95% CI 1.16–2.13) for SNP ⫹1239. For each SNP, a double dose conferred a higher OR than a single dose, but the difference was not statistically significant. A multivariate analysis (Table 5) adjusted for genotypes at positions⫹1239 and ⫺156 indicated that ⫹1083 was not an independent susceptibility factor (adjusted OR ⬃1.00). Conversely, the OR conferred by ⫺156 and ⫹1239 after adjustment for the other 2 polymorphisms remained similar to the crude OR, although the OR for ⫹1239 was no longer statistically significant. This analy-sis suggests that each of these 2 SNPs, one in the 5⬘ flanking region and the other in the 3⬘-UTR, contributes to susceptibility independent of their linkage disequili-brium relationship.
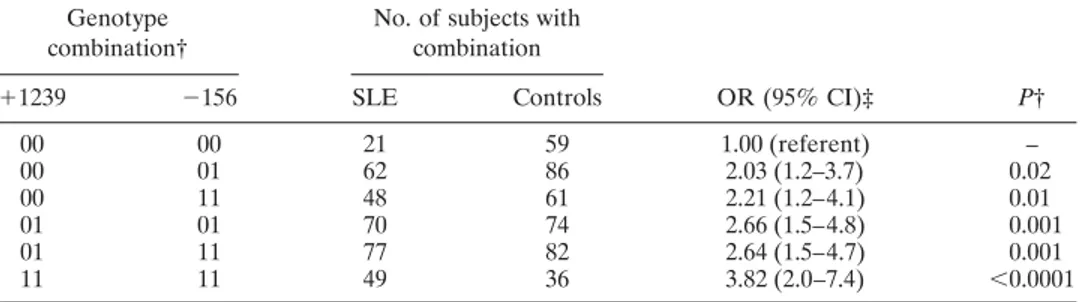
In order to fully describe the effect of the differ-ent combinations of the 5⬘ and the 3⬘ sequence varia-tions, we analyzed the ORs for all of their possible genotype combinations (Table 6). Due to linkage dis-equilibrium, 6 genotype combinations accounted for 99% of the samples. Two rare combinations accounted for the remaining 1%. The overall distribution was significantly different between patients and controls (P ⫽ 0.0069). Relative to the 00 genotype (absence of susceptibility allele) at both SNPs, all of the other genotype combinations conferred a significantly in-creased OR. The highest OR was observed in individuals homozygous for allele 1 at both SNPs (OR 3.82, 95% CI 2.0–7.4). More precisely, the risk conferred by each genotype carrying 1 or 2 susceptibility alleles at position ⫺156 increased with an increasing number of the ⫹1239 susceptibility allele. The complementary analysis was not possible, since⫹1239-1 was present only in haplo-types also carrying⫺156-1 (Table 4).
We tested whether this pattern was better ex-plained by an additive model as compared with a multiplicative model, by comparing the observed ORs with those predicted under additivity of effects (additive-effects model) and with those predicted under a multiplicative model. Departure from additivity was measured by the RERI index and its 95% CI (26). Departure from a multiplicative scale was tested by comparing a model including⫺156 and ⫹1239 suscep-tibility alleles without interaction and a reparametrized model as in Table 6 (see ref. 26 for details on parame-trization). This latter procedure was used since a prod-uct term could not fit because of the absence of some relevant combinations due to linkage disequilibrium. However, these analyses did not detect a departure of the results from those predicted by either an additive or a multiplicative model, so that the best model to de-scribe the combined effect of the 2 genotypes remains uncertain.
Association with disease features. Genotype
fre-quencies of the⫺156 and ⫹1239 SNPs were compared between patients who were positive or negative for each of the clinical and immunologic features shown in Table 1. A statistically significant association, withstanding correction for the number of comparisons (n ⫽ 21 clinical and immunologic features ⫻ 2 SNPs), was detected only for the ⫺156 polymorphism with the presence of lymphadenopathy (overall P ⫽ 0.0011;
Pcorr⫽ 0.046). The frequencies of ⫺156-11, -01, and -00
genotypes were 0.714, 0.238, and 0.048, respectively, in the 63 patients with lymphadenopathy and 0.458, 0.472, and 0.070, respectively, in the 286 patients without lymphadenopathy.
Table 6. Association of SLE susceptibility with different genotype combinations for the 3⬘ (⫹1239) and 5⬘ (⫺156) SNPs*
Genotype combination†
No. of subjects with combination OR (95% CI)‡ P† ⫹1239 ⫺156 SLE Controls 00 00 21 59 1.00 (referent) – 00 01 62 86 2.03 (1.2–3.7) 0.02 00 11 48 61 2.21 (1.2–4.1) 0.01 01 01 70 74 2.66 (1.5–4.8) 0.001 01 11 77 82 2.64 (1.5–4.7) 0.001 11 11 49 36 3.82 (2.0–7.4) ⬍0.0001
* See Tables 4 and 5 for definitions.
† Alleles significantly increased in the patients (⫺156G and ⫹1239C) are named 1, while alleles significantly decreased in the patients (⫺156GG and ⫹1239A) are named 0. Two further rare combinations were detected: genotypes⫹1239-11, ⫺156-01 (1 patient and 2 controls), and ⫹1239-01, ⫺156-00 (2 patients and 2 controls):
Correlation with OPN serum levels. In order to
investigate a possible functional basis for the observed genetic association, we analyzed OPN protein produc-tion. OPN serum levels measured by ELISA were sig-nificantly higher in 40 SLE patients than in 124 controls (mean ⫾ SD of logarithm-transformed values 5.32 ⫾ 0.55 ng/ml versus 4.94⫾ 0.53 ng/ml, corresponding to a geometric mean of 204.8 ng/ml versus 140.1 ng/ml;P ⬍ 0.001). We then analyzed the association of OPN geno-types with OPN protein levels in the serum. In a previous study, we reported that among 50 healthy controls, individuals carrying the⫹1239C allele (i.e., the SLE susceptibility allele) produced significantly more OPN serum protein than did individuals negative for this allele (15). We now extended the analysis to a total of 124 healthy individuals (including the previously re-ported 50) and to the⫺156 polymorphism.
The association of OPN serum levels with⫹1239 was confirmed in the larger panel of healthy subjects. In particular, individuals carrying allele 1 for ⫹1239 (in single or in double dose) displayed higher OPN serum levels than did individuals negative for this allele (mean ⫾ SD of logarithm-transformed values 5.09 ⫾ 0.527 ng/ml versus 4.79⫾ 0.495 ng/ml, corresponding to a geometric mean of 162.4 ng/ml versus 120.3 ng/ml;P ⫽ 0.002). A similar trend was observed in individuals positive for ⫺156-1 (mean ⫾ SD of logarithm-transformed values 4.96 ⫾ 0.536 ng/ml versus 4.86 ⫾ 0.512 ng/ml, corresponding to a geometric mean of 141.9 ng/ml versus 129.4 ng/ml). However, this difference was not statistically significant and completely disappeared when considering only the ⫹1239-1–negative samples (n⫽ 62). Thus, it appears that only the 3⬘ variation has an influence on the OPN serum level in healthy individ-uals. In contrast with the findings in controls, no signif-icant association of OPN serum levels with ⫹1239 or ⫺156 genotypes was detected in the SLE patients (mean ⫾ SD of logarithm-transformed values 5.27 ⫾0.57 ng/ml for the 20 ⫹1239-1–positive patients versus 5.37⫾ 0.55 ng/ml for the 20 ⫹1239-1–negative patients, and 5.29 ⫾ 0.53 ng/ml for the 36 ⫺156-1–positive patients versus 5.56 ⫾ 0.69 for the 4 ⫺156-1–negative patients).
DISCUSSION
The association of OPN gene polymorphisms with SLE susceptibility was tested in a large group of Italian patients and controls. Sequence variations were searched by a systematic screen of the coding regions as well as the 3⬘-UTR and 2,083 bp of the 5⬘ flanking OPN
regions in 23 patients. This search was designed to ensure that potentially causative variants were consid-ered among those tested, given that the SNPs available in the public database and in the literature may not include those specifically relevant to SLE. A total of 13 SNPs were detected, of which 5 are described for the first time herein. Six SNPs (none of which have been previously tested for association with SLE) were selected for further testing in a large panel of Italian patients.
Two sequence variations located in the 5⬘ flank-ing region (⫺156G/GG) and in the 3⬘-UTR (⫹1239A/C) were significantly associated with the disease. SNP at position ⫹1239 was in perfect linkage disequilibrium with the synonymous variation in exon 7 (Ala236Ala), which was associated with SLE in a group of 81 Amer-ican individuals (10). Thus, the previously reported result has been confirmed in a larger and different population.
A multivariate analysis showed that the effect on SLE susceptibility of the 2 SNPs in the 5⬘ and 3⬘ regions was independent of each other, i.e., not a consequence of linkage disequilibrium between them. Moreover, in-dividuals carrying susceptibility alleles for both SNPs had a higher risk of developing SLE than did individuals carrying susceptibility alleles only at position ⫺156 (Table 6): the risk associated with homozygosity for susceptibility alleles at both SNPs was 1.7-fold higher relative to homozygosity only at⫺156, and almost 4-fold higher relative to the complete absence of susceptibility alleles. These data suggest a synergism of the 2 sequence variations for SLE susceptibility, which is consistent with a growing number of other examples reported in the literature (31,32), and indicates that both variations should be tested in any study investigating the role of OPN in disease etiology. The remaining haplotype back-ground does not seem to influence the effect of these 2 SNPs.
The perfect linkage disequilibrium between al-leles at positions ⫺156, ⫺1748, and intron 1 as well as between ⫹1239, ⫹282, and ⫹750 does not allow us, in the absence of functional data, to determine which, if any, of these sequence variations is primarily involved in SLE susceptibility. The polymorphism in intron 1 does not seem to have a functional relevance, according to recently published observations (30). The SNPs in the 5⬘ flanking region may affect the transcription capability of the OPN promoter by a differential binding of transcrip-tion factors. Recent evidence suggests that positranscrip-tion ⫺156 falls in a putative binding site for a component of the RUNX family of transcription factors (33). Interest-ingly, SNPs in RUNX binding sites in 3 different genes
were recently associated with 3 autoimmune diseases, namely SLE, psoriasis, and rheumatoid arthritis, sug-gesting an important role for this family of DNA binding proteins in autoimmunity (34).
As for the 3 associated SNPs in the 3⬘ part of the OPN gene, 2 of them, namely,⫹282T/C and ⫹750C/T, are synonymous variations located in exons 6 and 7, respectively. Synonymous variations that modify exonic splicing enhancer or exonic splicing silencer sites have been reported to be causative mutations of genetic diseases (35). However, the involvement of OPN exon 6 and exon 7 synonymous SNPs in this mechanism seems unlikely, since the 2 known alternatively spliced isoforms of human OPN involve exons 4 and 5 (36).
The third SNP (⫹1239A/C) is located in the 3⬘-UTR region. This region is strongly implicated in the regulation of gene expression because it specifically controls stability, translational activity, and nuclear ex-port of messenger RNA (mRNA) (37–39). Sequence variations in the 3⬘-UTR may affect some of these functions and can be causative mutations of genetic diseases (38,39). Interestingly, even if this SNP is not part of sequences known to bind regulative factors, it falls in an 18-bp sequence conserved in the human, bovine, ovine, and porcine OPN 3⬘-UTR, suggesting a possible functional role of this region. Preliminary mRNA quantitative analysis performed in 3 individuals heterozygous for⫹1239A/C and homozygous for all of the promoter SNPs showed that mRNA carrying the SLE-associated allele (⫹1239C) was 4.4-fold more ex-pressed than mRNA carrying ⫹1239A. These data suggest a possible influence of this SNP in the control of mRNA stability. Accordingly, the ⫹1239C allele was significantly associated with a higher serum protein level in healthy controls, directly relating OPN levels to this OPN gene variation and to SLE susceptibility. Con-versely, no association with the baseline protein serum level was detected for position ⫺156.
Thus, the mechanism by which this polymor-phism contributes to SLE susceptibility is less clear. We can speculate that it might be relevant in the regulation of OPN production in response to the initial immuno-stimulating trigger. The fact that neither SNP was cor-related with the protein level in SLE patients could be explained by an overwhelming effect of the immune activation in the patients following the initial trigger.
Intriguingly, the ⫺156 susceptibility allele (⫺156G) was also associated, albeit with borderline significance (Pcorr⫽ 0.046), with development of
lymph-adenopathy in SLE patients. This pattern recalls the characterization of ALPS as involving autoimmunities
partly similar to SLE and lymphadenopathy, and as displaying high OPN levels and association with the ⫹1239C allele (the ⫺156 SNP was not evaluated in ALPS patients [15]). Since OPN favors proliferation and inhibits death of lymphocytes in vitro (15), it was sug-gested that OPN acts in synergy with the inherited Fas defect, which is considered the main cause of ALPS. This synergy may favor lymphocyte accumulation in the secondary lymphoid tissues and development of autoim-munity. A similar synergy might also work in SLE patients, who do not carry inherited defects of Fas function, but rather, overproduce a soluble form of Fas that may inhibit Fas function (40). Alternatively, OPN might act in synergy with other apoptosis defects not identified to date in SLE.
In summary, these data strongly suggest that OPN genetic variations have a key role in building up an autoimmune-prone background favoring lymphocyte ac-cumulation in peripheral lymphoid tissues and leading to the development of autoimmunity. For at least one of these genetic variations, an association with increased OPN levels was demonstrated. OPN may exert its pref-erential effect through its capacity to stimulate prolifer-ation and inhibit death of lymphocytes (15,41) or through its capacity to modulate the immune response by inducing Th1 responses and potentiating polyclonal activation of B cells (3–5).
ACKNOWLEDGMENT
We are grateful to Dr. Roberto Tosi for critically reading the manuscript.
REFERENCES
1. O’Regan A, Berman JS. Osteopontin: a key cytokine in cell-mediated and granulomatous inflammation. Int J Exp Pathol 2000;81:373–90.
2. Denhardt DT, Noda M, O’Regan AW, Pavlin D, Berman JS. Osteopontin as a means to cope with environmental insults: regulation of inflammation, tissue remodeling, and cell survival. J Clin Invest 2001;107:1055–61.
3. O’Regan AW, Nau GJ, Chupp GL, Berman JS. Osteopontin (Eta-1) in cell-mediated immunity: teaching an old dog new tricks. Immunol Today 2000;21:475–8.
4. Ashkar S, Weber GF, Panoutsakopoulou V, Sanchirico ME, Jansson M, Zawaideh S, et al. Eta-1 (osteopontin): an early component of type-1 (cell-mediated) immunity. Science 2000;287: 860–4.
5. O’Regan AW, Hayden JM, Berman JS. Osteopontin augments CD3-mediated interferon-␥ and CD40 ligand expression by T cells, which results in IL-12 production from peripheral blood mononuclear cells. J Leukoc Biol 2000;68:495–502.
6. Iizuka J, Katagiri Y, Tada N, Murakami M, Ikeda T, Sato M, et al. Introduction of an osteopontin gene confers the increase in B1 cell
population and the production of anti-DNA autoantibodies. Lab Invest 1998;78:1523–33.
7. Katagiri Y, Mori K, Hara T, Tanaka K, Murakami M, Uede T. Functional analysis of the osteopontin molecule. Ann N Y Acad Sci 1995;760:371–4.
8. Okada H, Moriwaki K, Konishi K, Kobayashi T, Sugahara S, Nakamoto H, et al. Tubular osteopontin expression in human glomerulonephritis and renal vasculitis. Am J Kidney Dis 2000;36: 498–506.
9. Masutani K, Akahoshi M, Tsuruya K, Tokumoto M, Ninomiya T, Kohsaka T, et al. Predominance of Th1 immune response in diffuse proliferative lupus nephritis. Arthritis Rheum 2001;44: 2097–106
10. Forton AC, Petri MA, Goldman D, Sullivan KE. An osteopontin (SPP1) polymorphism is associated with systemic lupus erythem-atosus. Hum Mutat 2002;19:459–62.
11. Patarca R, Wei FY, Singh P, Morasso MI, Cantor H. Dysregulated expression of the T cell cytokine Eta-1 in CD4-8-lymphocytes during the development of murine autoimmune disease. J Exp Med 1990;172:1177–83.
12. Lampe MA, Patarca R, Iregui MV, Cantor H. Polyclonal B cell activation by the Eta-1 cytokine and the development of systemic autoimmune disease. J Immunol 1991;147:2902–6.
13. Weber GF, Cantor H. Differential roles of osteopontin/Eta-1 in early and late lpr disease. Clin Exp Immunol 2001;126:578–83. 14. Wuthrich RP, Fan X, Ritthaler T, Sibalic V, Yu DJ, Loffing J, et
al. Enhanced osteopontin expression and macrophage infiltration in MRL-Fas(lpr) mice with lupus nephritis. Autoimmunity 1998; 28:139–50.
15. Chiocchetti A, Indelicato M, Bensi T, Mesturini R, Giordano M, Sametti S, et al. High levels of osteopontin associated with polymorphisms in its gene are a risk factor for development of autoimmunity/lymphoproliferation. Blood 2004;103:1376–82. 16. Fisher GH, Rosenberg FJ, Straus SE, Dale JK, Middleton LA, Lin
AY, et al. Dominant interfering Fas gene mutations impair apoptosis in a human autoimmune lymphoproliferative syndrome. Cell 1995;81:935–46.
17. Nagata S. Apoptosis by death factor. Cell 1997;88:355–65. 18. Hochberg MC. Updating the American College of Rheumatology
revised criteria for the classification of systemic lupus erythema-tosus [letter]. Arthritis Rheum 1997;40:1725.
19. D’Alfonso S, Giordano M, Mellai M, Lanceni M, Barizzone N, Marchini M, et al. Association tests with systemic lupus erythem-atosus of IL10 markers indicate a direct involvement of a CA repeat in the 5⬘ regulatory region. Genes Immun 2002;3:454–63. 20. Jones AC, Austin J, Hansen N, Hoogendoorn B, Oefner PJ, Cheadle JP, et al. Optimal temperature selection for mutation detection by denaturing HPLC and comparison to single-stranded conformation polymorphism and heteroduplex analysis. Clin Chem 1999;45:1133–40.
21. Hoogendoorn B, Owen MJ, Oefner PJ, Williams N, Austin J, O’Donovan MC. Genotyping single nucleotide polymorphisms by primer extension and high performance liquid chromatography. Hum Genet 1999;104:89–93.
22. Schneider S, Kueffer JM, Roessli D, Excoffier L. Arlequin version 1.1: a software for population genetic data analysis. Switzerland: Genetics and Biometry Laboratory, University of Geneva; 1997. 23. Lewontin RC. The interaction of selection and linkage. I. General
consideration: heterotic models. Genetics 1964;49:49–67.
24. Pritchard JK, Przeworski M. Linkage disequilibrium in humans: models and data. Am J Hum Genet 2001;69:1–14.
25. Breslow NE, Day NE. Statistical methods in cancer research. Vol 1. The analysis of case-control studies. Lyon: IARC Scientific Publications; 1980.
26. Hosmer D, Lemeshow S. Confidence interval estimation of inter-action. Epidemiology 1992;3:452–6.
27. Kleinbaum DG, Kupper LL, Morgenstern H. Epidemiologic re-search principles and quantitative methods. New York: Van Nostrand Reinhold; 1982. p. 448–51.
28. Mochida S, Hashimoto M, Matsui A, Naito M, Inao M, Nagoshi S, et al. Genetic polymorphisms in promoter region of osteopontin gene may be a marker reflecting hepatitis activity in chronic hepatitis C patients. Biochem Biophys Res Commun 2004;313: 1079–85.
29. Iwasaki H, Shinohara Y, Ezura Y, Ishida R, Kodaira M, Kajita M, et al. Thirteen single-nucleotide polymorphisms in the human osteopontin gene identified by sequencing of the entire gene in Japanese individuals. J Hum Genet 2001;46:544–6.
30. Giacopelli F, Rosatto N, Divizia MT, Cusano R, Caridi G, Ravazzolo R. The first intron of the human osteopontin gene contains a C/EBP--responsive enhancer. Gene Expr 2003;11: 95–104.
31. Jannot AS, Essioux L, Reese MG, Clerget-Darpoux F. Improved use of SNP information to detect the role of genes. Genet Epidemiol 2003;25:158–67.
32. Tahri-Daizadeh N, Tregouet DA, Nicaud V, Manuel N, Cambien F, Tiret L. Automated detection of informative combined effects in genetic association studies of complex traits. Genome Res 2003;13:1952–60.
33. Giacopelli F, Marciano R, Pistorio A, Catarsi P, Canini S, Karsenty G, et al. Polymorphisms in the osteopontin promoter affect its transcriptional activity. Physiol Genomics 2004. Epub ahead of print.
34. Alarcon-Riquelme ME. A RUNX trio with a taste for autoimmu-nity. Nat Genet 2003;35:299–300.
35. Cartegni L, Chew SL, Krainer AR. Listening to silence and understanding nonsense: exonic mutations that affect splicing. Nat Rev Genet 2002;3:285–98.
36. Kon S, Maeda M, Segawa T, Hagiwara Y, Horikoshi Y, Chikuma S, et al. Antibodies to different peptides in osteopontin reveal complexities in the various secreted forms. J Cell Biochem 2000; 77:487–98.
37. Mazumder B, Seshadri V, Fox PL. Translational control by the 3⬘-UTR: the ends specify the means. Trends Biochem Sci 2003; 28:91–8.
38. Conne B, Stutz A, Vassalli JD. The 3⬘ untranslated region of messenger RNA: a molecular ’hotspot’ for pathology? Nat Med 2000;6:637–41.
39. Mendell JT, Dietz HC. When the message goes awry: disease-producing mutations that influence mRNA content and perfor-mance. Cell 2001;107:411–4.
40. Cheng J, Zhou T, Liu C, Shapiro JP, Brauer MJ, Kiefer MC, et al. Protection from Fas-mediated apoptosis by a soluble form of the Fas molecule. Science 1994;263:1759–62.
41. Lin YH, Yang-Yen HF. The osteopontin-CD44 survival signal involves activation of the phosphatidylinositol 3-kinase/Akt signal-ing pathway. J Biol Chem 2001;276:46024–30.