Technical Report CoSBi 18/2007
Rate sensitivity analysis of a Beta binders
model of lymphocyte recruitment control
mechanism
Paola Lecca
The Microsoft Research - University of Trento Centre for Computational and Systems Biology
Wen Fong Ooi
DISI- University of Trento, Italy [email protected]
Corrado Priami
The Microsoft Research - University of Trento Centre for Computational and Systems Biology
DISI - University of Trento [email protected]
Rate sensitivity analysis of a Beta binders model of
lymphocyte recruitment control mechanism
Paola Lecca Wen Fong Ooi Corrado Priami
Abstract
The interaction between lymphocyte in the circulation and en-dothelial cells lining the blood vessels is a crucial control point in the mechanism of chemotactic detection of inflammation sites. This inter-action is mediated by a multisptep process, termed lymphocyte recruit-ment, involving lymphocyte rolling along the endothelium, activation of lymphocyte integrins, adhesion to endothelial ligands and lympho-cyte crossing the endothelium. The events of the lympholympho-cyte extrava-sation, called diapedesis is crucial in the pathogenesis of autoimmune neurological diseases, like multiple sclerosis. Recent wet-labs studies provided the data and the observations proving that chemokines mod-ulate the control of the lymphocyte-endothelial cell recognition and regulate the arrest of lymphocyte. In this paper we present a model of lymphocyte recruitment expressed in the formalism of β-binders and we explore its sensitivity in response to changes of the rates of interac-tion between chemokines and their receptors. The study is motivated by the intention to individuate those ligand/receptor interactions and their kinetic parameters that are significantly influential in determin-ing the firm arrest of the lymphocyte. We focuses the analysis on the rate coefficients of the chemokines interations. By tuning these pa-rameters we estimate the sensitivity of the model to the rapidity of the lymphocyte adhesion, that recent in vivo observations suggest to be an important factor determining the final result of the rolling process.
1
Introduction
Lymphocytes roll along the walls of vessels to survey the endothelial surface for chemotactic signals of inflammation, which stimulate the lymphocyte to stop rolling and migrate through the endothelium and its supporting base-ment membrane. Lymphocyte adhesion to the endothelial wall is mediated by binding between cell surface receptors and complementary ligands ex-pressed by the endothelium.
The attachment (or tethering) of circulating lymphocytes to the ves-sel wall is labile, permitting lymphocyte to roll in the direction of the blood flow an bringing them into proximity with activating signals, transmitted by chemokines. These cytokines trigger Gi-proteins on tethered lymphocytes to activate a second class of adhesion receptors, integrins, which firmly bind to IgSF members like VCAM-1 and ICAM-1 leading to an arrest of rolling lymphocyte. The arrested lymphocyte uses these integrins interactions to cross the endothelial lining of the blood vessel and migrate into tissue where it can follow subsequent chemoattractive gradients. This paradigm has been validated for mature blood cells both in vivo and in vitro [2, 17]. Few years ago a novel intravital microscopy model was developed to directly analyze through the skull the interactions between lymphocytes and the endothelium in cerebral venules of mice [17]. The phenomenology of lymphocyte recruit-ment on the inflamed endothelium is attracting the attention of scientific community because its crucial role in inflammatory autoimmune diseases like multiple sclerosis. Understanding the molecular basis of the dynamics, and most importantly the sensitivity of the model to the those kinetic pa-rameters governing the rapidity of the lymphocyte adhesion and modulating the frequency of firm arrest cases.
The recent advancements in technology and the increasing maturity in experimental methods are disclosing the molecular mechanisms of the lym-phocyte recruitment on the inflammation sites and allow accurate measure-ments of the hemodynamic and kinetic parameters related to the rolling of the lymphocyte along the endothelium [1, 8, 11, 12, 15, 20, 21]. In turn, the increasing availability of accurate data enables the modelling and the simulation of the recruitment process in silico, on a computer. In this paper we present a novel model of lymphocyte recruitment specified in the Beta binders formalism [6, 18] and an analysis of the sensitivity of the model response to changes of the rate coefficients of the interaction between the chemokines expressed on the endothelium and their receptors on the lympho-cyte. Our study focuses the sensitivity analysis on such parameters because the chemokines activation stirs up the activation of those integrins responsi-ble for the firm arrest of the cell and its migration into the tissue, principal cause of autoimmune diseases. This work is inspired by a previous study of Lecca et al. [5, 14], in which a model of lymphocyte recruitment specified in biochemical stochastic π-calculus was developed and simulated using the
experimental data obtained from intravital microscopy experiments by Con-stantin et al. [17]. Therefore, the present study has to be intented also as a demonstration of the greater flexibility and adequacy of the Beta binders language w. r. t. π-calculus in describing parallel highly specific molecular interactions.
2
Mechanism of Lymphocyte recruitment
A critical event in the pathogenesis of multiple sclerosis, an autoimmune disease of the central nervous system, is the migration of lymphocytes (from brain vessels to brain parenchima). The extravasation of lymphocytes is me-diated by highly specialized groups of cell adhesion molecules and activation factors. The process leading to lymphocytes migration is divided into four main kinetic phases: 1) initial contact with the endothelial membrane (teth-ering) and rolling along the vessel wall; 2) activation of a G-protein, induced by a chemokine exposed by the inflamed endothelium and subsequent activa-tion of integrins; 3) firm arrest; 4) crossing of the endothelium (diapedesis). We rely here on a model of early inflammation in which brain venules express E- and P-selectin, ICAM-1 and VCAM-1 [17]. The leukocyte is represented by encephalitogenic CD4+T lymphocytes specific for PLP139-151, cells that
can induce experimental autoimmune encephalomyelitis (the animal model of multiple sclerosis).
The tethering and rolling steps are mediated by binding between cell sur-face receptors and complementary ligands expressed on the sursur-face of the endothelium. The principal adhesion molecules involved in these phases are the selectins: the P-selectin glyco-protein ligand-1 (PSGL-1) on the autore-active lymphocytes and the E- and P-selectin on the endothelial cells. The action of integrins is partially overlapped to the action of selectins/mucins: α4 integrins and LFA-1 are also involved in the rolling phase, but with a less
relevant role.
Chemokines have been shown to trigger rapid integrin-dependent lym-phocyte adhesion in vivo through a receptor coupled with Gi proteins.
Integrin-dependent firm arrest in brain microcirculation is blocked by per-tussis toxin (PTX), a molecule able to ADP ribosylate Gi proteins and block
their function. Thus, as previously shown in studies on naive lymphocytes homing to Peyer’s patches and lymphonodes, encephalitogenic lymphocytes also require an in situ activation by an adhesion-triggering agonist which exerts its effect via Gi-coupled surface receptor.
The firm adhesion/arrest is mediated by lymphocyte integrins and their ligands from the immunoglobulin superfamily expressed by the endothelium. The main adhesion molecules involved in cell arrest is integrin LFA-1 on lymphocyte and its receptor ICAM-1 on the endothelium. The action of α4 integrins is partially overlapped to the action of LFA-1: α4 integrins are
involved in the arrest but they have a less relevant role [17].
3
The Beta binders formalism
Beta binders (β-binders) [6] is a formal language that merges the basic features of classical π-calculus [16] with the intuition that, in order to better represent the concepts of specific interaction sites of a biological entity, the π-calculus concurrent processes can be wrapped by borders equipped with explicit interaction sites.
A process in β-binders, termed bio-process, is defined as a box with a proper border and an internal machinery. The entities lying within the borders, termed π-processes, are formally made up of a certain number of operators that allow to express the possible ways of evolution of the bio-process. In a pictorial view the enclosing borders resemble the interface that the biological entity exhibits to the external view. This interface is pare metrically defined by a set of binders (called beta binders), representing and specifically characterising the interaction sites (see Fig. 1). We refer the reader to [6] for an introductory reading about the original formulation of β-binders language. Here we report the basics of BetaSim language, giving the formal definition of bio-process and π-process.
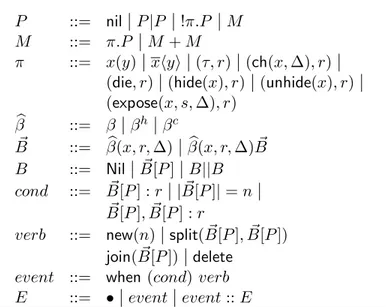
The BetaSIM language [7, 19] is based on the stochastic extension of β-binders [18], where the time evolution of the system of bio-processes is driven by the values of stochastic rates, representing the specific speed of interaction between bio-processes and between the processes inside the box. These rates abstract the rates coefficients of the chemical reactions defined in the stochastic formulation of chemical kinetics [10]. Like in the π-calculus, also in the β-binders the biological entities are represented as computational processes an the chemical interactions as pairwise communications between the processes on shared channels. With respect to the original syntax, in BetaSIM several modifications have been introduced. All the modifications are deeply discussed in [7, 19]. A BetaSIM program, called also β-system, is a tuple Z=hB, E, ξi which is a composition of a bio-process B, a list of events E and ambient ξ. The bio-process B intuitively represents the structure of the system, that is a set of entities interacting in the same environment, E represents the list of possible events enabled on the system and the ambient ξ contains information about the environment, that, for clearness reasons, we will discuss in more detail later. The bio-process B, the list of events E, and the binders are defined according to the grammar reported in Table 1. Processes P are referred as π-processes. A π-process P can be a deadlock process (nil), i. e. a process that can do nothing, a parallel composition of π-processes, P |P , an action-prefixed process π.P , a replicated π-process, !π.P = π.P |!π.P , and a non-deterministic choice M + M , where M is a process in turn. π denotes an action. Besides the standard actions of the
π-calculus, as receiving a name y on a channel x (x(y)), sending a name y on a channel x (xhyi), and the silent action τ , π-processes exhibit new interaction capabilities, i. e. change (ch), die, expose, hide, and unhide, employed to describe the evolution of the bio-process interface. As we will see later, they represent monomolecular reactions. Boxes are defined as π-processes prefixed by specialised binders that represent interaction capabilities. An elementary beta binder has the form β(x, r, Γ) (active), βh(x, r, Γ) (hidden)
or βc(x, r, Γ) (complexed), where the name x is the subject of the beta binder and Γ represents the type of x.
P ::= nil|P |P |!π.P |M M ::= π.P |M + M
π ::= x(y)|xhyi|(τ, r)|(ch(x, ∆), r) |
(die, r)|(hide(x), r)|(unhide(x), r)|
(expose(x, s, ∆), r) b β ::= β |βh |βc ~ B ::= β(x, r, ∆)b |β(x, r, ∆) ~b B B ::= Nil|B[P ]~ |B||B cond ::= B[P ] : r~ || ~B[P ]| = n| ~ B[P ], ~B[P ] : r
verb ::= new(n)|split( ~B[P ], ~B[P ]) join( ~B[P ])|delete
event ::= when (cond) verb E ::= •|event|event :: E
Table 1: BetaSIM language syntax.
A bio-process B is either a deadlock bio-process Nil or a parallel compo-sition of boxes ~B[P ]. Let refer to the Fig. 1. The pairs xi: ∆i represent the
sites through which the box may interact with other boxes. Types ∆iexpress
the interaction capabilities at xi. The value r represents the stochastic rate
associated to the name x inside the box, h represents the hidden status and the vertical dash over the last beta binder represents the complexed status. Finally, the information contained in the environment ξ consists in the set T of the considered types (ranged over by ∆, Γ0, Σ0, · · ·), a function
ρ : N → R that associates stochastic rates to the action names in N and the function α : T2 → R3, which describes the affinity relation between
couples of types. In particular, given two types ∆ and Γ, the application of α(∆, Γ) returns a triple of stochastic rates (r, s, t), where r, denoted with αc(∆, Γ), represents the complexation rate, s, denoted with αd(∆, Γ),
P
(x1: ∆1)r (x2: ∆2)r(x3: ∆3)r
Figure 1: Graphical representation of a bio-process ~B[P ] exposing three binders (x1 : ∆1)r, (x1 : ∆1)r, and (x3 : ∆3)r, and containing a π-process
P . See in the text for the formal definition of π-processes and bio-processes.
inter-communication rate. The rates can assume also an infinite value (inf ) to indicate that the communication is instantaneous.
The evolution of the system is formally specified through the operational semantics of the language, which defines the actions of intra communication involving the π-processing inside a box, inter communication between two boxes, join operation, specifying the merging of to boxes and split operation defining the splitting of a box into two boxes. These operations/actions can be used to express mono-molecular and bi-molecular biochemical reactions. Mono-molecular actions describe the evolution of single boxes. More pre-cisely, an intra communication action allows components to interact within the same box, the expose action adds a new site of interaction to the inter-face of the box containing the expose, the change action modifies the type of an interaction site, hide and unhide actions make respectively invisible and visible an interaction site. Finally, the die action eliminates the box. The complex operation creates a dedicated communication binding between boxes over compatible i. e. binders whose types have non null intersection -and unhide elementary beta binders, while the decomplex operation destroys an already existing dedicated. A linkage that connects the two interfaces illustrates the formation of complex between two binders whose types are such that ∆ ∪ Γ 6= ∅ (Fig. 2).
P (x : ∆)r k Q (y : Γ)r P (x : ∆)r k Q (y : Γ)r
Figure 2: The complex operation creates a dedicated communication bond, whereas a decomplex operation destroy it.
The stochastic rates associated to complex and decomplex operations are αc(∆, Γ) and αd(∆, Γ), respectively. The information about the existing
dedicated bindings is maintained in the ambient.
The inter-communication is also bi-molecular action that can be used to abstract bi-molecular reactions. It enables interaction between boxes
over compatible and unhide elementary beta binders. Let the types asso-ciated to the involved elementary beta binders be represented by ∆ and Γ . If αc(∆, Γ) > 0, then the inter-communication is enabled, with rate
αi(∆, Γ), only after a dedicated communication binding, over the involved
beta binders, has been created by a complex operation. Otherwise, the inter-communication is simply enabled with rate αi(∆, Γ).
Events can be considered as an implementation of the rules describing the way in which tow boxes can join together and those for the splitting of a box into two boxes, namely, an event is the composition of a condition cond and an action verb, which is triggered only if the event condition is fulfilled on the structure of the bio-process representing the system. The operations of join and split can be used to render biological endocytosis, namely the absorption of substances from the external environment. Finally, the event new denotes the creation of new boxes (new (n) denotes the generation -also chemical synthesis - of n copies of a box), whereas the event delete eliminates a box from the system, and can be used to represent the chemical degradation.
4
The β-binders specification of lymphocyte
re-cruitment
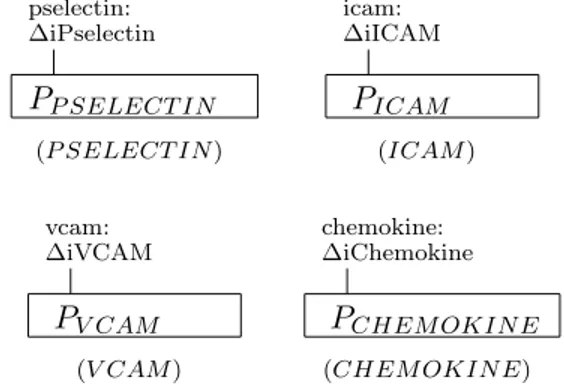
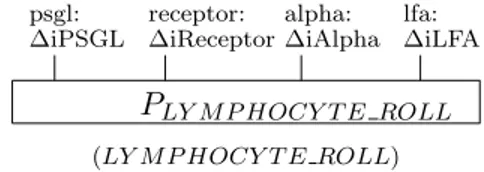
Lymphocytes and ligands on the activated brain endothelial cells are mod-eled as bio-processes. The molecules P-Selectin, ICAM-1, VCAM-1, and CHEMOKINE, that are expressed on the endothelium, are represented by bio-processes as in Fig. 3. The lymphocyte is represented by the bio-process depicted in Fig. 4. The interface of the bio-process LYMPHOCYTE presents four binders, representing the interaction sites specific for the corresponding four endothelial molecules.
pselectin: ∆iPselectin PP SELECT IN icam: ∆iICAM PICAM (P SELECT IN ) (ICAM ) vcam: ∆iVCAM PV CAM chemokine: ∆iChemokine PCHEM OKIN E
(V CAM ) (CHEM OKIN E)
psgl: ∆iPSGL receptor: ∆iReceptor alpha: ∆iAlpha lfa: ∆iLFA PLY M P HOCY T E (LY M P HOCY T E)
Figure 4: Graphical representation of lymphocyte. It is inspired to the real biological structure depicted in Fig. 16 in Appendix B.
The π-processes are defined as in the following:
PSELECT IN :=!r.pselectin.r.nil|pselectin.r.nil (1)
PV CAM := nil, PICAM := nil (2)
PCHEM OKIN E:=!r.chemokine.r.nil|chemokine.r.nil (3)
PLY M P HOCY T E :=
psgl.ch(psgl, iP SGL2).receptor.unhide(alpha).unhide(lf a).nil (4)
The formation of a tethering bond between the lymphocyte and the en-dothelium is modeled by a complex operation involving the binders (psgl1 : ∆iP SGL) and (pselecting : ∆iP selectin), defined on the interfaces of the bio-processes LYMPHOCYTE and PSELECTIN, respectively (see Fig. 5).
psgl: ∆iPSGL receptor: ∆iReceptor alpha: ∆iAlpha lfa: ∆iLFA PLY M P HOCY T E pselectin: ∆iPselectin PSELECT IN
Figure 5: The formation of LY M P HOCY T E P SELECT IN through com-plex operation and α(∆ iPSGL,∆ iPselectin)=(m, n, inf ), and m, n > 0.
Once the complex operation has done, inter communication between these two bio-processes takes place instantaneously, i. e. at infinite rate.
PSELECT IN acts as a sender and PLY M P HOCY T E acts as a receiver (see
formulas (2) and (4)). A message is sent through and received by respective channel. The change of ∆iPSGL to ∆iPSGL2 occurs upon receiving the message which in turn indicates the lymphocyte enters rolling state. The structure is indicated as LY M P HOCY T EROLL, as in Fig. 6 where
The bond between LYMPHOCYTE and PSELECTIN can be broken at dissociation rate, Cd which is defined in the second parameter of α
func-tion. After breaking apart, LY M P HOCY T EROLL and P SELECT IN are
restored. psgl: ∆iPSGL receptor: ∆iReceptor alpha: ∆iAlpha lfa: ∆iLFA PLY M P HOCY T E ROLL
(LY M P HOCY T E ROLL)
Figure 6: Graphical representation of lymphocytes in rolling state.
The binding of the chemokines to their recptors activates the integrins. It is represented by an inter communication through the binders ∆iChemokine and ∆iReceptor on CHEM OKIN E and LY M P HOCY T E respectively. Inter communication between CHEM OKIN E and LY M P HOCY T EROLL
takes place immediately after complexation by sending a dummy message to trigger the activation. The bio-process CHEM OKIN E is the sender while thebio − processLY M P HOCY T EROLL is the receiver. Upon
receiv-ing the message from CHEM OKIN E, the hidden interfaces, ∆iAlpha and ∆iLFA are unhidden. Such an abstraction represents successful activation of integrins. After the activation, ∆iLFA and ∆iAlpha are unhidden. The unhidden interfaces prepares LY M P HOCY T E ROLL to be arrested on the endothelial cells. The interaction between LFA-1, α4-integrins with
ICAM-1 and VCAM-1 respectively in an exact recruitment system is rep-resented by the complex formation and breakage through ∆iLFA, ∆iICAM and ∆iAlpha, ∆iVCAM.
The model is simulated under the setting of amounts of ligands and lymphocytes, spatial parameters and kinetics as in [14]. The length of the brain vessel is 100µm, its radius is 25µm so that the mechanism is simulated in a space of volume of 1.96×105µm3. Initial quantity of LY M P HOCY T E,
P SELECT IN , ICAM , V CAM and CHEM OKIN E are 88, 88, 86, 15, and 236 respectively in the simulation system. The stochastic engine driving the evolution of the system of bio-processes is the Gillespie algorithm [10]. Stochastic rates of association and dissociation, respectively Caand Cd, and
for the interactions governing the four phases of the recruitment, are derived from the deterministic rates kon and kof f reported in [13, 14] (and here in
Table 2), through the formulas Ca = 2kon/V and Cd = kof f/V . In our
simulation all rates are amplified by 104 with assumption that the number
of molecules in the preset volume of brain microvessel is the order of 104. Moreover, unless it is explicitly stated, all the rate values are measured in s−1.
Process kon(s−1) kof f(s−1) Reference
Tethering 84 1 [3]
Rolling 84 100 [3]
Activation of Chemokines 0.5 75 [13]
Firm Adhesion 84 20 [3]
Table 2: Deterministic rates for the 4-phases of lymphocyte recruitment.
5
Simulation results
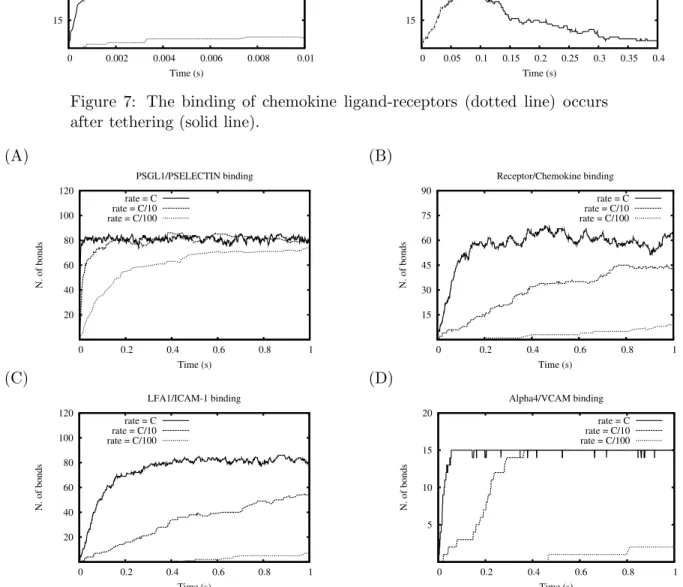
The simulation of the model has been performed for three configurations: (i) with all the rate coefficients at the orginal values, (ii) with all the rates decreased by 10, and (iii) with all the rates decreased by 100. The number of bonds between the ligands and the corresponding receptors of each molecular interactions are shown in Fig. 8. Let focus the analysis to the red curves. In PSGL-1/P-Selectin binding (Fig. 8(A)), the slope is steep at the beginning. After 0.02 seconds, the number of bonds steadily fluctuates within 80 and 88. On the other hand, the activation process (the binding of chemokine to its receptor) is in slower pace at the beginning (Fig. 8(B)). The number of bonds is stable after 0.15 seconds but the amount of bounded molecules varies more significantly within a short time frame. The approximate difference can be as low as 52 bonds and as high as 68 bonds. The results of simulation (Fig.7) are in agreement with those obtained from the π-calculus model in [14] and describe the phases of the mechanism of lymphocyte recruitment. The pre-requisite of integrins’ activation (LFA-1,α4) is the tethering and
rolling process. Fig.7 (A) successfully demonstrates the rising of PSGL-1/P-selectin binding is followed by a gradual increase in receptor/chemokine binding. The decreasing volume in tethering (Fig.7 (B)) portrays the state-shift in lymphocytes from free-flowing to rolling.
The response of LFA-1 and α4towards the ligands after the activation by
chemokines is depicted in Fig. 8 (C). The binding of LFA-1/ICAM-1 is al-most immediate and parallel to the activation at the initial simulation time. α4 binding to its corresponding ligand, VCAM-1, is slightly late in
compar-ison with the immediate response of LFA-1 (Fig.8 (D)). It is worth noting that the number of LFA-1/ICAM-1 is restricted by the number of recep-tor/chemokine. However, this phenomenon lasts a short time after the be-ginning of tethering. LFA-1/ICAM-1 amount overtakes receptor/chemokine at about 0.033 seconds. This is due to the fact that receptor/chemokine dis-sociates at a faster rate and the free chemokines promptly attach to other lymphocytes. The number of α4/VCAM-1 bonds, after 0.1 s, becomes
con-stant, because the number of α4far exceeds the number of available VCAM-1
(A) 15 30 45 60 75 90 0 0.002 0.004 0.006 0.008 0.01 N. of bonds Time (s) Tethering Activation (B) 15 30 45 60 75 90 0 0.05 0.1 0.15 0.2 0.25 0.3 0.35 0.4 N. of bonds Time (s) Tethering Activation
Figure 7: The binding of chemokine ligand-receptors (dotted line) occurs after tethering (solid line).
(A) 20 40 60 80 100 120 0 0.2 0.4 0.6 0.8 1 N. of bonds Time (s) PSGL1/PSELECTIN binding rate = C rate = C/10 rate = C/100 (B) 15 30 45 60 75 90 0 0.2 0.4 0.6 0.8 1 N. of bonds Time (s) Receptor/Chemokine binding rate = C rate = C/10 rate = C/100 (C) 20 40 60 80 100 120 0 0.2 0.4 0.6 0.8 1 N. of bonds Time (s) LFA1/ICAM-1 binding rate = C rate = C/10 rate = C/100 (D) 5 10 15 20 0 0.2 0.4 0.6 0.8 1 N. of bonds Time (s) Alpha4/VCAM binding rate = C rate = C/10 rate = C/100
Figure 8: Simulations with all rates at original setting (solid line), with all rates decreased by 10 (dashed lines), and with all rates decreased by 102 (dotted line)
in-cluding overall sensentivity based on different decrement rates; model’s re-sponsiveness to the change of VCAM-1’s total amount; effect of different association/dissociation rates of receptor/chemokines binding and the ca-sual consequence of activated LFA-1 on lymphocytes to the attachment to ICAM-1.
5.1 Sensitivity analysis
Three major sensitivity analyses were conducted. Let Ca and Cd denote
respectively stochastic association and dissociation rates of the interactions between chemokines and their receptors.
5.1.1 Analysis with decreasing rate coefficients.
The time behavior of number of bonds for each molecular interactions in three simulations (Fig.8.) exhibits significant differences. Decreasing the rates results in a less frequent process of binding/unbinding between the ligands and their receptors. Since the chemokine-receptors system triggers the integrin-dependent firm arrest of lymphocytes, an insufficient number of interactions between chemokines and chemokines receptors, even in a situa-tion of lymphocyte rolling with low speed, could cause a firm arrest of the cell out of the area relevelant to the adhesion-triggering stimulus.
5.1.2 Analysis with different amounts of VCAM-1.
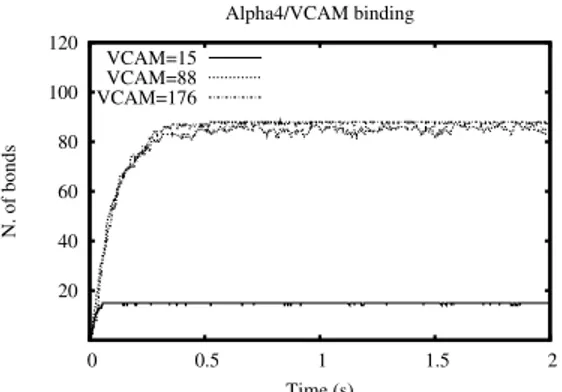
The simulations with 15 instances of VCAM-1 (Fig. 9: solid line), 88 VCAM-1 (Fig.9: dotted line) and 176 VCAM-1 (Fig. 9: dashed line) were run. The results in Fig. 9 show that VCAM-1, in presence of excessive amounts of α4, are rapidly saturated so that the rate of variation of the
number of α4/VCAM-1 bonds rapidly zeroes. VCAM-1 in excessive amount
and equivalent amount of lymphocytes (dashed and dotted curves in Fig. 9) show different behavior on the graph w. r. t. the case in which both or them are present in small quantities.
However the velocity of the binding reaction between α4 and VCAM-1
within the very first instants of the simulation is the same in all the three cases.
5.1.3 Analysis with different Ca, Cd
Simulations were run under different Caand Cd of receptors to chemokines.
The objective of the analysis is to identify the relationship between different combinations of Ca, Cdand the subsequent effect on the time behavior of the
20 40 60 80 100 120 0 0.5 1 1.5 2 N. of bonds Time (s) Alpha4/VCAM binding VCAM=15 VCAM=88 VCAM=176
Figure 9: The α4/VCAM-1 binding with the total VCAM-1 of 15, 88, 176
in corresponding to red, green and blue curves.
number of bonds between chemokines and their receptors and LFA-1 and ICAM-1 molecules. The modified rates are twice higher and lower than the original rate. The analysis is divided into six categories as in the following.
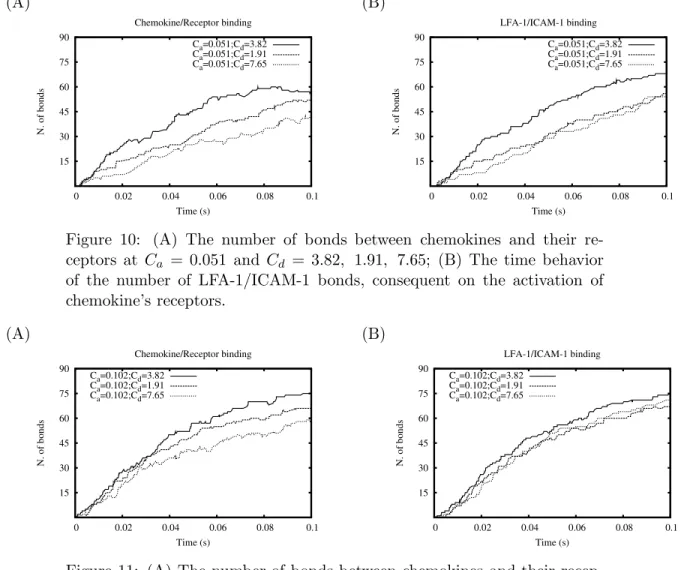
5.1.3.1 Original Ca and changing Cd (Fig.10)
Given the solid line in Fig. 10 as reference, we realize that decrement of Cd yields more receptor/chemokine bonds than increment of Cd.
However, the number of lymphocytes (LFA-1) attaching to ICAM-1 in Fig. 10 ((B), dashed line) and Fig. 10((B), dotted line) is almost the same. The lower amount of receptor/chemokine bonds in Fig10 ((A), dotted line) does not indicate that the number of activated LFA-1 is less. This is due to the detachment of the chemokine from its recep-tor and the formation of another bond later. Thus, the number of receptor/chemokine bonds (Fig. 10 (A), dotted line) is lower. How-ever, it does not results in a consequent difference in the amount of in LFA-1/ICAM-1 complexes, as we expected.
5.1.3.2 Increased Ca and changing Cd (Fig.11)
Increment of Cadoes not contribute to a increase the number of
LFA-1/ICAM-1 complexes. Both the decreased and the increased Cd (with
respect to the original value 3.82) produce almost the same amount of LFA-1/ICAM-1 bonds, whose time-behavior curve slightly lies below the curve of original setting (Fig. 11 (B): solid line). For a fixed value of Ca a decreased Cd is only responsible for a longer time of LFA-1
attachment to ICAM-1; an increased Cdmeans a faster dissociation of
the chemokine from its receptor, but if Ca does not change, variations
of Cd seem to not affect the number of bonds between LFA1 and
(A) 15 30 45 60 75 90 0 0.02 0.04 0.06 0.08 0.1 N. of bonds Time (s) Chemokine/Receptor binding Ca=0.051;Cd=3.82 Ca=0.051;Cd=1.91 Ca=0.051;Cd=7.65 (B) 15 30 45 60 75 90 0 0.02 0.04 0.06 0.08 0.1 N. of bonds Time (s) LFA-1/ICAM-1 binding Ca=0.051;Cd=3.82 Ca=0.051;Cd=1.91 Ca=0.051;Cd=7.65
Figure 10: (A) The number of bonds between chemokines and their re-ceptors at Ca = 0.051 and Cd = 3.82, 1.91, 7.65; (B) The time behavior
of the number of LFA-1/ICAM-1 bonds, consequent on the activation of chemokine’s receptors. (A) 15 30 45 60 75 90 0 0.02 0.04 0.06 0.08 0.1 N. of bonds Time (s) Chemokine/Receptor binding Ca=0.102;Cd=3.82 Ca=0.102;Cd=1.91 Ca=0.102;Cd=7.65 (B) 15 30 45 60 75 90 0 0.02 0.04 0.06 0.08 0.1 N. of bonds Time (s) LFA-1/ICAM-1 binding Ca=0.102;Cd=3.82 Ca=0.102;Cd=1.91 Ca=0.102;Cd=7.65
Figure 11: (A) The number of bonds between chemokines and their recep-tors at Ca = 0.102 but at Cd = 3.82, 1.91, 7.65; (B) The time behavior
of the number of LFA-1/ICAM-1 bonds consequent on the activation of chemokine’s receptors.
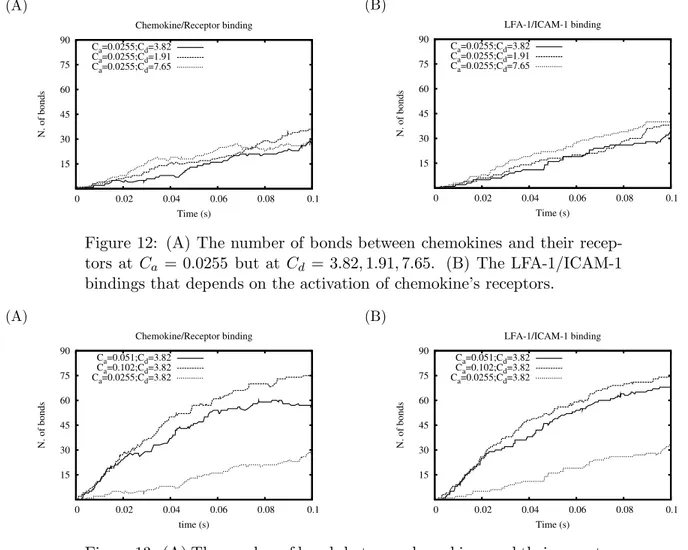
5.1.3.3 Decreased Ca and changing Cd (Fig.12)
The model does not respond sensitively to these configurations. The number of bound elements grows in insignificantly difference.
(A) 15 30 45 60 75 90 0 0.02 0.04 0.06 0.08 0.1 N. of bonds Time (s) Chemokine/Receptor binding Ca=0.0255;Cd=3.82 Ca=0.0255;Cd=1.91 Ca=0.0255;Cd=7.65 (B) 15 30 45 60 75 90 0 0.02 0.04 0.06 0.08 0.1 N. of bonds Time (s) LFA-1/ICAM-1 binding Ca=0.0255;Cd=3.82 Ca=0.0255;Cd=1.91 Ca=0.0255;Cd=7.65
Figure 12: (A) The number of bonds between chemokines and their recep-tors at Ca = 0.0255 but at Cd = 3.82, 1.91, 7.65. (B) The LFA-1/ICAM-1
bindings that depends on the activation of chemokine’s receptors.
(A) 15 30 45 60 75 90 0 0.02 0.04 0.06 0.08 0.1 N. of bonds time (s) Chemokine/Receptor binding Ca=0.051;Cd=3.82 Ca=0.102;Cd=3.82 Ca=0.0255;Cd=3.82 (B) 15 30 45 60 75 90 0 0.02 0.04 0.06 0.08 0.1 N. of bonds Time (s) LFA-1/ICAM-1 binding Ca=0.051;Cd=3.82 Ca=0.102;Cd=3.82 Ca=0.0255;Cd=3.82
Figure 13: (A) The number of bonds between chemokines and their receptors at Cd = 3.82 but at Ca = 0.051, 0.102, 0.0255. (B) The LFA-1/ICAM-1
number of bonds consequent on chemokines receptors activation.
5.1.3.4 Original Cd and changing Ca (Fig.13)
The decrement of Ca shows significant difference in the number of
bonds over the time (Fig.13 ((A), dashed line). In this case, a low value of Cacauses a proportionally low number of activated LFA-1. A
double value of Cacauses higher number of bonds of activated LFA-1
after 0.02 s (Fig.13 ((A), solid line)).
5.1.3.5 Decreased Cd and changing Ca (Fig.14)
At a low Cd, the model is sensitive to the change in Ca. This is
apparent in the binding of receptor/chemokine and LFA-1/ICAM-1. The high propensity of the chemokine to form a complex with its receptors (Fig.14((A), dashed line) could have induced more activated
LFA-1 of lymphocytes which consequently produces higher numbers of LFA-1/VCAM-1 bonds. (A) 15 30 45 60 75 90 0 0.02 0.04 0.06 0.08 0.1 N. of bonds Time (s) Chemokine/Receptor binding Ca=0.051;Cd=1.91 Ca=0.102;Cd=1.91 Ca=0.0255;Cd=1.91 (B) 15 30 45 60 75 90 0 0.02 0.04 0.06 0.08 0.1 N. of bonds Time (s) LFA-1/ICAM-1 binding Ca=0.051;Cd=1.91 Ca=0.102;Cd=1.91 Ca=0.0255;Cd=1.91
Figure 14: (A) The number of bonds between chemokines and their receptors at Cd = 1.91 but at Ca = 0.051, 0.102, 0.0255. (B) The LFA-1/ICAM-1
number of bonds consequent on chemokine’s receptors activation.
5.1.3.6 Increased Cd and changing Ca (Fig.15)
(A) 15 30 45 60 75 90 0 0.02 0.04 0.06 0.08 0.1 N. of bonds Time (s) Chemokine/Receptor binding Ca=0.051;Cd=7.65 Ca=0.102;Cd=7.65 Ca=0.0255;Cd=7.65 (B) 15 30 45 60 75 90 0 0.02 0.04 0.06 0.08 0.1 N. of bonds Time (s) LFA-1/ICAM-1 binding Ca=0.051;Cd=7.65 Ca=0.102;Cd=7.65 Ca=0.0255;Cd=7.65
Figure 15: (A) The number of bonds between chemokines and their receptors at Cd = 7.64 but at Ca = 0.051, 0.102, 0.0255. (B) The LFA-1/ICAM-1
bindings that depends on the activation of chemokine’s receptors.
The decrease in Ca to 0.0255 does not demonstrate the change in the
amount of receptor/chemokine number of bonds and LFA-1/ICAM-1 binding. However, the increment in Ca from 0.051 (Fig.15, solid line)
to 0.102 exhibits an apparent increase in the number of bonds both be-tween chemokines and their receptors and LFA1 and ICAM1. It shows
that higher rate of dissociation only responds rapidly to appropriate association rate which lies above 0.051.
6
Conclusion
From the result we obtained, modification in the number of α4-integrins
and their receptors has no effect on the speed of binding reaction and on the rapidity of bnding between LFA-1 and ICAM-1 and thence ultimately on the rapidity of lymphocyte adhesion and diapedesis.
Different association and dissociation rate of chemotactic interactions reflects different levels of sensitivity. The work shows the high sensitivity of the time behavior of the number of bonds between LFA-1/ICAM-1 in response to the variations of rapidity of chemokine binding to its receptor. Generally, increasing the specific speed of chemokines reaction leads to a rapid activation of LFA-1, to an increased number of bonds of LFA-1 with ICAM-1, and thence to a more likely diapedesis, the phenomenon whose occurrence causes the typical disorders of autoimmune neurological diseases. The model is highly sensitive to variations of the chemockine complexation rate coefficient (Ca), and much less sensitive to variation of the dissociation
constant (Cd). A brief summary of the third section of sensitivity analysis
on the number of bonds of chemokines to their receptor and the number of bonds of LFA1/ICAM1 can be drawn, referring to the subsections of section 5.1.3 as in the following.
5.1.3.1 Given Ca = 0.051 and Cd= 3.81, the results from the 50% changes in
Cd are approximately identical.
5.1.3.2 Given Ca=0.102, the model does not show differences from the cases
in which Cd is between 1.91 and 7.65.
5.1.3.3 At a low Ca (≤ 0.025), the amount of bonds over the time is strongly
relied on the dissociation rate and is positively correlated.
5.1.3.4 At rate Cd=3.82, the time course of the number of bonds between
chemokine and its receptors and LFA1/ICAM1 is significantly affected when Ca is below 0.051.
5.1.3.5 The number of bonds LFA1/ICAM1 proportionally increases with Ca
when Cd = 1.91.
5.1.3.6 Given Cd=7.64, the model will show significant difference when Ca is
References
[1] R. Alon, S. Chen, K. D. Puri, E. B. Finger and T. A. Springer, The kinet-ics of L-selectin tethers and the mechankinet-ics of selectin-mediated rolling, The Journal of Cell Biology, 138(5), pp. 1169-1180, 1997.
[2] J. J. Campbell, J. Hedrick, a. Zlotnik, M. A. Siani, D. A. Thompson, E. C. Butcher. Chemokines and the arrest of lymphocytes rolling under flow conditions, Science, 279, 1998.
[3] K. Chang, D. F. J. Tees and D.A. Hammer, The state diagram for cell adhesion under flow: leukocyte adhesion and rolling, PNAS 97(21), pp. 11262-11267, 2000.
[4] J. Choi, D.R. Enis, K.P. Koh, S.L. Shiao, and J.S. Pober, T lymphocyte-endothelial cell interactions Annual review of immunology Vol.22: 683– 709, 2003.
[5] D. D’Ambrosio, P. Lecca, C. Priami, and C. Laudanna, Concurrency in leukocyte recruitment, Trends in Immunology, 25(8): 411-416, 2004. [6] P. Degano and D. Prandi and C. Priami and P. Quaglia, Beta binders
for biological quantitative experiments, ENTCS, 2005.
[7] L. Dematt´e, C. Priami, A. Romanel, BetaWB: modelling and simulating biological processes, In Procs of 2007 Summer Simulation Multiconfer-ence, pp. 777-784, 2007.
[8] E. Evans, A. Leung, D. hammer and S. Simon, Chemically distinct tran-sition states govern rapid dissociation of single L-selectin bonds under force, PNAS 98(7), 2001.
[9] J. Fritz, A. K. Katopodis, F. Kolbinger and D. Anselmettim Force-mediated kinetics of single P-selectin/ligand complexes observed by atomic force microscopy, PNAS 95 pp. 12283-12288, 1998.
[10] D. T. Gillespie, Exact stochastic simulation of coupled chemical reac-tions, The J. of Physical Chemistry, 81(25), 1977.
[11] M. R. King and D. A. Hammer, Multiparticle adhesive dynamics: hy-drodynamic recruitment of rolling leukocytes, PNAS, 98(26), pp. 14919-14924, 2001.
[12] M. R. King and D. A. Hammer, Hydrodynamic recruitment of rolling leukocytes: simulation and cell-free experiments, BED 50, Bioengineer-ing Confenrece ASME 2001.
[13] C. Laudanna, J. Y. Kim, G. Constantin, E. Butcher, Rapid leukocyte integrin activation by chemokines. Immunol. Rev. 186: 37-46, 2002
[14] P. Lecca, C. Priami,P. Quaglia, B. Rossi, C. Laudanna, G. Constantin A Stochastic Process Algebra Approach to Simulation of Autoreactive Lymphocyte Recruitment. SIMULATION Vol.80, No.6 273–288, 2004
[15] B. Marshall, R. P. McEver and C. Zhu, Kinetic rates and theri force dependence of the P-Selectin/PSGL-1 interaction measured by atomic force microscopy, BED 50 Bioengineering Conference ASME, 2001.
[16] R. Milner, Communicating and mobile systems: the π-calculus, Cam-bridge University Press, 1999
[17] L. Piccio, B. Rossi, E. Scarpini, C. Laudanna, C. Giagulli, A. C. Is-sekutz, D. Vestweber, D. C. Butcher, G. Constantin, Molecular mech-anisms involved in lymphocyte recruitment in inflamed brain microves-sels: critical roles for P-selectin glycoprotein ligand-1 and heterotrimeric G(i)-linked receptors. J Immunol 168: 1940–1949, 2002
[18] C. Priami and P. Quaglia, Beta binders for biological interactions, In Procs of CMSB 2004.
[19] A. Romanel, L. Dematte and C. Priami, The Beta Workbench, The Microsoft Research - University of Trento Centre for Computational and System Biology (available at http://www.cosbi.eu), TR 03, 2007
[20] D. W. Schmidtke and S. L. Diamond, Direct observation of membrane tethers formed during neutrophil attachment to platelets or P-selectin under physiological flow, The Journal of Cell Biology 149(3), 2000.
[21] C. Zhu, G. Bao and N. Wang, Cell mechanics: mechanical response, cell adhesion and molecular deformation, Annu. rev. Biomed. Eng. 2, pp- 189-226, 2000.
Appendix B: Lymphocyte’s structure
Figure 16: Comparison of EC and DC T cell contact regions. On the left side, this figure illustrates some of the membrane-bound molecules on the EC surface that may participate in antigen presentation and subsequent T cell activation. Depicted is a docking structure, unique to T cell/EC adhe-sion, that forms a membrane cup around the base of the T cell. Prelimi-nary data suggest that, in the presence of antigen, an immune synapse can form within the docking structure, differentiating into a central supramolec-ular activation complex (c-SMAC), consisting of MHC and costimulatory molecules, and a peripheral supramolecular activation complex (p-SMAC), consisting of adhesion molecules. Such immune synapses are well formed in contacts between a T cell and classical antigen presenting cell (DC), which is shown on the right side of the figure. The molecules that are thought to be unique to either APC type are colored differentially, EC in pink and DC in yellow [4].
Appendix C: Configurations
Rate constants Figure Configuration
Original 8: solid line Cassoc= 2kon/V × 104
Cdissoc= kof f/V × 104
Rates decrease by 101
8: dashed line Cassoc= 2kon/V × 103
Cdissoc= kof f/V × 103
Rates decreased by 102
8: dotted line Cassoc= 2kon/V × 102
Cdissoc= kof f/V × 102
Different amount Cassoc= 2kon/V × 104
of VCAM-1 Cdissoc= kof f/V × 104
9: solid line VCAM-1 = 15 9: dotted line VCAM-1 = 88 9: dashed line VCAM-1 = 176
Different Ca,Cd Original amount of substances
ex-cept VCAM-1=88 10: solid line Ca= 0.051, Cd= 3.82 10: dashed line Ca= 0.051, Cd= 1.91 10: dotted line Ca= 0.051, Cd= 7.65 11: solid line Ca= 0.102, Cd= 3.82 11: dashed line Ca= 0.102, Cd= 1.91 11: dotted line Ca= 0.102, Cd= 7.65 12: solid line Ca= 0.0255, Cd= 3.82 12: dashed line Ca= 0.0255, Cd= 1.91 12: dotted line Ca= 0.0255, Cd= 7.65 13: solid line Ca= 0.051, Cd= 3.82 13: dashed line Ca= 0.102, Cd= 3.82 13: dotted line Ca= 0.0255, Cd= 3.82 14: solid line Ca= 0.051, Cd= 1.91 14: dashed line Ca= 0.102, Cd= 1.91 14: dotted line Ca= 0.0255, Cd= 1.91 15: solid line Ca= 0.051, Cd= 7.65 15: dashed line Ca= 0.102, Cd= 7.65 15: dotted line Ca= 0.0255, Cd= 7.65
Table 3: The configurations of all simulations. The original settings in term of the amount are: Lymphocyte = 88 ; PSelectin = 88; ICAM = 86; VCAM = 15; Chemokine = 236. If there is no special remark, the configuration in amount is based on the original one.
