UNIVERSITY
OF TRENTO
DIPARTIMENTO DI INGEGNERIA E SCIENZA DELL’INFORMAZIONE
38050 Povo – Trento (Italy), Via Sommarive 14 http://www.disi.unitn.it
MICROWAVE IMAGING FROM AMPLITUDE-ONLY DATA –ADVANTAGES AND OPEN PROBLEMS OF A TWO-STEP MULTI-RESOLUTION STRATEGY A. Massa, and ElediaLab
November 2008
ELEDIALab: DIT-PRJ-07-062 - Rapporto Tecnico N.10 page 1/13
ELEctromagnetic DIAgnostics Lab.
Information Engineering and
Computer Science Dept.
University of Trento
Via Sommarive 14, 38050 Trento, ITALY
Phone +39 0461 882057 Fax +39 0461 882093
E-mail:
[email protected]
Contract No. DIT-PRJ-07-062
Rapporto Tecnico N. 10
“Microwave Imaging from Amplitude-Only Data –
Advantages and Open Problems of a Two-Step
Multi-resolution Strategy”
Document 1 - Version: 1.0 Document status: Draft
Access: Confidential Date: 11/09/2008
ELEDIALab: DIT-PRJ-07-062 - Rapporto Tecnico N .10 page 2/13 Index Index... 2 1 ABSTRACT... 3 2 INTRODUCTION... 3 3 MATHEMATICAL FORMULATION ... 4
4 THE PHASELESS DATA INVERSION PROCEDURE ... 4
4 NUMERICAL AND EXPERIMENTAL VALIDATION ... 7
5 CONCLUSIONS ... 13
ELEDIALab: DIT-PRJ-07-062 - Rapporto Tecnico N .10 page 3/13
1 ABSTRACT
In this report, a two step strategy for the inversion of amplitude-only data in microwave imaging applications is analyzed. At the first step of the proposed method, the illuminating source is synthesized according to a line sources model in order to compute the incident field in the investigation domain starting from the values available in the measurement domain. The second step is aimed at reconstructing the profile of the objects under test thanks to the iterative multi-scaling approach integrated with the Particle Swarm Optimizer, an effective evolutionary minimization technique. The reconstruction accuracy of the proposed phaseless retrieval strategy is analyzed using synthetic data concerned with a multiple scatterer configuration and successively further assessed inverting experimental data
2 INTRODUCTION
The reconstruction of geometrical and physical characteristics of unknown objects is a topic of great interest in several different applied sciences [1-3]. In this context, microwave imaging techniques are potentially very appealing, but they have some intrinsic drawbacks related to the nature of the inverse scattering problems and to the complexity of the hardware setup required to collect the necessary field measures. As a matter of fact, such inverse scattering problems are ill-posed, highly non-linear and the amount of collectable information is limited even though multi-illumination, multi-view and multi-frequency systems are considered. In [4, 5], a criterion for evaluating the upper-bound of the collectable information is provided and some guidelines for determining the optimal number of retrievable parameters are suggested. According to these criteria, the step of the employed discretization grid cannot be arbitrarily fine and therefore multi resolution strategies are desired in order to improve the accuracy of the reconstruction process. Moreover, the data acquisition requires complex and expensive hardware setups. In particular, the measurement of the phase distribution turns out to be critical when high frequencies are considered. Holographic and interferometric techniques could be introduced to retrieve the phase information starting from amplitude-only data, but they need additional post-processing and they cannot be applied to a large frequency range (generally they are used in optical applications [6, 7]). In order to realize a reliable and cost-effective imaging apparatus, some different strategies based on phaseless data have been developed in the past. Two main class of approaches are usually taken into account:
• the direct exploitation of reconstruction algorithms for the processing of phaseless field data (Single-Step Strategy, see for example [8, 9]);
• the splitting of the phaseless-data reconstruction into a two-step process (Two-Step Strategy) where the first step deals with a phase-retrieval problem for completing the amplitude-only data and the second one is concerned with a standard reconstruction from complete field data (see for example [10, 11]).
In this contribution, the two-step strategy for dealing with amplitude-only data presented in [12] is considered for a further assessment. The amplitude-only problem is presented in Section 3, while the inversion procedure is described in Section 4. In particular, the inverse source problem is presented and solved through the modeling of the incident electric field (First Step) according to the Distributed-Cylindrical-Waves Model (DCW-Model). Successively, a multi-resolution cost functional [13, 14] is defined and minimized exploiting the Particle Swarm Optimizer [15], one of the most effective evolutionary iterative procedures. Some numerical and experimental results are presented in Section 5 in order to assess the reconstruction accuracy of the proposed methodology. Finally, some conclusions are drawn in Section 6.
ELEDIALab: DIT-PRJ-07-062 - Rapporto Tecnico N .10 page 4/13
3 MATHEMATICAL
FORMULATION
Let us consider a tomographic imaging configuration, in which an unknown cylindrical object is located in an inaccessible investigation domain whose characteristics are represented through the contrast function
I D
( )
r τ defined as( )
( )
( )
0 2 1 ε π σ ε τ f j r r r r = − −( )
r ∈DI (1)where εr is the relative dielectric permittivity and σ the electric conductivity. Such a scenario is illuminated by a set of V TM-polarized incident electromagnetic waves and let us assume the knowledge of the amplitude of the total field, ( m(v))
v tot
E r , and the amplitude and phase of the incident electric field, Eincv (rm( )v ), in M(v) measurements points, , being the observation domain external to . Considering the phase of the incident field does not limit the phaseless nature of the algorithm because the measurements of can be executed only once and off-line for each hardware setup and they are not so-expensive being limited to a reduced number of points in the observation domain.
M D M v m )∈D (r ( ) I D ( )) ( mv v inc E r
The relation between unknowns (τ
( )
r and the internal total field ) and the amplitude-only data is expressed by the following equations) (r v tot E ( ) = ( ) +
∫
( ) I D v m v tot v m v inc v m v tot E j E G d E (r ) (r ) ωμ0 τ(r') (r') (r /r') r' (2)∫
− = I D v tot v tot v inc E j E G d E (r) (r) ωμ0 τ(r') (r') (r/r') r' (3)where G(r/r') is the free space green function.
It can be noticed that in (3) the values of the amplitude of the incident field in the investigation domain are necessary. From a practical point of view, it is a critical issue because the measurements have to be performed in a large number of points if a satisfactory resolution level is desired. Moreover, the experimental system (and in particular the electromagnetic sensors) is moved by means of a mechanical apparatus with some tolerances in the positioning that can have a relevant impact on the accuracy of the phase measurement. Therefore, a reduced sampling distance between adjacent positions in would result in an inaccurate measure of the field and, consequently, each field sample would be corrupted by a non-negligible error. For avoiding such drawbacks, a suitable model of the radiating source will be defined at the first step of the inversion procedure described in the following section.
I
D
4
THE PHASELESS DATA INVERSION PROCEDURE
The proposed two step strategy that allows the retrieval of the contrast function from the measurements carried out in the investigation domain can be described through the schema of Fig. 1. The relevant operations performed during the two-step approach can be grouped in seven different stages described in the following.
ELEDIALab: DIT-PRJ-07-062 - Rapporto Tecnico N .10 page 5/13
Fig. 1. Two Step Strategy
Stage 1 – Data acquisition. This preliminary stage in concerned with the acquisition of the inputs
for the inversion process, that is the amplitude of the total field, Etotv (rm(v)) , and the amplitude and phase of the incident electric field, Eincv (rm( )v ), in DM.
STEP 1 – SOURCE SYNTHESIS
The first step of the proposed approach consists in the Stage 2 for determining the optimal configuration of the weighting coefficients of the DCW Model, which allow us to compute (Stage 3) the incident field in the investigation domain during the multi-resolution process.
Stage 2 – Coefficients tuning. As discussed in the previous section, because of the complexity and
of the difficulties in collecting reliable measures in a dense grid of points, let us assume that the incident field, , is only available at the measurement points belonging to the observation domain. Therefore, in order to apply the constraints stated through. (3) and before facing with the data inversion, it is mandatory to develop a suitable model able to predict the amplitude of the
( ))
( mv
v inc
ELEDIALab: DIT-PRJ-07-062 - Rapporto Tecnico N .10 page 6/13 incident field radiated by the actual electromagnetic source in the investigation domain . According to the DCW Model, the antenna is represented by means of a linear array of W equally spaced line-sources and therefore the electric field can be computed as
I D
( )
( )(
w W w w v d k H A f k 0 2 0 1 0 2 0 8∑
= − = ε π ς r)
(4)where is the Euclidean distance between the position of w-th element of the array and r, is the free-space wavenumber and is the 0-th order second-kind Hankel function. The optimal configuration w d k0 ( )2 0 H
( )
Aopt of the unknown weighting coefficients, , is determined minimizing thedifferences between the measures of the incident field and the synthesized values in the observation domain . Therefore, the following problem is considered:
w A M D ( )
( )
( )
( ) ( ) ( ) ( )( )
( ) ( ) ⎪ ⎪ ⎭ ⎪ ⎪ ⎬ ⎫ ⎪ ⎪ ⎩ ⎪ ⎪ ⎨ ⎧ ⎟ ⎟ ⎟ ⎟ ⎟ ⎠ ⎞ ⎜ ⎜ ⎜ ⎜ ⎜ ⎝ ⎛ − =∑ ∑
∑ ∑
= = = = V v M v m v m v inc V v M v m v m v v m v inc opt v v E E 1 1 2 1 1 2 min arg r r r A A ς . (5)which is solved using the well-known Singular-Value-Decomposition algorithm.
Stage 3 – Computation of the incident field. Once the parameters are determined, the electric
field can be evaluated in every point (for whatever resolution level) of the investigation domain according to (4).
STEP 2 – MULTI-SCALING RETRIEVAL PROCESS
The amount of information in phaseless data is clearly more limited than in the full data ones. As a matter of fact, beyond the typical limitations of the inverse scattering problem, when amplitude-only data are considered the collectable information is unavoidably further reduced. Therefore, the iterative multi-scaling approach (IMSA) [13] (described in the Stages 4-6) has been customized for dealing with amplitude-only measures in order to efficiently exploit the problem data and adaptively improving the quality of the reconstructed profiles thanks to an iterative process.
1 =
s
Stage 4 – Cost function minimization ( ). The IMSA procedure is initialized ( indicating the low order reconstruction) assuming a uniform distribution of the unknowns (according to the guidelines given in [4, 5]). Moreover, the value of the incident field in each sub-domain of is evaluated and the system of. (2)(3) numerically solved through the minimization of a suitable cost function in order to retrieve the following low order expansion of the unknowns
1 = s I D
∑
= = Ω = (1) 1 ) 1 ( ) ( ) ( ) ( N n n i n v tot v tot E E r r r (6)∑
= = Ω = (1) 1 ) 1 ( ) ( ) ( ) ( N n n i n r r r τ τ (7)where indicates the rectangular basis function in the n-th discretization cell. Ωn(r)
Stage 4 – Cost function minimization (s=2,..,Sopt). Further optimization stages of the unknown
parameters are carried out, adaptively improving the resolution in the Regions of Interest (RoIs) where the objects have been detected (Stage 6) exploiting the clustering procedure detailed in [14].
ELEDIALab: DIT-PRJ-07-062 - Rapporto Tecnico N .10 page 7/13 Accordingly, a multi-resolution (r indicating the resolution level) discretization grid is obtained and the following multi-resolution cost function is defined
( )
( )
( )
( ) ( ) ( ) ( )( )
( ) ( ) ( )( )
( )
( ) ( ) ( ) ( )( )
( ) ( )∑ ∑
∑ ∑
∑∑ ∑
∑∑ ∑
= = = = = = = = = = − − + − = Φ V v v M v m v m v tot V v M v m v m v v m v tot V v s r r N r n r n v V v s r r N r n r n v r n v PD IMSA E E v 1 1 2 1 1 2 1 1 1 2 1 1 1 2 r r r r r r ξ ς ζ ς (8) in which ( ) ( ){
( )( )[
( ) ( ) ( ) ( )]
}
( ) ( )∑ ∑
− = = + = 1 0 1 ) / ( ) ( ) ( ) ( ) ( s t t N t q t q v m t q v tot t q s t q v m v inc v m v G E E r r r r r r ω τ ξ (9) ( ) ( ){
( )( )[
( ) ( ) ( ) ( )]
}
( ) ( )∑ ∑
− = = − = 1 0 1 ) / ( ) ( ) ( ) ( ) ( s t t N t q t q r n t q v tot t q s t q r n v tot r n v G E E r r r r r r ω τ ζ (10)where the weighting function can assume 0 or 1 value [13]. In order to completely exploit all the achieved information about the distribution of the object function, each intermediate reconstruction is used as initial solution of the successive higher-resolution minimization process.
( ) ( )s
t q
ω
However, the cost function (6) is still highly non-linear and suffers of local minima problem. Therefore its minimization is carried out integrating in the IMSA the Particle Swarm Optimiser (for a detailed description see [15-17]), a recent evolutionary technique based on the observation of the movement of swarms of insects.
Stage 5 – Termination procedure. Finally, the multi-resolution procedure is iterated until a
stationary condition based on qualitative reconstruction parameters is reached [13, 14].
4 NUMERICAL
AND
EXPERIMENTAL
VALIDATION
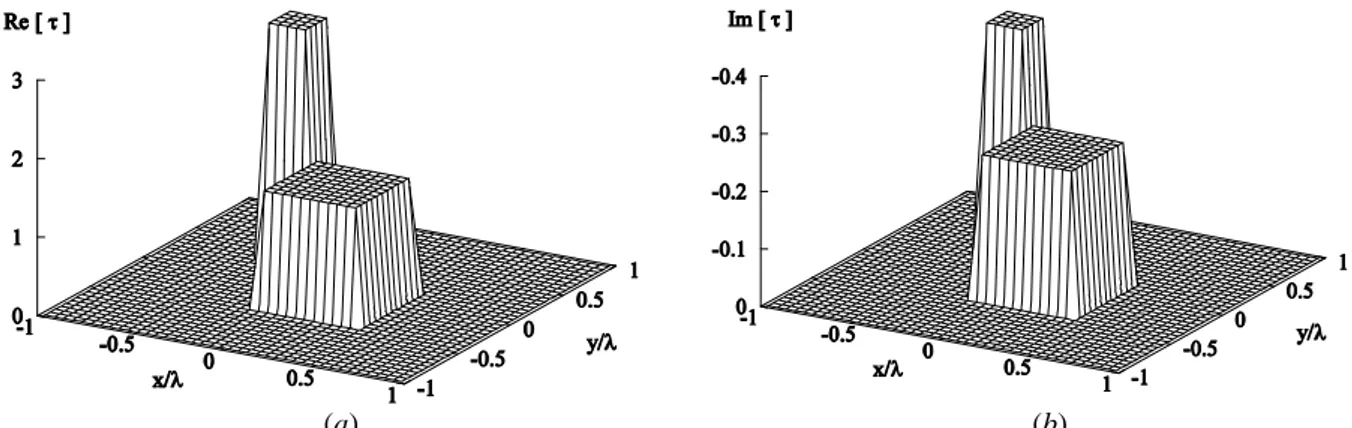
In this section, some selected results obtained during the numerical and experimental testing are presented in order to assess the reconstruction accuracy of the proposed two-step strategy. The retrieved profiles will be pictorially shown in terms of distribution of the object function and quantitatively comparing such a distribution with the actual ones exploiting the error figures defined in [13]. 4 1 = λ obj L 2 2 = λ obj L The first considered test case is composed by two square cylindrical objects , sided and centered in
8 3 1 =− λ obj x 8 3 1 = λ obj y 8 2 = λ obj x 8 2 =−λ obj y
, and , , respectively. The
dielectric properties are and (Fig. 2 shows the reference
distribution). 4 . 0 0 . 3 1 j obj = − τ τobj2 =1.5− j0.25
ELEDIALab: DIT-PRJ-07-062 - Rapporto Tecnico N .10 page 8/13 (a) (b)
Fig. 2. Actual configuration of the numerical test case: (a) real and (b) imaginary part of the contrast function
The scatterers belong to a square investigation domain of side LI =2λ and they are illuminated by plane waves impinging from V=32 equally-spaced directions (
(
)
V v
v =2π −1
θ , v=1,...,V ). The
circular observation domain RM =5λ in radius and the scattering data are computed in , v=1,...,V, measurement points equally-distributed along
32
) (v =
M
M
D . As far as the PSO-based method for the "retrieval process" is concerned, the following configuration of parameters has been adopted according to the guidelines in the related literature [15, 16] and to the heuristic study carried out in
[14]: I U 100 5 = 4 . 0 =
ω (constant inertial weight), (swarm dimension, U being the number of problem unknowns), and (acceleration coefficients). Moreover, the IMSA has been used with the parameters setting defined in [14].
0 . 2 2 1 = C = C
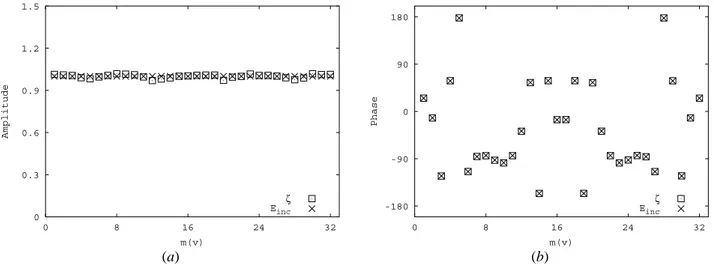
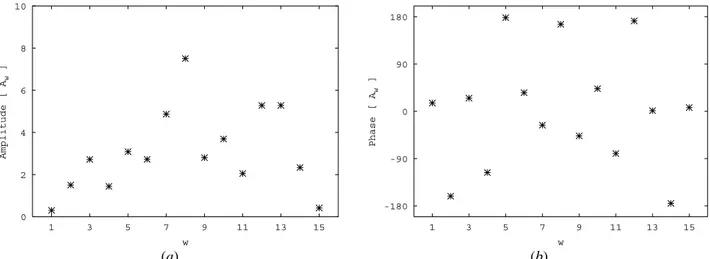
After solving the "source-synthesis" step described in Section 3, the array coefficients turned out to be distributed as shown in Fig. 3. Such a configuration can be considered optimal in terms of the matching with the problem data as proved by the fitting between "measured" and estimated values shown in Fig. 4 for the amplitudes and phases of the radiated-fields in DM when v=1. Accurate reconstructions are also obtained for the remaining incidence angles.
0 1 2 3 4 5 1 3 5 7 9 11 13 15 Amplitude [ A w ] w -180 -90 0 90 180 1 3 5 7 9 11 13 15 Phase [ A w ] w (a) (b)
Fig. 3. (a) Amplitude and (b) phase of the optimal configuration of the weighting coefficients for the numerical test
ELEDIALab: DIT-PRJ-07-062 - Rapporto Tecnico N .10 page 9/13 0 0.3 0.6 0.9 1.2 1.5 0 8 16 24 32 Amplitude m(v) ζ Einc 0 180 -180 -90 90 0 8 16 24 32 Phase m(v) ζ Einc (a) (b)
Fig. 4. (a) Amplitude and (b) phase matching between synthesized and measured values of the incident field inDM.
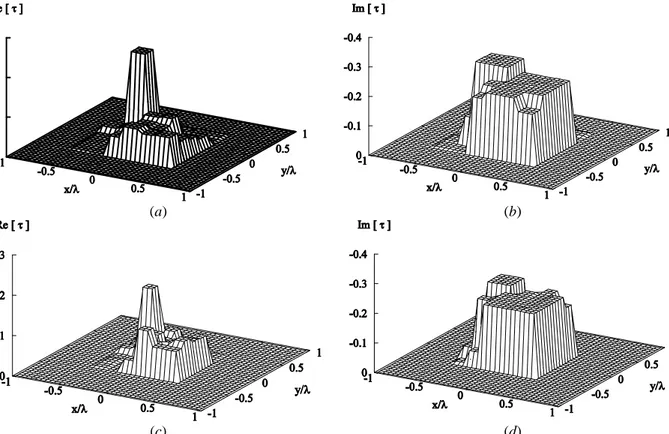
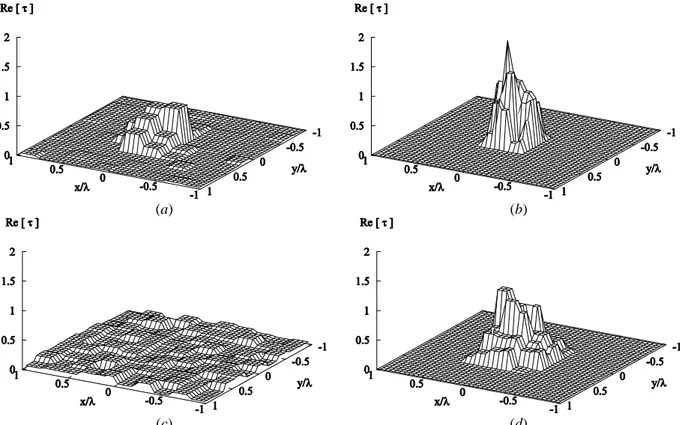
After tuning the model of the source in order to compute the incident field in whatever position of the investigation area, the reconstruction of object function has been carried out exploiting the iterative multi-scaling approach. For comparison purposes, the profiles estimated with the Phaseless Data [PD Fig. 5(a)(b)] and Full Data [FD Fig. 5(c)(d)] approach are reported. Even though the lack
of the phase information reduces the quality of the reconstructed profile especially in the real part, we can notice that the result of the inversion process are still satisfactory.
) ( m( v)
v tot
E r
In order to test the robustness of the technique, the data ( , being ) have been blurred by means of an additive Gaussian noise and the error figures have been compared for different values of Signal-to-Noise-Ratio (SNR). The SNR has been varied between 5 dB and 40 dB
and 100 realizations have been averaged for each value for obtaining a statistical evaluation of the reconstruction accuracy. Fig. 6 points out that the methodology presents a satisfactory robustness to the noise especially as far as the localization and the dimensions of the profiles is concerned.
M v
m )∈D
(r ()
In particular, one can observe that the qualitative error figures [Figs. 6(a)(b)] of the PD approach
have similar behaviour of those corresponding to the FD case. However, as expected, this latter overcomes the PD one since it can also exploit the phase information of the measured fields. As far as the reconstruction error is concerned, for the considered experiments, both the PD and the FD obtain γtot <13% [Fig. 6(c)].
The results obtained through the numerical simulations suggest a further assessment of the effectiveness of the algorithm. Toward this aim, the experimental dataset kindly provided by
Institute Fresnel (for details see [18]) has been used. The considered test case, the inhomogeneous
configuration called “FoamDielIntTM”, is characterized by the following parameters:
, Robj m (object radius),
2 1 10 5 . 1 × − = 3 . 0 0 . 2 1 = ± obj τ 2 =0.45±0.15 obj τ , . The target is
located in a square investigation domain of side
m Robj 2 2 10 0 . 4 × − = m LI 1 10 0 . 3 × −
= and V =8 different views and 241
) (v =
M measurement points have been taken into account. Single frequency data ( f =2GHz) have been inverted.
ELEDIALab: DIT-PRJ-07-062 - Rapporto Tecnico N .10 page 10/13 (a) (b)
(c) (d)
Fig. 5. Numerical test case. Reconstruction of the (a)(c) real and (b)(d) imaginary part of the contrast function
from Full Data (a)(b) and Phaseless Data (c)(d).
(a) (b) (c) tot γ Δ ρ
ELEDIALab: DIT-PRJ-07-062 - Rapporto Tecnico N .10 page 11/13 0 2 4 6 8 10 1 3 5 7 9 11 13 15 Amplitude [ A w ] w -180 -90 0 90 180 1 3 5 7 9 11 13 15 Phase [ A w ] w (a) (b)
Fig. 7. (a) Amplitude and (b) phase of the optimal configuration of the weighting coefficients for
the experimental test case.
0 1 2 3 4 5 6 1 41 81 121 161 201 241 Amplitude [x 10] m(v) ζ Einc -180 -90 0 90 180 1 41 81 121 161 201 241 Phase m(v) ζ Einc (a) (b)
Fig. 8. (a) Amplitude and (b) phase matching between synthesized and measured amplitude of the incident field
inDM.
Firstly, let us consider the synthesis of the source. The tuning of the weighting coefficients (Fig. 7) of the DCW model allows to obtain a good agreement between measured and synthesized values of
the phase of the electric incident field as shown in Fig. 8. On the other hand, the reconstruction of the amplitude turns out to be more critical, but it still remain an acceptable approximation to our aims. As a matter of fact the retrieved profile of Fig. 9(d) points out the presence of two different
levels of contrast. The scatterer is satisfactory located and dimensioned though the reconstructed shape is not so accurate. Moreover, the obtained profiles provide an acceptable indication about the dielectric properties of the object under test.
In order to compare the accuracy of the proposed PD technique, the profile retrieved through the Full Data inversion is plotted in Fig. 9(b). Moreover, Figs. 9(a)(c) report the results of the bare-PSO approach ([17]), that is achieved by means of the single resolution PD [Fig. 9(a)] and FD [Fig.
9(c)] strategies. If on one side the IMSA-FD approach allows to improve the reconstruction quality [compare Fig. 9(a) and Fig. 9(b)], on the other side when PD experiments are considered the use of
the IMSA procedure becomes non-negligible to detect the object. As a matter of fact, in this test case the PSO-bare approach, Fig. 9(c), is not able to extract the necessary information from
ELEDIALab: DIT-PRJ-07-062 - Rapporto Tecnico N .10 page 12/13 The values reported in Table 1 indicate that the use of the multi-scaling technique reduces the number of parameters to be retrieved (U). Consequently the mean time per iteration ( ) decreases for the IMSA approach with respect to the standard one and therefore the total computational time required ( ) is reduced even though the total number of iterations of the minimization ( ) procedure increases. Moreover, as expected, the computational load of the algorithms considering PD or FD does not significantly vary and it is strongly related to the number of employed resolution levels ( ). k T tot C Ktot opt S (a) (b) (c) (d)
Fig. 9. “FoamDielIntTM” configuration: Real part of the contrast function reconstructed through (a)(b) Full
Data and (c)(d) Phaseless Data using (a)(c) bare-PSO and (b)(d) IMSA-PSO.
opt S tot K Tk [s] Ctot [s] U IMSA-PSO FD 324 8000 4 2 10 8 . 5 × − 4.7×10² IMSA-PSO PD 324 6000 3 2 10 3 . 6 × − 3.8×10² PSO FD 900 2000 - 1 10 8 . 1 × − 7.4×10² PSO PD 900 2000 - 1 10 0 . 2 × − 8.0×10²
ELEDIALab: DIT-PRJ-07-062 - Rapporto Tecnico N .10 page 13/13
5 CONCLUSIONS
In this contribution, a two-step strategy for reconstructing unknown targets from phaseless data has been analyzed considering both synthetic and experimental data in order to quantify the decrease of accuracy of the PD approach with respect to the FD case. The results point out the effectiveness of the approach and the feasibility of the direct inversion of amplitude-only data without the need of expensive post processing of the data or phase retrieval algorithms. Moreover, the DCW-Model
allows us to avoid the collection of the incident field sample in a dense grid of points in the investigation domain.
6 REFERENCES
[1] Bindu, G., S. J. Abraham, A. Lonappan, V. Thomas, C. K. Aanandan, and K. T. Mathew, “Active microwave imaging for breast cancer detection,” Progress In Electromagnetics Research, PIER 58, 149–169, 2006. [2] Guo, B., Y. Wang, J. Li, P. Stoica, and R. Wu, “Microwave imaging via adaptive beamforming methods for
breast cancer detection,” Journal of Electromagnetic Waves and Applications, Vol. 20, 53–63, 2006.
[3] Salman, A. O., S. Gavrilov, and A. Vertiy, “Subsurface microwave imaging by using angular spectrum of electromagnetic field,” Journal of Electromagnetic Waves and Applications, Vol. 16, 1511–1529, 2002. [4] Bucci, O. M. and Franceschetti, G., “On the degrees of freedom of scattered fields,” IEEE Trans. Antennas
Propagat., vol. 37, 918-926, 1989.
[5] Bucci O. M. and Isernia, T., “Electromagnetic inverse scattering: retrievable information and measurements strategies,” Radio Sci., vol. 32, 2123-2138, 1997.
[6] Wolf, E., “Determination of the amplitude and the phase of the scattered fields by holography,”. J. Opt. Soc. Am. A, vol. 60, 18-20, 1970.
[7] Faris, G. W. and Hertz, H. M., “Tunable differential interferometer for optical tomography,” Appl. Opt., vol. 28, 4662-4667, 1989.
[8] Caorsi, S., Massa, A., Pastorino, M., and Randazzo, A., “Electromagnetic detection of dielectric scatterers using phaseless synthetic and real data and the memetic algorithm,” IEEE Trans. Geosci. Remote Sensing, vol. 41, 2745-2753, 2003.
[9] Takenaka, T., Wall, D. J. N., Harada, H., and Tanaka, M., “Reconstruction algorithm of the refractive index of a cylindrical object from the intensity measurements of the total field,” Microwave Optical Technol. Lett., vol. 14, 182-188, 1997.
[10] Maleki, M. H., Devaney, A. J., and Schatzberg, A., “Phase retrieval and intensity-only reconstruction algorithms from optical diffraction tomography,” J. Opt. Soc. Am. A, vol. 10, 1086-1092, 1993.
[11] Crocco, L., D’Urso, M., and Isernia, T., “Inverse scattering from phaseless measurements of the total field on a closet curve,” J. Opt. Soc. Am. A, vol. 21, 622-630, 2004.
[12] Franceschini G., Donelli, M., Azaro, R., and Massa, A., “Inversion of phaseless total field data using a two-step strategy based on the iterative multiscaling approach,” IEEE Trans. Geosci. Remote Sensing, vol. 44, 3527-3539, 2006.
[13] Caorsi, S., Donelli, M., and Massa, A., “Detection, location, and imaging of multiple scatterers by means of the iterative multiscaling method,” IEEE Trans. on Microwave Theory Tech., vol. 52, 1217-1228, 2004. [14] Caorsi, S., Donelli, M., Franceschini, D., and Massa, A., “A new methodology based on an iterative
multiscaling for microwave imaging,” IEEE Trans. on Microwave Theory Tech., vol. 51, 1162-1173, 2003. [15] Robinson, J. and Rahmat-Samii, Y., “Particle swarm optimization in electromagnetics,” IEEE Trans. on
Antennas Propagat., vol. 52, 771-778, 2004.
[16] Kennedy, J., Eberhart, R. C., Shi, Y., Swarm Intelligence, Morgan Kaufmann Publishers, San Francisco, 2001. [17] Donelli, M. and Massa, A., “Computational approach based on a particle swarm optimizer for microwave
imaging of two-dimensional dielectric scatterers,” IEEE Trans. on Microwave Theory Tech., vol. 53, 1761-1776, 2005.
[18] Belkebir, K. and Saillard, M., “Special issue on Testing inversion algorithms against experimental data: inhomogeneous targets,” Inverse Problems, vol. 21, 1-3, 2005.