On-Going Frontal Alpha Rhythms Are
Dominant in Passive State and
Desynchronize in Active State in Adult Gray
Mouse Lemurs
Francesco Infarinato1☯, Anisur Rahman2, Claudio Del Percio3☯, Yves Lamberty4, Regis Bordet5, Jill C. Richardson6, Gianluigi Forloni7, Wilhelmus Drinkenburg8,
Susanna Lopez9, Fabienne Aujard2, Claudio Babiloni1,9*, Fabien Pifferi2, IMI project "PharmaCog" Consortium
1 IRCCS San Raffaele Pisana, Rome, Italy, 2 UMR 7179 Centre National de la Recherche Scientifique, Muséum National d'Histoire Naturelle, Brunoy, France, 3 IRCCS SDN, Naples, Italy, 4 UCB Pharma s.a., Neuroscience Therapeutic Area, Braine l'Alleud, Belgium, 5 L'Université Lille 2 Droit et Santé, Lille, France, 6 Neurosciences Therapeutic Area Unit, GlaxoSmithKline R&D, Gunnels Wood Road, Stevenage, United Kingdom, 7 Department of Neurodegeneration, Mario Negri Institute, Milan, Italy, 8 Janssen Research & Development, Turnhoutsewe, Beerse, Belgium, 9 Department of Physiology and Pharmacology, University of Rome "La Sapienza", Rome, Italy
☯ These authors contributed equally to this work.
¶ Membership of IMI project "PharmaCog" Consortium is provided in the Acknowledgments section and the complete list could be found onwww.pharmacog.org.
Abstract
The gray mouse lemur (Microcebus murinus) is considered a useful primate model for translational research. In the framework of IMI PharmaCog project (Grant Agreement n° 115009,www.pharmacog.org), we tested the hypothesis that spectral electroencephalo-graphic (EEG) markers of motor and locomotor activity in gray mouse lemurs reflect typical movement-related desynchronization of alpha rhythms (about 8–12 Hz) in humans. To this aim, EEG (bipolar electrodes in frontal cortex) and electromyographic (EMG; bipolar elec-trodes sutured in neck muscles) data were recorded in 13 male adult (about 3 years) lemurs. Artifact-free EEG segments during active state (gross movements, exploratory movements or locomotor activity) and awake passive state (no sleep) were selected on the basis of instrumental measures of animal behavior, and were used as an input for EEG power density analysis. Results showed a clear peak of EEG power density at alpha range (7–9 Hz) during passive state. During active state, there was a reduction in alpha power density (8–12 Hz) and an increase of power density at slow frequencies (1–4 Hz). Relative EMG activity was related to EEG power density at 2–4 Hz (positive correlation) and at 8–12 Hz (negative correlation). These results suggest for the first time that the primate gray mouse lemurs and humans may share basic neurophysiologic mechanisms of synchroniza-tion of frontal alpha rhythms in awake passive state and their desynchronizasynchroniza-tion during motor and locomotor activity. These EEG markers may be an ideal experimental model for OPEN ACCESS
Citation: Infarinato F, Rahman A, Del Percio C, Lamberty Y, Bordet R, Richardson JC, et al. (2015) On-Going Frontal Alpha Rhythms Are Dominant in Passive State and Desynchronize in Active State in Adult Gray Mouse Lemurs. PLoS ONE 10(11): e0143719. doi:10.1371/journal.pone.0143719 Editor: Daniele Marinazzo, Universiteit Gent, BELGIUM
Received: April 3, 2015 Accepted: November 9, 2015 Published: November 30, 2015
Copyright: © 2015 Infarinato et al. This is an open access article distributed under the terms of the Creative Commons Attribution License, which permits unrestricted use, distribution, and reproduction in any medium, provided the original author and source are credited.
Data Availability Statement: Data underlying the study are owned by the PharmaCog Project and not owned by a single author of this study. Interested researchers may submit request for data to the Coordinators of the PharmaCog project, namely Dr. Jill Richardson (Neurosciences Therapeutic Area Unit, GlaxoSmithKline R&D, United Kingdom;Jill.C. [email protected]) and Prof. Regis Bordet (University of Lille 2, France;regis.bordet@univ-lille2. fr). Interested researchers may obtain the data in the same way the authors did, i.e. after a careful
translational basic (motor science) and applied (pharmacological and non-pharmacological interventions) research in Neurophysiology.
Introduction
Gray mouse lemur (Microcebus murinus) is a nocturnal prosimian primate originating from Madagascar, which shares some genetic, physiological, and neuroanatomical similarities with humans. Marked biological rhythms have been extensively studied in the captive colony of mouse lemurs at CNRS/MNHN in Brunoy [1,2,3]. Its longevity (life expectancy of about 8 years) is ideal to carry out longitudinal studies on the effects of aging [4,5]. Behavioral activity decreases at about 5 years of age [6,7], in a framework of a global decline of executive func-tions, memory, and daily locomotor activity. Furthermore, cerebral atrophy was observed in both physiological and pathological aging [8]. Moreover, Aβ1–42 immuno-positive plaques, which are one of the pathophysiological hallmarks of Alzheimer's disease (AD), were found in the brain of some lemurs as early as 4 years of age [9]. Mouse lemur has, therefore, been pro-posed as one of the most interesting animal models for the translational study of AD in non-human primates [4]. It is expected that this animal model will provide effective biomarkers to monitor brain functions and neurodegenerative processes with aging. Furthermore, these bio-markers may be useful for preclinical investigations on the efficacy of new drugs for patients with neurodegenerative diseases [4,5,8].
Several neuroimaging methods allow the translational exploration of brain functions across species including mouse lemurs. Optical fluorescence imaging monitors biological functions of specific targets in small animals, but the intrinsic fluorescence of biomolecules poses some methodological problems [10,11]. Task-independent functional brain neuroimaging by mag-netic resonance imaging (MRI) allows examination of the intrinsic networks within the brain not only in humans but also in awake animals [12,13,14]. These networks can be defined as functionally and (often) structurally connected populations of neurons whose properties reflect fundamental neurobiological organizational principles of the central nervous system [14]. Neu-roimaging techniques have considerable merits but a remarkable limitation for the study of brain function in animal models. They require that animals be constrained in limited spaces and unusual conditions of housing during the exam [12,13,14]. This methodological limitation does not apply to electroencephalographic (EEG) recordings. These recordings can be performed in freely behaving animals for extended periods of time, thus allowing the mea-surement of brain activity in the rest and activity phases of the wake-sleep cycle [2,15,16]. Among EEG techniques, those using telemetric wireless devices represent a very attractive methodology, in order to reduce the stress in the animal and make fully free its movements in the cage [16]. For this reason, EEG research may play a fundamental role in the study of char-acteristic biomarkers in wild-type and transgenic animal models of several diseases in the framework of a genuine back-translation model of research [17,18,19].
As another significant merit, EEG recording can probe the so-called synchronization and desynchronization of brain neural activity across wake-sleep cycles, as a function of pharmaco-logical and non-pharmacopharmaco-logical interventions [19,20]. The synchronous oscillating activity of brain neural networks or its desynchronization result from the interaction among many neu-rons by their functional connectivity [21,22]. Such synchronization and desynchronization of brain neural activity couple or decouple neuronal populations in several parallel cortical and sub-cortical networks. This neurophysiological mechanism generates and modulates the evaluation of the ethical and scientific background of
all requests by the PharmaCog Steering Committee. Funding: The activity leading to the present study has received funding from the Seventh Framework Programme of European Community (FP7/2007-2013) for the Innovative Medicine Initiative under Grant Agreement No. 115009 (www.pharmacog.org) (title of the project:“Prediction of cognitive properties of new drug candidates for neurodegenerative diseases in early clinical development”; acronym: PharmaCog). The funders had no role in study design, data collection and analysis, decision to publish, or preparation of the manuscript. Competing Interests: None of the authors has conflicts of interest or financial disclosures in the development of the present precompetitive basic neurophysiological research, which was based on EEG recordings in freely behaving mouse lemurs receiving no (pharmacological or
non-pharmacological) intervention. This is true also for the following co-Authors: Dr. Yves Lamberty, Jill Richardson and Wilhelmus Drinkenburg, who are affiliated to UCB Pharma, Glaxo SmithKline and Janssen Pharmaceutica, respectively. Their position to the mentioned companies does not alter the authors' adherence to the PLOS ONE policies on sharing data and materials.
so-called cortical EEG rhythms, and is considered as an important neural substrate of vigilance, spatial orientation, consciousness, and planning of the behavior [23,24,25].
Are cortical EEG rhythms a useful translational model of the mentioned neurophysiological mechanisms in human and sub-human primates? In humans, resting state eyes-closed EEG oscillations at 8–12 Hz are dominant in posterior sensory (i.e. 8–10 Hz, alpha rhythms) and frontal motor areas (i.e. 10–12 Hz, Rolandic alpha or mu rhythms), as a reflection of cortical inhibition and behavioral quiet wakefulness [26]. Alpha rhythms are generated by a complex pattern of parallel cortico-cortical and cortical-subcortical (thalamic)-cortical neural networks [26]. These networks regulate the fluctuation of cortical arousal, tonic alertness, and muscle relaxation [26]. When an individual is engaged in some cognitive (i.e. attention, working mem-ory) and sensorimotor events, parietal-frontal alpha rhythms disappear, the so-called de-syn-chronization or blocking of alpha rhythms [26]. These rhythms are replaced by parietal-frontal fast EEG oscillations at frequencies higher than 8–12 Hz such as beta (about 20–30 Hz) and gamma (>30 Hz) [26,27,28,29]. In this vein, parietal-frontal alpha rhythms desynchronized in monkeys during cognitive-motor tasks [30].
In the IMI PharmaCog project (www.pharmacog.org), we have tested the translational value of spectral EEG markers in lemurs towards future translational applications to diseases that are apparent with aging, such as AD. In this framework, the present study tested the hypothesis that EEG rhythms in premotor frontal cortex accompanying motor and locomotor activity in prosimian lemurs showed similarities with respect to those observed in monkeys and humans. Specifically, we predicted ample alpha rhythms in the premotor frontal cortex during relaxed wakefulness (i.e. passive state) and their desynchronization during motor and locomotor activity (i.e. active state). We focused on premotor cortex as it has large domains for ethologically relevant movements such reaching, grasping, defensive, and other complex move-ment patterns in primates [31]. This function depends on the abundant signals coming from prefrontal cortex, which allows the coupling of information processing on cognitive (i.e. plans, environmental stimuli) and motor events [31,32]. Its cognitive-motor function is of extreme interest towards future translational studies on aging and cognitive decline. Compared with premotor cortex, the primary motor cortex of primates shows more limited functions in the executive generation of voluntary hand and digit movements on objects and intra-personal body parts [31]. This function depends on the abundant signals coming from the motor thala-mus, which receives signals from the cerebellum and basal ganglia [31]. In the present study, on-going EEG rhythms were recorded from premotor frontal cortex during passive and active behavioral states. Results confirmed the working hypothesis.
Methods
Animals and surgery for implantation of telemetric sensors
In the present study, we utilized thirteen male gray mouse lemurs (Microcebus murinus), which were born and raised in the laboratory breeding colony of Brunoy, France (agreement C-91-564). The original stock come more than 40 years ago from the southwest coast of Mada-gascar. All animals were disease free. The general conditions of captivity were maintained with respect to ambient temperature (25°C) and relative humidity (55%) during all the experiments. Individual cages (40cm x 40cm x 35cm) were provided with wooden nest box (at least two per animal) and fresh laurel branches for the whole duration of the experiment. The lemurs were adult (mean age 3.2 years ±0.5 standard error, SE), cognitively intact, and underwent no drug manipulation, sleep deprivation or other challenges or interventions before or in the period of the present EEG recordings.
All experiments were performed in accordance with the“Principles of Laboratory Animal Care” (National Institutes of Health publication 86–23, revised 1985) and the European Com-munities Council Directive (86/609/EEC). The research was conducted under the authoriza-tion number 91–305 from the ‘‘Direcauthoriza-tion Départementale de la Protecauthoriza-tion des Populaauthoriza-tions”. The experimental protocol was approved by the Cuvier Ethics Committee under the agreement number 068–018. Noteworthy, this protocol was specific for the study reported in this paper (EEG recordings in gray mouse lemurs were performed in the context of the IMI European project entitled“Pharmacog”). In accordance with international guidelines, particular attention was paid to the welfare of the animals during this work to minimize nociception (Weatherall FRS D. 2006.“The use of non-human primates in research. The Weatherall report”). No ani-mal was sacrificed for the purpose of this study.
Surgeries were performed by the UMR CNRS-MNHN staff under the supervision of Dr. Fabienne Aujard (PhD, Veterinarian with the authorization to experiment in live animals number C-91-564 delivered by the French“Direction Départementale de la Protection des Populations de l'Essonne”). Experiments were conducted in an official experimental facility under the agreement number D-91.114.1 delivered by the French“Direction Départementale de la Protection des Populations de l'Essonne”.
Experimental plan of the present experiments included the use of a wireless telemetry sys-tem to collect physiological data such as EEG, electromyographic (EMG), sys-temperature, and locomotor activity (Data Science International, St. Paul, MN, USA). To do so, a small transmit-ter with a volume of 1.9 cc and weighing 3.9 g (model PhysioTel F20-EET, DataScience Co. Ltd, Minnesota, USA) was implanted into the peritoneal cavity of the lemurs under a ketamine anaesthesia (Imalgene, 100 mg/kg intraperitoneal) empowered by administration of Metacam (meloxicam, 0.2 mg/kg).
Silicone elastomer insulated stainless-steel electrode wires (Ø 0.3 mm) were then subcutane-ously led, passing between the scapula, from the abdomen to the skull, and there sealed using dental cement.
The EEG implanted electrodes were located in premotor cortex (Brodmann area 6, BA 6) in the anterior position of 7.00 mm according to the transversal section, which corresponded to the plate 34 of the "Stereotaxic atlas of the brain grey mouse lemur" [33]. Electrode referencing was done by bipolar subtraction using Data Science International implantable bipolar elec-trodes. The separation between the bipolar electrodes was of 5 mm (±1 mm). No further implanted reference or ground electrode was used to minimize the impact of the surgery on brain function.
After surgery, the lemurs returned to their individual cage. They were allowed to recover for 15 days from the beginning of the EEG experiments. The week after the surgery, nociception was minimized by subcutaneous daily injection of painkiller and anti-inflammatory drug (i.e. Metacam) under the control and supervision of an expert scientist and veterinarian (Dr. Fabi-enne Aujard, Ph.D.). Before the beginning of the experiment, animals were raised on fresh fruit and a mixture of cereals, milk and egg prepared daily in the breeding facility of UMR
CNRS-MNHN 7179 (Brunoy, France). Water and food were given ad libitum.
Few days before the planned experiments, the candidate animals were provided with a wooden nest box and laurel branches for the enrichment of their environment in the individual cages above mentioned. As an important aspect of the experimental procedures, health status and general behavior of the candidate lemurs were examined to decide if they could be admit-ted to electrophysiological recordings after the surgery. The examination strictly followed the ARRIVE guidelines (i.e.“Animal Research: Reporting of In Vivo Experiments”;https://www. nc3rs.org.uk/arrive-guidelines). First, Dr. Fabienne Aujard carefully checked the complete healing of the surgical incisions. Second, the recovery of body temperature, body weight, and
locomotor activity (recorded by automated telemetric system placed in the home cage of the animal) were verified in the 3 days preceding the electrophysiological experiments with respect to pre-surgery period. The animals were admitted to the electrophysiological recordings if they showed no loss of 2 g/day and no substantial decrease in locomotor activity (i.e. 50% or more) and temperature during these days. All animals were admitted to the electrophysiological recordings.
Physiological data recording and analysis
During the present experiments, the lemurs were housed in their individual cages provided with branches and a wooden nest in which temperature and humidity were controlled and maintained constant (ambient temperature = 24–26°C, relative humidity = 55%). Food and water were available ad libitum (availability of food and water was kept constant according to the general conditions of captivity in the colony; [2]. Normal circadian rhythms were artifi-cially set as follows: 14 h lights on and 10 h lights off.
Electrophysiological and behavioral data were acquired by telemetry during 5 consecutive days (Dataquest Lab Pro v. 3.0; Data Science International, St. Paul, MN, USA). The data for the present study were taken from the first experimental day.
EEG and EMG signals were acquired and exported by Neuroscore software v. 2.1 (Data Sci-ences International, St. Paul, MN, USA). As mentioned above, the EEG recording was per-formed from one EEG bipolar channel located in the premotor frontal cortex (500 Hz sampling rate; 1–100 Hz bandpass). The EMG signals were collected from one EMG channel using bipolar electrodes sutured to the neck muscles with non-absorbable polyamide suture (500 Hz sampling rate; 1–100 Hz bandpass). The temperature was also recorded (250 Hz sam-pling rate, range 34–41°C) using a thermistor integral to the electronics module inside the implanted transmitter. Locomotor activity was indexed by the variation of electromagnetic sig-nal strength, recorded on a dedicated channel of the telemetry system (1 Hz sampling rate).
Electrophysiological recordings were performed for 1 wake-sleep cycle. As mentioned above, this cycle was divided into 14 h of daytime (It was the rest phase as lemurs are nocturnal animals) and 10 h of nighttime (The stage of most animal activities). Data analysis focused on a recording segment of 1 h during nighttime, namely the light-off period. It also focused on a recording segment of 1 h during the daytime, namely the light-on period. These 1-h recording segments were taken starting from 1 h after the light-off/on instant. This instant switched from daytime to nighttime and vice versa. The recording segments started 1 h after this instant to minimize the effects of stress due to the changes of environmental lightening. In these record-ing segments, behavioral and EEG data were analyzed to identify the first 2–5 min of artifact-free EEG data in the passive behavioral state and the first 2–5 min of artifact-artifact-free EEG data in the active behavioral state. The general procedure of this preliminary analysis is described in the following paragraphs.
Continuous EEG recordings were segmented into contiguous periods of 10 s for the analysis of animal behavior. Any period of 10 s was rated based on the prevalent behavior of the animal (“behavioral periods”). The classification of the behavioral periods was performed in two steps. In the first step, these periods were automatically classified by expert experimenters of Brunoy group (Dr. Anisur Rahman, Ph.D., or Dr. Fabien Pifferi, Ph.D.) using Neuroscore software v. 2.1 (Data Sciences International, St. Paul, MN, USA). This software classified the periods into mutually exclusive behavioral states such as active wake (i.e. active state) and passive wake (i.e. passive state) of interest for the present study and other states. The classification of Neuro-score software was based on the collected EEG, EMG, temperature, and locomotion variables (Brunoy group used this procedure successfully in previous studies [2,34]). In the second step
of the procedure, the results of such automatic classification were revised by Dr. Rahman and Dr. Pifferi, based on the visual inspection of the EMG activity, temperature, and locomotion data. They did not take into account the EEG data to avoid the risk of circular reasoning. Indeed, they could have unconsciously biased their judgments to confirm the experimental hypothesis of a reduction in amplitude of alpha rhythms during active compared to passive state. For example, they could have denoted as“awake passive state” the periods characterized by a high amplitude of on-going alpha rhythms. On the contrary, they could have denoted as “active passive state” the periods characterized by a low amplitude of on-going alpha rhythms. As a consequence, this circular reasoning would have determined the confirmation of the working hypothesis of the present study. The main scope of this action was to check that lemur was not sleeping in the periods classified as“passive state”, and was effectively active in the periods classified as“active state”. As a methodological remark, the experimenter always dis-carded periods framed in long time windows (minutes) of continuous permanence in the pas-sive behavioral state (risk of drowsiness or initial sleep). Optimal periods of“passive state” were those in which the animal intermingled few periods of 10 s of passive state with periods of overt behavioral activity. The mean lengthiness of the data of continuous quiet wakefulness that were used to extract the behavioral periods of passive state was 25.1 s (±7.7 standard error, SE) in the daytime and 26.8 s (±6.2 s SE) in the nighttime. On average across the animal group, the amount of the behavioral periods of interest was 12.8 (±4.1 SE) for the passive state during the daytime, 13.8 (±6.3 SE) for the passive state during the nighttime, 71.9 (±18.6 SE) for the active state during the daytime, and 164.5 (±17.5 SE) for the active state during the nighttime. All lemurs showed sufficient periods of active state during the daytime and nighttime (i.e. an arbitrary amount of more than 10 periods). Furthermore, 11 out of 13 lemurs showed sufficient periods of the passive state during the daytime (i.e. all except that L#4 and L#10). Finally, 6 out of 13 lemurs showed sufficient periods of the passive state during the nighttime (i.e. discarded lemurs were named L#1, L#2, L#3, L#4, L#11, L#12, and L#13).
Any behavioral period of 10 s was segmented into 5 single contiguous epochs lasting 2 s for the preliminary analysis of artifacts in the EEG signal. Of note, the fragmentation of any behav-ioral period into contiguous EEG epochs of 2 s allowed minimizing the amount of EEG signals rejected for artifacts. Without this fragmentation, the presence of an artifact of 3–4 s in a single behavioral period of 10 s would have caused the rejection of a whole period of 10 s of EEG signal.
The analysis of artifacts in the EEG epochs showed the following findings at the group level. There was no EEG epoch with artifacts in the passive state during the daytime. Whereas, the percentage of EEG epochs with artifacts was 2.6% (±1.3% SE) for the passive state during the nighttime. Furthermore, the percentage of EEG epochs with artifacts was 1.1% (±0.7% SE) for the active state during the daytime and 7.3% (±3.1% SE) for the active state during the night-time. Accordingly, for the passive state the amount of artifact-free EEG epochs was on average 75.5 (±22.3 SE) and 143.5 (±49.2 SE) during the daytime and nighttime, respectively. For the active state, the amount of artifact-free EEG epochs was on average 354.8 (±99.1 SE) and 769.0 (±83.5 SE) during the daytime and nighttime, respectively.Table 1reports the mean (± SE) percentage and the amount of EEG epochs with and without artifacts for behavioral states and the times of interest. The EEG epochs with artifacts were rejected while those without artifacts were used for further data analysis.
A control statistical analysis was performed to compare the amount of artifact-free EEG epochs between the passive and active states in the daytime and nighttime (Student t-test, p<0.05 two-tailed). The results showed a higher amount of artifact-free EEG epochs in the active state compared to the passive state in both daytimes (t = 2.99, p<0.01) and nighttime (t = 3.13, p<0.05).
EEG power spectrum analysis of the artifact-free EEG epochs was performed by a standard (Matlab; MathWorks, Natick, MA, USA) FFT algorithm using Welch technique and Hanning windowing function (no phase shift) with 1 Hz frequency resolution. A normalization of the EEG data was obtained by dividing the EEG power density at each frequency bin with respect to the EEG power density averaged across all frequencies from 0 to 100 Hz (excluding power density peak due to the utility frequency line frequency at 50 Hz). After such normalization, the solutions lost the original physical dimension. They were represented by an arbitrary unit scale in which "1" means absolute power density equal to the average of absolute EEG power density from 0 to 100 Hz while "2" means the double of that mean etc.
At this early stage of research, narrow EEG frequency bands with shared frequency bins were used to avoid any a priori hypothesis about EEG banding. These bands were the following: 1–2 Hz, 2–4 Hz, 4–6 Hz, 6–8 Hz, 8–10 Hz, 10–12 Hz, 12–20 Hz, and 20–30 Hz. Sharing of a frequency bin by two contiguous frequency bands has the theoretical advantage that one cannot assume that these frequency bands reflect distinct underlying neurophysiological mechanisms [26,35,36].
EMG data of artifact-free EEG epochs were rectified using a proprietary home-made routine written with MatLab programming language (MathWorks, Natick, MA, USA) [37]. The mean rectified EMG was used as an index of muscular activity for the correlation with spectral EEG markers.
Analysis of lemurs' behavioral states
An important step of the data analysis was the classification of animal behavioral state during the EEG periods of interest (see previous section) in terms of active state vs. awake passive state. To this purpose, we used instrumental markers of movement and EMG activity. Neuro-Score software (Data Science International, St. Paul, MN, USA) was used to classify periods lasting 10 s each into the following behavioral classes:
1. ACTIVE STATE. Overt exploratory movements.
2. AWAKE PASSIVE STATE. Immobility or small movements but absolutely no sleep. To be sure that the animal was not sleeping, experimenter classified as“awake passive state” a 10 s period in which the animal was mostly in a passive behavioral state and he/she was reasonably sure that the animal was not sleeping. To this aim, experimenter always discarded long peri-ods (minutes) of behavioral passive state. And the preference was for periperi-ods in which the ani-mal intermingled periods of 10 s of passive state with periods of overt behavioral activity.
Statistical analysis
Statistical comparisons were performed in the following statistical sessions.
In the first statistical session, we tested the main hypothesis of a desynchronization of alpha rhythms (8–12 Hz) in the active state compared to the passive state (during both daytime and Table 1. Mean (± standard error, SE) percentage and the amount of electroencephalographic (EEG) epochs with and without artifacts in the active and passive behavioral states. These values refer to the daytime and nighttime periods of interest.
Daytime Nighttime
Mean of artefact-free epochs (±SE)
Mean of rejected epochs (±SE) Ratio of rejected/ artefact-free epochs (%;±SE) Mean of artefact-free epochs (±SE)
Mean of rejected epochs (±SE) Ratio of rejected/ artefact-free epochs (%;±SE) Active 354.8 (±99.1) 4.5 (±3.6) 1.1% (±0.7%) 769.0 (±83.5) 53.6 (±21.2) 7.3% (±3.1%) Passive 75.5 (±22.3) 0.0 (±0.0) 0.0% (±0.0%) 143.5 (±49.2) 6.5 (±3.4) 2.6% (±1.3%) doi:10.1371/journal.pone.0143719.t001
nighttime), as a translational oscillatory EEG marker of motor and locomotor activity. To this aim, two analyses of variance (ANOVAs) were performed, one for the daytime (N = 11 lemurs having sufficient EEG-EMG epochs in daytime and nighttime), the other for the nighttime (N = 6 lemurs having sufficient EEG-EMG epochs both in active and passive states). The nor-malized EEG power density was used as a dependent variable. The ANOVA factors were Con-dition (passive, active; independent variable) and Band (1–2 Hz, 2–4 Hz, 4–6 Hz, 6–8 Hz, 8–10 Hz, 10–12 Hz, 12–20 Hz, and 20–30 Hz). Mauchly's test evaluated the sphericity assumption when necessary. Correction of the degrees of freedom was made by Greenhouse–Geisser proce-dure. Duncan's test was used for post hoc comparisons (p<0.05 one-tailed). For each ANOVA, the working hypothesis would be confirmed by the following two statistical results: (i) an ANOVA interaction effect including the factor Condition (p<0.05); (ii) a post hoc test indicat-ing that normalized EEG power density in the alpha range (8–12 Hz) was lower in active than in passive state (Duncan test, p<0.05 one-tailed).
As the number of EEG epochs was higher in the active compared to the passive state, a con-trol analysis was performed to pair this variable. The number of EEG epochs in the active state was sub-sampled not to differ statistically from that of the passive state both in daytime (p>0.8) and nighttime data (p>0.2). Two ANOVAs were performed with the same features described in the previous paragraph.
In the main statistical analysis, contiguous EEG frequency bands shared a frequency bin. This methodological option was based on the assumption that contiguous frequency bands might not reflect distinct underlying neurophysiological mechanisms. However, it may artifi-cially correlate the levels of that factor. Therefore, a control analysis was performed to test if the main results were confirmed even with non-overlapping contiguous EEG frequency bands. Specifically, two ANOVAs were performed. One ANOVA used the daytime data (N = 11 lemurs having sufficient EEG-EMG epochs both in active and passive states) while the other ANOVA used the nighttime data (N = 6 lemurs having sufficient EEG-EMG epochs both in active and passive states). In the two ANOVAs, the normalized EEG power density was used as a dependent variable. The ANOVA factors were Condition (passive, active; independent vari-able) and Band (1–2 Hz, 3–4 Hz, 5–6 Hz, 7–8 Hz, 9–10 Hz, 11–12 Hz, 13–20 Hz, and 21–30 Hz).
In the second statistical session, we tested the main hypothesis of a correlation between the normalized EEG power density and rectified EMG activity in the active state (Pearson test, p<0.05). This correlation analysis was performed both in the daytime (N = 13 lemurs having sufficient EEG-EMG epochs in nighttime) and the nighttime data (N = 13 lemurs having suffi-cient EEG-EMG epochs in daytime). The frequency bands were those showing statistically sig-nificant effects of the above ANOVAs.
In the third statistical session, we tested the control hypotheses of a stability of the normal-ized EEG power density and the rectified EMG activity in the active (passive) state between daytime and nighttime. To this aim, two ANOVAs on the EEG dependent variable were per-formed. One ANOVA was computed for the active state (N = 13 lemurs having sufficient EEG-EMG epochs in daytime and nighttime), the other for the passive state (N = 5 lemurs hav-ing sufficient EEG-EMG epochs in daytime and nighttime). The ANOVA factors were Time (daytime, nighttime; independent variable) and Band (1–2 Hz, 2–4 Hz, 4–6 Hz, 6–8 Hz, 8–10 Hz, 10–12 Hz, 12–20 Hz, and 20–30 Hz). Mauchly's test evaluated the sphericity assumption when necessary. Correction of the degrees of freedom was made by Greenhouse–Geisser proce-dure. Duncan's test was used for post hoc comparisons (p<0.05 one-tailed). For each ANOVA, the control hypothesis would be confirmed by the no statistical effect showing a difference of EEG power density between daytime and nighttime (Duncan test, p>0.05 one-tailed). Con-cerning the rectified EMG activity, two Student t-tests were performed between daytime and
nighttime (p<0.05 one-tailed). One was computed for the active state, the other for the passive state.
In the fourth statistical session, we tested the control hypothesis that the rectified EMG activity was greater in the active compared to the passive state (Student t-test, p<0.05 one-tailed). This comparison was performed both in the nighttime (N = 6 lemurs having sufficient EEG-EMG epochs in nighttime) and the daytime data (N = 11 lemurs having sufficient EEG-EMG epochs in daytime).
Results
Results of the first statistical session
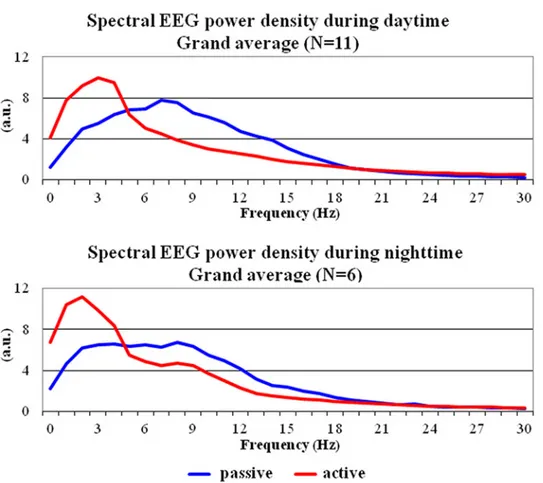
Fig 1shows the grand average across animals of the normalized EEG power density spectra (0– 30 Hz) computed from lemur premotor cortex in the behavioral active and passive states. The data refer to daytime (N = 11 mouse lemurs having sufficient EEG epochs in both states) and nighttime (N = 6 mouse lemurs having sufficient EEG epochs in both states). In the EEG power density spectrum of the passive behavioral state, normalized EEG power density values showed a clear peak between 7 and 9 Hz, namely in the putative alpha range. Noteworthy, the normalized EEG power density values of this peak were lower (i.e. desynchronization) in the
Fig 1. Grand-average across gray mouse lemurs of the normalized electroencephalographic (EEG) power density spectra between 0 and 30 Hz relative to the active and passive behavioral states. These spectra refer to the daytime (N = 11) and nighttime (N = 6) periods of interest. Lemurs having an insufficient amount of artefact-free EEG epochs in the passive state for the final analysis were not considered (daytime: L#4 and L#10; nighttime: L#1, L#2, L#3, L#4, L#11, L#12, and L#13).
behavioral active compared to the passive state. Also, the normalized EEG power density values between 1 and 4 Hz, namely in the putative delta range, were higher (i.e. synchronization) in the former compared to the latter. This difference of the EEG variable was observed both in the daytime and nighttime data.
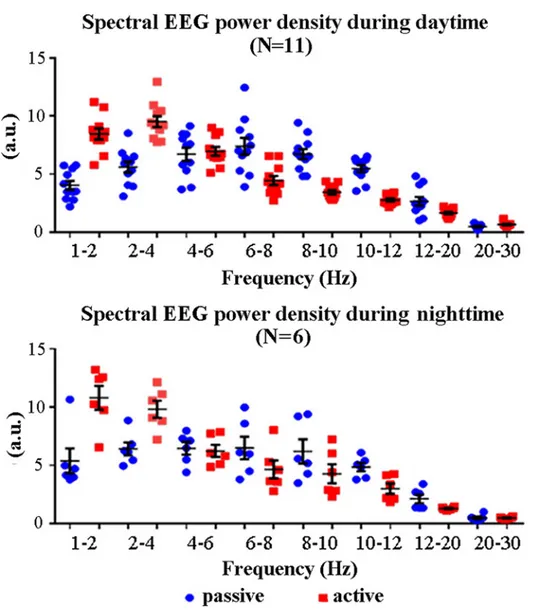
Fig 2illustrates individual normalized spectral EEG power density values at frequency bands of interest (1–2 Hz, 2–4 Hz, 4–6 Hz, 6–8 Hz, 8–10 Hz, 10–12 Hz, 12–20 Hz, and 20–30 Hz) from premotor cortex and for all lemurs, states (active, passive), and times (daytime, night-time). These values (circles) were relatively grouped with no substantial outlier.
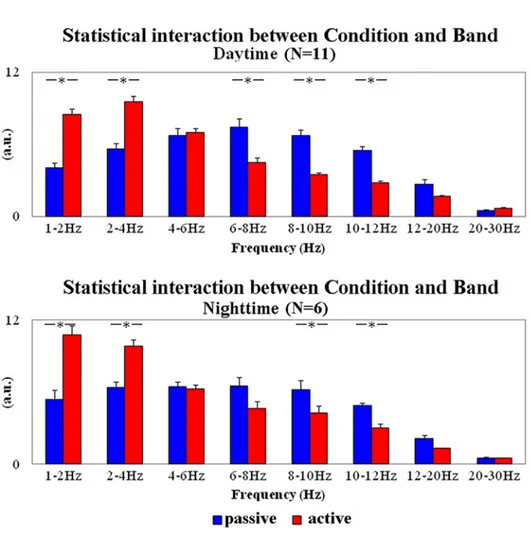
Fig 3plots the grand average across lemurs of the normalized EEG power density values at frequency bands of interest (1–2 Hz, 2–4 Hz, 4–6 Hz, 6–8 Hz, 8–10 Hz, 10–12 Hz, 12–20 Hz, and 20–30 Hz) in the daytime and nighttime data. These values refer to the main results of two Fig 2. Individual EEG spectral power density values at frequency bands of interest (1–2 Hz, 2–4 Hz, 4–6 Hz, 6–8 Hz, 8–10 Hz, 10–12 Hz, 12–20 Hz, and 20–30 Hz) for any lemur (one circle = one lemur) and the active and passive states. These values refer to the daytime (N = 11) and nighttime (N = 6) periods of interest. Lemurs having an insufficient amount of artefact-free EEG epochs in the passive state for the final analysis were not considered (daytime: L#4 and L#10; nighttime: L#1, L#2, L#3, L#4, L#11, L#12, and L#13). The mean (± standard error, SE) EEG power density values are also plotted.
ANOVAs aimed at testing EEG changes as a function of the behavioral states. The results of the first ANOVA showed an interaction between the factors Condition (active, passive; depen-dent variable) and Band (1–2 Hz, 2–4 Hz, 4–6 Hz, 6–8 Hz, 8–10 Hz, 10–12 Hz, 12–20 Hz, and 20–30 Hz) in the daytime data (F(7,70) = 34.556; p = 0.0001). The results of the second ANOVA showed the same interaction in the nighttime data (F(7,35) = 16.103; p = 0.00001). Duncan planned post hoc tests showed that in the daytime data, normalized EEG power den-sity values were lower at 6–8 Hz, 8–10 Hz, and 10–12 Hz in the active compared to the passive behavioral state (p<0.00003). Furthermore, these values were higher at 1–2 and 2–4 Hz in the former compared to the latter state (p<0.00002). In the nighttime data, normalized EEG power density values were lower at 8–10 and 10–12 Hz in the active compared to the passive behavioral state (p<0.02). Furthermore, these values were higher at 1–2 and 2–4 Hz in the for-mer compared to the latter state (p<0.00008).
Fig 3. Mean values (± SE) of the normalized EEG power density in the active and passive states at the frequency bands of interest. These values refer to the daytime (N = 11) and nighttime (N = 6) periods of interest. Lemurs having an insufficient amount of artefact-free EEG epochs in the passive state for the final analysis were not considered (daytime: L#4 and L#10; nighttime: L#1, L#2, L#3, L#4, L#11, L#12, and L#13). In the figure, the illustrated values refer to the results of two ANOVAs. The first ANOVA showed a statistically significant interaction (F(7,70) = 34.556; p = 0.0001) between the factors Condition (active and passive states; independent variable) and Band (1–2 Hz, 2–4 Hz, 4–6 Hz, 6–8 Hz, 8–10 Hz, 10–12 Hz, 12–20 Hz, and 20–30 Hz) in the daytime. The second ANOVA showed a statistically significant interaction (F(7,35) = 16.103; p = 0.00001) between the same factors in the nighttime. Asterisks indicate the statistically significant differences (Duncan’s post hoc test; p<0.05).
For the first control purposes, the number of EEG epochs in the active state was sub-sampled to pair that of the passive state both in daytime (p>0.8) and nighttime data (p>0.2). Two ANO-VAs were performed with the same features described in the previous paragraph. The results were quite similar to those of the main analysis. The first ANOVA showed a statistically signifi-cant interaction (F(7,70) = 42.287; p = 0.00001) between the factors Condition (active, passive; independent variable) and Band (1–2 Hz, 2–4 Hz, 4–6 Hz, 6–8 Hz, 8–10 Hz, 10–12 Hz, 12–20 Hz, and 20–30 Hz) in the daytime data. Duncan planned post hoc tests showed that normalized EEG power density values were lower in 6–8, 8–10, and 10–12 Hz in the active compared to the passive behavioral state (p<0.00002). Furthermore, these values were higher in 1–2 and 2–4 Hz in the former compared to the latter state (p<0.00003). The second ANOVA showed the same statistically significant interaction (F(7,35) = 14.885; p = 0.00001) in the nighttime data. Duncan planned post hoc tests showed that normalized EEG power density values were lower in 6–8, 8–10, and 10–12 Hz in the active compared to the passive behavioral state (p<0.03). Further-more, these values were higher in 1–2 and 2–4 Hz in former compared to latter state (p<0.0001).
For the second control purpose, we tested if the main results were confirmed even with non-overlapping contiguous EEG frequency bands. The results were as follows. The first ANOVA showed a statistically significant interaction (F(7, 70) = 26.975, p = 0.00001) between the factors Condition (active, passive; independent variable) and Band (1–2 Hz, 3–4 Hz, 5–6 Hz, 7–8 Hz, 9–10 Hz, 11–12 Hz, 13–20 Hz, and 21–30 Hz) in the daytime data. Duncan planned post hoc tests exhibited that the normalized EEG power density values were lower at 7–8, 9–10, and 11–12 Hz in the active compared to the passive behavioral state (p<0.0001). Furthermore, these values were higher at 1–2 and 3–4 Hz in the former compared to the latter state (p<0.00003). The second ANOVA showed the same statistically significant interaction between the factors Condition and Band (F(7, 35) = 13.174, p = 0.00001) in the nighttime data. Duncan planned post hoc tests exhibited that the normalized EEG power density values were lower at 7–8, 9–10, and 11–12 Hz in the active compared to the passive behavioral state (p<0.03). Furthermore, these values were higher at 1–2 and 3–4 Hz in the former compared to the latter state (p<0.0001). The results of this control analysis confirmed those of the main analysis with overlapping EEG frequency bands.
The results of this statistical session unveiled reliable changes of delta and alpha rhythms in lemurs as a function of behavioral active and passive states.
Results of the second statistical session
In this statistical session, a correlation analysis tested the relationship between the EEG and EMG variables in the active state. The frequency bands were those showing significant differ-ences in the first statistical session (p<0.05). There was a statistically significant correlation between normalized 2–4 Hz EEG power density and the rectified EMG activity both in the day-time data (r = 0.58; p<0.03) and the nightday-time data (r = 0.72; p<0.006). The higher the 2–4 Hz power density, the higher the rectified EMG activity. In the nighttime data, the correlation was negative between 8–10 and 10–12 Hz power density and the rectified EMG activity (r = -0.68; p<0.01 and r = -0.7; p<0.007, respectively). The lower this EEG power density, the higher the EMG activity.Fig 4plots the results mentioned above.
The results of this session showed a robust correlation between the normalized EEG power density and rectified EMG activity in behaving lemurs, especially in the delta range.
Results of the third statistical session
In this statistical session, two ANOVAs tested the stability of the EEG variables between day-time and nightday-time. The first ANOVA on the active state data showed an interaction between
the factors Time (daytime, nighttime; independent variable) and Band (1–2 Hz, 2–4 Hz, 4–6 Hz, 6–8 Hz, 8–10 Hz, 10–12 Hz, 12–20 Hz, and 20–30 Hz) (F(7,84) = 2.9455; p<0.009). Duncan planned post hoc tests showed that the only statistical EEG differences between day-time and nightday-time were limited to 1–2 Hz (higher normalized EEG power density in the active compared to the passive state; p<0.0001).
The second ANOVA on the passive state data showed no statistically significant result (p>0.05).
In this statistical session, two Student t-tests evaluated the stability of the rectified EMG activity between daytime and nighttime. These tests showed statistical differences neither in the former nor the latter (p>0.05).
The results of this session showed a global stability of the present EEG (>2 Hz power den-sity) and EMG variables in lemurs.
Results of the fourth statistical session
In this statistical session, two Student t-tests evaluated the control hypothesis that muscle activ-ity was higher in the active compared to the passive state in both the daytime and nighttime. As expected, the results showed that rectified EMG activity was greater in the active compared to the passive state in both the daytime (t = 5.28, p<0.0003) and nighttime data (t = 10.01, p<0.0002). The results of this session confirmed the control hypothesis.Fig 5plots the results mentioned above.
Discussion
In humans, resting state EEG rhythms reflect the fluctuation of cortical arousal and vigilance in a typical clinical recording setting, namely the EEG recordings for few minutes in subjects placed in the state of eyes closed (i.e. passive condition) and eyes open (i.e. active condition). The higher the cortical EEG power at a given frequency, the higher the synchronization of cor-tical pyramidal neurons at that frequency [26]. Can this basic procedure be back translated to Gray mouse lemur (Microcebus murinus), which is considered a very useful primate model for translational research on aging [4,5]? Typical methodology for preclinical EEG recordings in lemurs is based on the measurement of electrophysiological signals for tens of hours to extract markers of wake-sleep cycle and time course of EEG power in selected frequency bands over long periods [2,34]. This time scale is quite different with respect to that of the typical clinical setting of EEG recordings in humans (i.e. tens of minutes). Therefore, EEG experts of the IMI PharmaCog project (www.pharmacog.org) planned this study aimed at testing a new proce-dure that mimics that of the mentioned clinical setting for humans. We compared on-going EEG rhythms between passive (i.e. quiet wakefulness with immobility or small movements of trunk, head, and forelimbs) and active (i.e. dynamic exploration of the cage) conditions recorded for a relative brief period of tens of minutes.
As novel findings, we report that lemurs showed ample alpha rhythms (peak at 7–9 Hz) in the premotor frontal cortex during the passive behavioral state defined in the methodology (i.e. quiet wakefulness). Compared with this passive state, an active behavioral state (i.e. motor and locomotor activity associated with exploratory movements) induced a desynchronization of alpha rhythms and the increase in the amplitude of delta rhythms (1–4 Hz). These findings were reliably observed in both daytime, which is the period of rest (lemurs are nocturnal), and Fig 4. Scatterplots relative to the results of a correlation analysis (Pearson test; p<0.05) across gray mouse lemurs between the normalized EEG power density and the mean rectified EMG activity in the active state. These values refer to the daytime (N = 13) and nighttime (N = 13) periods of interest.
nighttime, which is the period of most animal activities. Also, the enhancement of delta rhythms with motor-locomotor activity was reliably correlated with EMG activity in both day-time and nightday-time. A tentative explanation of these findings can refer to the mechanism of generation of sensorimotor "mu" rhythms in the Rolandic cortex. Mu rhythms are constituted by two EEG oscillatory components. One component shows a frequency peak around 10 Hz Fig 5. Individual values of the mean rectified EMG activity for any lemur and the active and passive states. These values refer to the daytime (N = 11) and nighttime (N = 6) periods of interest. The mean (± SE) of the rectified EMG activities are also plotted. Lemurs having an insufficient amount of artefact-free EEG epochs in the passive state for the final analysis were not considered (daytime: L#4 and L#10; nighttime: L#1, L#2, L#3, L#4, L#11, L#12, and L#13).
(i.e. alpha rhythms) while the other peaks around 20 Hz (i.e. beta rhythms) [27,28,29]. In humans, Rolandic mu rhythms can be recorded by EEG, magnetoencephalography (MEG) and electrocorticography (ECoG). These rhythms are characterized by high amplitude (i.e. syn-chronization) in the condition of muscle relaxation (no muscle tension or movement), whereas they are blocked and disappear (i.e. desynchronization) during passive and active movements or isometric muscle tension [26,28,29,35,36,37]. Pre-surgical subdural ECoG recordings in epilepsy patients unveiled fine spatial details of mu rhythm showing that movement-related alpha and beta desynchronization is localized in premotor, primary motor and somatosensory areas [29,38].
Keeping in mind the above neurophysiological premises, a tentative explanation for the present findings is that humans, monkey and prosimian lemurs may share similar neurophysi-ological oscillatory mechanisms generating mu rhythms in the premotor frontal cortex. This similarity would represent an interesting translational model of synchronization at alpha fre-quencies (i.e. about 10 Hz) of premotor frontal neural populations in awake passive state and their desynchronization during preparation, execution, and control of biologically relevant vol-untary movements. As an original theoretical contribution, the present explanation extends to prosimian mouse lemurs some neurophysiological features of alpha component of mu rhythms in premotor cortex previously shown in humans and monkeys [29,30,39].
Another interesting novel contribution of the present study is that in lemurs, premotor cor-tex showed neither a clear peak of beta power density around 20 Hz during passive behavioral state nor its reduction in amplitude during active behavioral state. This difference with respect to human frontal mu rhythms might be due to (1) a simpler functional organization of premo-tor frontal cortex in lemurs compared to humans; (2) an insufficient spatial sampling of frontal cortex in the present experiments (indeed, we recorded EEG activity only in premotor cortex with no sampling from primary motor and somatosensory areas). Future studies should clarify this issue by simultaneous EEG recordings from premotor, primary motor, primary somato-sensory and superior parietal lobe areas.
As a further interesting finding of the present study, lemurs showed enhanced frontal delta rhythms (1–4 Hz) in the active compared with the passive behavioral state. Unfortunately, the current methodological approach did not allow disentangling the cognitive, motor, and loco-motor processes underlying this modulation of delta rhythms. Concerning the cognitive coun-terpart, previous studies have shown that event-related delta rhythms are related to attention, stimulus encoding, episodic memory and decision-making processes in healthy subjects [40,
41]. Concerning the motor counterpart, enhancement of frontal event-related delta rhythms has been shown in healthy subjects during locomotion (i.e. treadmill walking) [42]. Interesting results on event-related delta rhythms have been also reported in pathological aging. It has been reported an abnormal amplitude of cognitive event-related delta rhythms in patients with mild cognitive impairment [43,44] and AD [45,46]. Furthermore, reactivity of frontal delta rhythms to eyes opening was lower in these patients with respect to normal elderly subjects [47,48]. Keeping in mind these data, the present findings suggest that delta rhythms would represent another interesting translational neurophysiological model of cortical arousal for preclinical research in lemurs.
As a methodological limitation, the present EEG approach did not allow the investigation of the enhancement of cortical gamma rhythms (>40 Hz), ubiquitous in the brain [41,49], and typically related to cognitive-motor processes in humans [26,50]. The investigation of these rhythms would have required alignment of the onset of discrete motor events EEG epoch-by-epoch, to capture the event- and phase-locked gamma responses. Indeed, the present EEG approach was designed to study on-going premotor rhythms related to continuous motor and
locomotor activity in freely behaving lemurs, as a back translation of the typical clinical setting of EEG recordings in humans (i.e. resting state eyes closed and open).
In conclusion, we tested the hypothesis that prosimian gray mouse lemurs showed frontal alpha rhythms in awake passive state and their desynchronization during motor and locomotor activity, as a promising translational neurophysiological model. Results showed ample alpha rhythms (peak at 7–9 Hz) in the premotor frontal cortex during the passive behavioral state. During the active state, these rhythms desynchronized in association with enhancement of frontal delta rhythms (1–4 Hz). These alpha and (especially) delta rhythms were correlated with EMG activity in the active behavioral state. The present results suggest for the first time that prosimian lemurs and humans partially share basic neurophysiological mechanisms of generation and modulation of frontal delta and alpha rhythms in quiet wakefulness and explor-atory activity. This EEG approach may be an ideal translational back translation of the typical clinical setting of EEG recording in humans (i.e. resting state eyes closed and open) for basic (motor science) and applied (drug discovery) research.
Acknowledgments
The activity leading to the present study has received funding from the Seventh Framework Programme of European Community (FP7/2007-2013) for the Innovative Medicine Initiative under Grant Agreement No. 115009 (title of the project:“Prediction of cognitive properties of new drug candidates for neurodegenerative diseases in early clinical development”; acronym: PharmaCog). All electroencephalographic (EEG) data of this study were collected in the frame-work of a pre-competitive research in the Work Package 2 (WP2) of the PharmaCog project. Furthermore, the results are presented on behalf of the PharmaCog Consortium. Therefore, the PharmaCog Consortium is the legal owner of these data and outcomes. In particular, this Consortium is formed by 31 Official Partners including 15 academic institutions, 12 global pharmaceutical companies, 5 small and medium-sized enterprises (SMEs), Patient representa-tion from Alzheimer Europe, and European Medicines Agency (i.e. the Regulatory Agency for drugs and medical interventions). For further information on the PharmaCog project, the Institutions of the Consortium, and principal investigators of these Institutions, please go to
http://www.pharmacog.org.
Researchers interested in the access to original data of the present study should send the request to the Coordinators of the PharmaCog project, namely Dr. Jill Richardson (Neurosci-ences Therapeutic Area Unit, GlaxoSmithKline R&D; United Kingdom) and Prof. Regis Bordet (University of Lille 2, France). The ethical and scientific ground of all requests will be carefully evaluated by the PharmaCog Steering Committee.
Author Contributions
Conceived and designed the experiments: RB JCR FA CB FP. Performed the experiments: AR FA FP. Analyzed the data: FI CDP SL. Contributed reagents/materials/analysis tools: FI AR CDP YL GF WD SL FP. Wrote the paper: FI AR CDP YL RB JCR GF WD SL FA CB FP.
References
1. Pifferi F, Dal-Pan A, Menaker M, Aujard F. (2011) Resveratrol dietary supplementation shortens the free-running circadian period and decreases body temperature in a prosimian primate. J Biol Rhythms. 26:271–5. doi:10.1177/0748730411401788PMID:21628554
2. Pifferi F, Rahman A, Languille S, Auffret A, Babiloni C, Blin O et al. (2012) Effects of dietary resveratrol on the sleep-wake cycle in the non-human primate gray mouse lemur (Microcebus murinus). Chrono-biol Int. 29(3):261–70. doi:10.3109/07420528.2011.654019PMID:22390239
4. Bons N, Rieger F, Prudhomme D, Fisher A, Krause KH. (2006) Microcebus murinus: a useful primate model for human cerebral aging and Alzheimer's disease? Genes Brain Behav. 5:120–30. PMID: 16507003
5. Languille S, Blanc S, Blin O, Canale CI, Dal-Pan A, Devau G et al. (2012) The grey mouse lemur: a non-human primate model for ageing studies. Ageing Res Rev. 11:150–62. doi:10.1016/j.arr.2011.07. 001PMID:21802530
6. Némoz-Bertholet F, Aujard F. (2003) Physical activity and balance performance as a function of age in a prosimian primate (Microcebus murinus). Exp. Gerontol. 38:407–414. PMID:12670627
7. Némoz-Bertholet F, Menaker M, Aujard F. (2004) Are age-related deficits in balance performance medi-ated by time of day in a prosimian primate (Microcebus murinus)? Exp. Gerontol. 39:841–848. PMID: 15130679
8. Dhenain M, Michot JL, Privat N, Picq JL, Boller F, Duyckaerts C et al. (2000) MRI description of cerebral atrophy in mouse lemur primates. Neurobiol Aging. 21:81–8. PMID:10794852
9. Mestre-Francés N, Keller E, Calenda A, Barelli H, Checler F, Bons N. (2000) Immunohistochemical analysis of cerebral cortical and vascular lesions in the primate Microcebus murinus reveal distinct amyloid beta1-42 and beta1-40 immunoreactivity profiles. Neurobiol Dis. 7:1–8. PMID:10671318 10. Achilefu S. (2004) Lighting up tumors with receptor-specific optical molecular probes. Technol Cancer
Res Treat. 3(4):393–409. PMID:15270591
11. Becker A, Hessenius C, Licha K, Ebert B, Sukowski U, Semmler W, et al. (2001) Receptor-targeted optical imaging of tumors with near-infrared fluorescent ligands. Nat Biotechnol. 19(4):327–31. PMID: 11283589
12. Vanduffel W, Fize D, Mandeville JB, Nelissen K, Van Hecke P, Rosen BR, et al. (2001) Visual motion processing investigated using contrast agent-enhanced fMRI in awake behaving monkeys. Neuron. 32 (4):565–77. PMID:11719199
13. Liu JV, Hirano Y, Nascimento GC, Stefanovic B, Leopold DA, Silva AC. (2013) fMRI in the awake mar-moset: somatosensory-evoked responses, functional connectivity, and comparison with propofol anes-thesia. Neuroimage. 78:186–95. doi:10.1016/j.neuroimage.2013.03.038PMID:23571417
14. Smucny J, Wylie KP, Tregellas JR. (2014) Functional magnetic resonance imaging of intrinsic brain networks for translational drug discovery. Trends Pharmacol Sci. 35(8):397–403. doi:10.1016/j.tips. 2014.05.001PMID:24906509
15. Kaushal N, Nair D, Gozal D, Ramesh V. (2012) Socially isolated mice exhibit a blunted homeostatic sleep response to acute sleep deprivation compared to socially paired mice. Brain Res. 1454:65–79. doi:10.1016/j.brainres.2012.03.019PMID:22498175
16. Wither RG, Colic S, Wu C, Bardakjian BL, Zhang L, Eubanks JH. (2012) Daily rhythmic behaviors and thermoregulatory patterns are disrupted in adult female MeCP2-deficient mice. PLoS One. 7(4): e35396. doi:10.1371/journal.pone.0035396PMID:22523589
17. Chin J, Ling H-P, Comery T, Pangalos M, Reinhart P, Wood A. (2007) Chronic imbalance in neuronal activity and compensatory plasticity are associated with cognitive impairment in Tg2576 and PS1/APP mouse models of Alzheimer’s disease. International Conference on Alzheimer’s Disease; Chicago, IL. 18. Rubio SE, Vega-Flores G, Martínez A, Bosch C, Pérez-Mediavilla A, del Río J, et al. (2012) Accelerated
aging of the GABAergic septohippocampal pathway and decreased hippocampal rhythms in a mouse model of Alzheimer's disease. FASEB J. 26(11):4458–67. doi:10.1096/fj.12-208413PMID:22835830 19. Babiloni C, Infarinato F, Aujard F, Bastlund JF, Bentivoglio M, Bertini G, et al. (2013) Effects of pharma-cological agents, sleep deprivation, hypoxia and transcranial magnetic stimulation on electroencepha-lographic rhythms in rodents: Towards translational challenge models for drug discovery in Alzheimer's disease. Clin Neurophysiol. 124:437–51. doi:10.1016/j.clinph.2012.07.023PMID:23040292 20. Berger H. (1929) Über das Elektroenkephalogramm des Menschen. Archiv für Psychiatrie und
Ner-venkrankheiten. 87:527–570.
21. Whittington MA, Traub RD. (2003) Interneuron diversity series: inhibitory interneurons and network oscillations in vitro. Trends Neurosci. 26(12):676–82. PMID:14624852
22. Buzsáki D, Draguhn A. (2004) Neuronal oscillations in cortical networks. Science. 304(5679):1926– 1929. PMID:15218136
23. Somers D, Kopell N. (1993) Rapid synchronization through fast threshold modulation. Biol Cybern. 68 (5):393–407. PMID:8476980
24. Steriade M. (2001) Impact of network activities on neuronal properties in corticothalamic systems. J Neurophysiol. 86(1):1–39. PMID:11431485
25. Hasselmo ME, Bodelón C, Wyble BP. (2002) A proposed function for hippocampal theta rhythm: sepa-rate phases of encoding and retrieval enhance reversal of prior learning. Neural Comput. 14(4):793– 817. PMID:11936962
26. Pfurtscheller G, Lopes da Silva FH. (1999) Event-related EEG/MEG synchronization and desynchroni-zation: basic principles. Clin Neurophysiol. 110(11):1842–57. PMID:10576479
27. Gastaut H, Tertian H, Gastaut Y. (1952) Study of a little electroencephalographic activity: rolandic arched rhythm. Mars. Med. 89:296–310. PMID:12991978
28. Salmelin R, Hari R. (1994) Characterization of spontaneous MEG rhythms in healthy adults. Electroen-cephalogr. Clin. Neurophysiol. 91:237–48. PMID:7523073
29. Crone NE, Miglioretti DL, Gordon B, Sieracki JM, Wilson MT, Uematsu S, et al. (1998) Functional map-ping of human sensorimotor cortex with electrocorticographic spectral analysis. I. Alpha and beta event-related desynchronization. Brain. Dec; 121 (Pt 12):2271–99. PMID:9874480
30. Coudé G, Vanderwert RE, Thorpe S, Festante F, Bimbi M, Fox NA, et al. (2014) Frequency and topog-raphy in monkey electroencephalogram during action observation: possible neural correlates of the mir-ror neuron system. Philos Trans R Soc Lond B Biol Sci. 369(1644):20130415 doi:10.1098/rstb.2013. 0415PMID:24778383
31. Kaas JH, Gharbawie OA, Stepniewska I. (2013) Cortical networks for ethologically relevant behaviors in primates. Am J Primatol. 75(5):407–14 doi:10.1002/ajp.22065PMID:22865408
32. Abe M, Hanakawa T. (2009) Functional coupling underlying motor and cognitive functions of the dorsal premotor cortex. Behav Brain Res. 198(1):13–23. doi:10.1016/j.bbr.2008.10.046PMID:19061921 33. Bons N, Silhol S, Barbié V, Mestre-Francés N, Albe-Fessard D. (1998) A stereotaxic atlas of the grey
lesser mouse lemur brain (Microcebus murinus). Brain Res Bull. 46(1–2):1–173. PMID:9639030 34. Rahman A, Languille S, Lamberty Y, Babiloni C, Perret M, Bordet R, et al. Sleep deprivation impairs
spatial retrieval but not spatial learning in the non-human primate grey mouse lemur. PLoS One. 2013 May 22; 8(5):e64493. doi:10.1371/journal.pone.0064493PMID:23717620
35. Babiloni C, Carducci F, Cincotti F, Rossini PM, Neuper C. (1999) Human movement-related potentials vs desynchronization of EEG alpha rhythm: a high-resolution EEG study. Neuroimage. 10(6):658–665. PMID:10600411
36. Babiloni C, Babiloni F, Carducci F, Cincotti F, Cocozza G, Del Percio C, et al. (2002) Human cortical electroencephalography (EEG) rhythms during the observation of simple aimless movements: a high-resolution EEG study. Neuroimage. 17(2):559–72. PMID:12377134
37. Del Percio C, Infarinato F, Iacoboni M, Marzano N, Soricelli A, Aschieri P, et al. (2010) Movement-related desynchronization of alpha rhythms is lower in athletes than non-athletes: a high-resolution EEG study. Clin Neurophysiol. 121:482–491. doi:10.1016/j.clinph.2009.12.004PMID:20097129 38. Miller KJ, denNijs M, Shenoy P, Miller JW, Rao RP, Ojemann JG. (2007) Real-time functional brain
mapping using electrocorticography. Neuroimage. 37(2):504–7. PMID:17604183
39. Babiloni C, Del Percio C, Vecchio F, Sebastiano F, Di Gennaro G, Quarato PP, et al. (2015) Alpha, beta and gamma electrocorticographic rhythms in somatosensory, motor, premotor and prefrontal cortical areas differ in movement execution and observation in humans. Clin Neurophysiol. 2015 May 11. pii: S1388-2457(15)00308-9.
40. Başar E. (1980) EEG-brain dynamics: relation between EEG and brain evoked potentials. Elsevier, North-Holland Biomedical Press.
41. Başar E. (2010) Brain-Body-Mind in the Nebulous Cartesian System: A Holistic Approach by Oscilla-tions: A Holistic Approach By Oscillations. Springer.
42. Presacco A, Goodman R, Forrester L, Contreras-Vidal JL. (2011) Neural decoding of treadmill walking from noninvasive electroencephalographic signals. J Neurophysiol. 106(4):1875–87. doi:10.1152/jn. 00104.2011PMID:21768121
43. Yener G, Kurt P, Emek-Savaş DD, Güntekin B, Başar E. (2013) Reduced visual event-related delta oscillatory responses in amnestic mild cognitive impairment. J. Alzheimers Dis. 37, 759–767. doi:10. 3233/JAD-130569PMID:23948923
44. Kurt P, Emek-Savaş DD, Batum K, Turp B, Güntekin B, Karşıdağ S, et al. (2014) Patients with mild cog-nitive impairment display reduced auditory event-related delta oscillatory responses. Behav. Neurol. 2014:268967. doi:10.1155/2014/268967PMID:24825953
45. Yener G, Güntekin B, Başar E. (2008) Event-related delta oscillatory responses of Alzheimer patients. Eur. J. Neurol. 15:540–547. doi:10.1111/j.1468-1331.2008.02100.xPMID:18410376
46. Yener G, Güntekin B, Örken DN, Tülay E, Forta H, Başar E. (2012) Auditory delta event-related oscil-latory responses are decreased in Alzheimer’s disease. Behav Neurol. 25:3–11. doi: 10.3233/BEN-2012-0344PMID:22207418
47. Babiloni C, Lizio R, Vecchio F, Frisoni GB, Pievani M, Geroldi C, et al. (2010) Reactivity of cortical alpha rhythms to eye opening in mild cognitive impairment and Alzheimer's disease: an EEG study. J Alzheimers Dis. 22(4):1047–64. doi:10.3233/JAD-2010-100798PMID:20930306
48. Babiloni C, Vecchio F, Lizio R, Ferri R, Rodriguez G, Marzano N, et al. (2011) Resting state cortical rhythms in mild cognitive impairment and Alzheimer's disease: electroencephalographic evidence. J Alzheimers Dis. 26 Suppl 3:201–14. doi:10.3233/JAD-2011-0051PMID:21971461
49. Başar E, Başar-Eroğlu C, Ozerdem A, Rossini PM, Yener GG. (2013) Application of brain oscillations to neuropsychiatric diseases: a new land? Preface. Suppl. Clin. Neurophysiol. 62, v–vi. PMID:24053028 50. Crone NE, Miglioretti DL, Gordon B, Lesser RP. (1998) Functional mapping of human sensorimotor
cor-tex with electrocorticographic spectral analysis. II. Event-related synchronization in the gamma band. Brain 121:2301–15. PMID:9874481