UNIVERSITÀ DEGLI STUDI DI URBINO CARLO BO
Dipartimento di Scienze Pure ed Applicate (DiSPeA)
Corso di Dottorato di Ricerca in Scienze di Base e Applicazioni
Curriculum Scienze della Terra - XXXI ciclo
Titolo della tesi:
SURFACE EXPLORATION AND PETROLOGICAL APPLICATIONS IN HIGH
ENTHALPY GEOTHERMAL AREAS: A MULTIDISCIPLINARY APPROACH
FOR THE CERRO PABELLÓN PROJECT (NORTHERN CHILE)
ESPLORAZIONE DI SUPERFICIE ED APPLICAZIONI PETROLOGICHE IN AREE GEOTERMICHE AD ALTA ENTALPIA: UN APPROCCIO MULTIDISCIPLINARE NELL'AMBITO DEL PROGETTO CERRO PABELLÓN (CILE SETTENTRIONALE)
Settore Scientifico Disciplinare SSD: GEO/08
Candidato
Marco Taussi
Relatore:
Co-relatore:
Prof. Alberto Renzulli
Prof. Diego Morata
2
I
NDEXCHAPTER 1 - MOTIVATIONS, GENERAL INTRODUCTION AND SUMMARY OF THE THESIS ... 4
Motivations ... 5
1.1. Geothermal energy: current World situation ... 6
1.2. Geothermal exploration in Chile ... 9
1.3. Chilean main geothermal systems ... 10
1.4. Cerro Pabellón geothermal project ... 11
1.5. Summary and structure of the thesis ... 13
1.5.1. Chapter 2 ... 14
1.5.2. Chapter 3 ... 15
1.5.3. Chapter 4 ... 16
1.5.4. Chapter 5 ... 16
CHAPTER 2 - PETROLOGICAL EVOLUTION OF THE APACHETA-AGUILUCHO VOLCANIC COMPLEX AND CONSTRAINTS FOR THE MAIN HEAT SOURCE... 18
2.1. Introduction ... 19
2.2. Geological background... 22
2.2.1 Apacheta-Aguilucho Volcanic Complex and dacitic domes ... 22
2.2.2 Altiplano-Puna Magma Body ... 23
2.3. Sampling and analytical methods ... 23
2.4. Results ... 24
2.4.1 Petrography and mineral assemblages ... 24
2.4.1.1 Apacheta-Aguilucho Volcanic Complex lavas ... 24
2.4.1.2 Domes ... 25
2.4.1.3 Micro-vesiculated enclaves ... 27
2.4.2 Data on major-trace element and Sr-Nd-Pb isotopes ... 28
2.5. Discussion ... 39
2.5.1 The origin of the enclaves ... 39
2.5.2 Depth of interaction between andesitic and dacitic magmas ... 40
2.5.3 Petrological model for evolution of lavas and domes of the Apacheta-Aguilucho Volcanic Complex area ... 42
2.5.4 The youngest dacitic domes in the framework of the Altiplano-Puna Volcanic Complex .... 46
2.6. Summary and conclusions ... 46
CHAPTER 3 - CLAY MINERALS ASSOCIATIONS FROM THE ACTIVE HYDROTHERMAL SYSTEM ... 49
3.1. Introduction ... 50
3.2. Geological setting ... 52
3.3. Sampling and analytical methods ... 54
3.4. Results ... 59
3
3.4.2 Clay-rich fumarolic field samples ... 62
3.5. Discussion ... 65
3.5.1 Clay mineral associations in the boreholes and related temperatures of formation ... 65
3.5.2 Superficial hydrothermal alteration ... 67
3.7. Final remarks ... 70
CHAPTER 4 - SEALING CAPACITY OF CLAY-CAP UNITS OF THE GEOTHERMAL RESERVOIR ... 71
4.1. Introduction ... 72
4.2. Geological background... 73
4.3. Fluid geochemistry at AAVC ... 74
4.4. Material and methods... 76
4.4.1. Soil CO2 fluxes measurements at the Cerro Pabellón area ... 76
4.4.2 Soil temperatures measurements at the AAVC fumarolic field ... 76
4.4.3 Soil CO2 fluxes and temperature data processing ... 77
4.5. Results ... 78
4.5.1 Soil CO2 flux and soil temperatures ... 78
4.5.2 Soil temperatures at the AAVC fumarolic field ... 80
4.6. Discussion ... 82
4.7. Concluding remarks ... 88
CHAPTER 5 - OVERALL FINAL REMARKS AND FURTHER WORKS ... 90
5.1. Overall final remarks ... 91
5.2. Further works ... 95
REFERENCES ... 97
4
C
HAPTER
1
5
Motivations
The present thesis was carried out in the frameworks of a collaboration with Enel Green Power and of a Memorandum of Understanding between the Department of Pure and Applied Sciences (DiSPeA) of the University of Urbino and the Faculty of Physical and Mathematical Sciences of the Universidad de Chile (Santiago).
The Cerro Pabellón geothermal system, located in Northern Chile, which is the main object of this work, is classified as a blind (or hidden) geothermal field. In fact, the only hydrothermal manifestations are represented by two fumaroles located on the top of the Apacheta volcano, set to the west and about 600 m higher than the Cerro Pabellón geothermal area.
The aim of this PhD research project was to deepen the knowledge concerning the heat source and the evolution of the related magmatic plumbing system, define the clay-cap units and constrain its role and importance in the circulation of fluids toward the surface, producing an update conceptual model. A multidisciplinary approach was involved and focused on three complementary scientific studies:
• A petrological, geochemical and isotopic study on the Apacheta-Aguilucho Volcanic Complex and on the most recent volcanic products of the Altiplano-Puna Volcanic Complex, represented by the dacitic domes of Chanka, Chac-Inca and Pabellón. The main purpose was, after the identification of the amphibole crystallization depth (i.e. the depth of the heat source/s), to define the evolution of the magmatic plumbing system, and the mixing/mingling processes of the different magmas.
• A mineralogical study through X-Ray Powder Diffraction analysis of samples from a production geothermal well and an exploration drill core, besides clay-rich samples from the Cerro Apacheta fumarolic field (adjacent to the project area). The purpose of this work was to examine the vertical and superficial distribution of the clay minerals forming the hydrothermal system of the Cerro Pabellón active geothermal field, in order to identify the minerals associations, define the clay-cap units and characterize the type of hydrothermal alteration.
• A geochemical study of the diffuse CO2 soil flux and temperatures measurements, coupled with soil temperature gradients carried out at the fumarolic field, in order to define the sealing capacity of the clay-cap units and their importance in preventing the rise of the fluids toward the surface.
The final goal of this investigations was to give a multidisciplinary concept of geothermal exploration combining geological, volcanological, mineralogical, petrological and geochemical investigations, applying it to a blind (or hidden) geothermal system. The primary characteristic of a blind (or hidden) geothermal system is related to the lack of classic high-enthalpy-related superficial manifestations, such as geysers, fumaroles, sinter deposits, and hot springs.
6
Obviously, blind or hidden geothermal systems have not been extensively developed, as they are difficult to confirm in absence of drilling programs that can confirm the productivity of the reservoirs. Thus, the presence of the first geothermal power plant of South America, related to such a blind geothermal system, gave us a great opportunity to study and deepen the main features characterizing this system. A major comprehension of the processes involved in the formation of these geothermal areas is essential to extend geothermal exploration to other feasible areas where no surface manifestations are recognized.
1.1. Geothermal energy: current World situation
The continuous growth of energy consumption, the gradual and rapid depletion of oil reserves, coal and, more generally, fossil fuels, coupled with the consequent and constant increase in greenhouse gas emissions, requires the use of renewable sources for sustainable development and environmental protection. Therefore, on a local and global scale, energy plans must provide a policy focused on improving energy efficiency and exploiting renewable sources. Among the others, geothermal represents a promising energy source to satisfy the growing energy needs. Geothermal is the natural heat of the Earth. The temperature at the Earth’s centre is estimated to reach up to 5,500 °C. This heat is derived from the original formation of the planet and from the decay of the radioactive elements in the Earth’s crust. It is transferred to the subsurface mainly by conduction and convection.
For centuries, geothermal springs have been used for bathing, heating and cooking, but only in the early 20th century people started to consider the heat from inside the Earth as a practical source of energy with huge potential. In fact, the use of geothermal resources for energy purposes celebrated its centenary in 2013. In 1904 in Larderello (Italy) Prince Piero Ginori Conti powered five bulbs from a dynamo driven by a reciprocating steam engine using geothermal power. This success opened the way to a commercial development of the geothermal electricity, and in 1913 the first geothermal power plant started its operations with a capacity of 250 kWe. The Italian experience waked-up the interest on geothermal electricity in other countries. Geothermal energy is now used to produce electricity, to heat and cool buildings as well as for other industrial purposes like zootechnics, paper processing, fruit and vegetable cultivation, soil warming and many others. The exploitable geothermal resources are found throughout the world and are utilized nowadays in 83 countries, 27 of which also produce electrical energy (IGA Geothermal Energy Database, 2015). Surprisingly, until 2017 none of the South American countries was included in this list (Fig. 1.1). Only a small fraction of geothermal has been used so far and there is still much to do for development in both electricity generation and direct use applications.
7
Figure 1.1 - Global map of the use of the geothermal resource (from IGA Geothermal Energy
Database, 2015).
The electric production from geothermal sources covers about 0.5% of the world's energy needs (Chamorro et al., 2012), but the development of new technologies for its exploitation and the numerous new studies concerning sites of potential interest, ensure that the growth margins of geothermal production are wide. It has been passed from about 11,000 MW of installed capacity in 2010, to about 14,000 MW in 2017 (Pan et al., 2019; Fig. 1.2), with an estimated further increase up to about 21,000 MW in 2020 (Bertani, 2015).
8
Figure 1.2 - Global map of the installed capacity of geothermal energy plant for electricity
production in 2017 (14.3 GWe; Pan et al., 2019).
The main producers of energy from geothermal sources are represented by the USA, the Philippines, Indonesia, Mexico, New Zealand and Italy.
In the most industrialized countries, it is unlikely that large investments will be directed towards this energy sector, whereas in developing countries, characterized by lower energy consumption and with suitable geological and geodynamic features for exploitation of this source, geothermal energy can constitute a significant renewable, competitive with conventional non-renewable sources. Another important development desirable for the geothermal source is that related to non-electrical uses, therefore linked to the direct use of natural hot water, or to the production of thermal energy from plants with geothermal heat pumps, which can play a decisive role in the energy saving produced by fossil fuels.
Among the countries with a significant geothermal potential for electric production, as they cover geologically favourable areas, we found all the countries that include the Andean regions of South America, such as Colombia, Ecuador, Peru, Argentina and Chile. This latter in particular shows a remarkable potential and currently, almost completely unexpressed (Procesi, 2014; Lahsen et al., 2015; Aravena et al., 2016).
9
1.2. Geothermal exploration in Chile
Chile is the World's leading state in copper production and the mining industry is the country's main economic resource. The mining industry, however, imports more than 75% of the energy it needs (Lahsen et al., 2015) and in recent years the Chilean Government, also in collaboration with Enel Green Power Latin America, has therefore started to promote on its territory (in addition to hydroelectric) renewable sources of energy such as wind, photovoltaic and geothermal with the specific Cerro Pabellón project.
In Chile the demand for electricity increases by 5% every year, which is why an annual increase of approximately 1,000 MWe is required (Lahsen et al., 2015). The increase in the production of electricity from renewable sources is an important objective for the Chilean Government, to try to reduce the dependence on the importation of fossil fuels and to reduce greenhouse gas emissions in atmosphere. Geothermal resources could provide a clean source for electricity generation, since the country needs to import nearly 85% of fossil fuels for electricity production. Among the South American geothermal potential, Chile’s one has been estimated to be more than 1,300 MWe (Procesi, 2014; Aravena et al., 2016), equivalent to ∼4.4% of the total installed electric capacity in Chile (Aravena et al., 2016).
Early geothermal exploration in the country began in 1921 with the drilling of two ~80 m deep wells at the El Tatio geothermal field (Tocchi, 1923; Lahsen et al., 2005; Bona and Coviello, 2016). A prefeasibility investigation, funded at the end of ‘60s by the Chilean
Development Corporation (Corporación de Fomento de la Producción, CORFO) and the United Nations Development Program (UNDP) (Procesi, 2014), was followed by geological (Lahsen, 1969; Trujillo, 1971), geophysical (McDonald, 1969, 1974; Hochstein, 1971; ELC, 1980) and geochemical (Mahon, 1974; Lahsen, 1976; Cusicanqui, 1978a,b) surveys. Six 600 m-deep exploration wells, drilled between 1969 and 1971, encountered temperatures up to 250 °C (Tassi et al., 2010). Between the ‘70s and the ‘80s numerous supplementary
explorations, drilling and feasibility studies have been conducted (Lahsen 1988; Hauser, 1997; Peréz, 1999; Procesi, 2014), also in other geothermal prospects, such as Puchuldiza-Tuja and Surire, with good results (i.e. geothermometric calculations of reservoir temperatures up to 166 and 230 °C, respectively; JICA, 1979, 1981; Cusicanqui, 1979). Geothermal exploration was abandoned in 1982 because of both the remote location of the hydrothermal systems and economic factors. By early 2000, a new impulse was given by the issue of a Chilean law providing the framework for the exploration and development of geothermal energy. In that period (2005) the Italian ENEL enterprise made joint ventures with the Chilean enterprise ENAP (National Oil Company) starting a new company, i.e. Empresa Nacional de Geotermia (ENG), and also becoming shareholder in the Geotermica del Norte enterprise (2007) in order to develop geothermal exploration both in northern and central-southern Chile. Lately, during the first half of 2011, the Chilean Government founded the Andean Geothermal Center of
10
Excellence (Centro de Excelencia en Geotermia de Los Andes, CEGA), a FONDAP-CONICYT project hosted at the Universidad de Chile, aimed at improving geothermal knowledge and promoting its use in the Andean countries (Aravena et al., 2016). Nowadays, geothermal exploration is currently active and is driven by the need for energy security. In the country there are more than 300 geothermal areas associated with Quaternary volcanism (Lahsen et al., 2015). During the last 8 years, fourteen private companies were involved on exploring operations in 76 geothermal concession areas with the aim to identify areas of highest technical and commercial potential. In all these areas current exploration activities involves geological and structural surveys, volcanological studies, and geophysical and geochemical studies to find areas with high geothermal potential where exploratory drilling will be conducted (Lahsen et al., 2015).
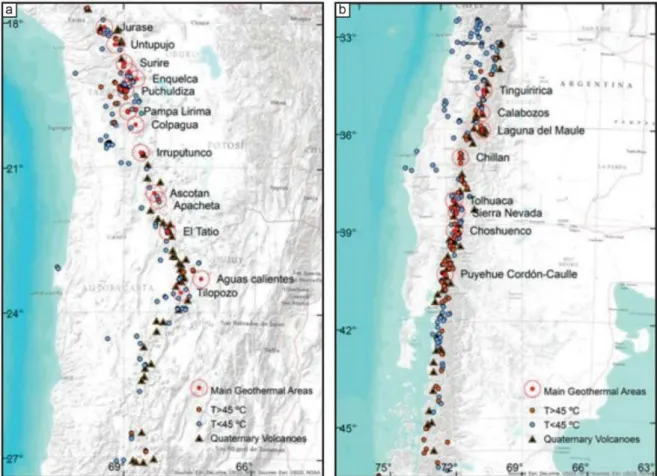
1.3. Chilean main geothermal systems
The high-temperature areas in Chile are located along the Andean Cordillera in close spatial relationship with active volcanism, primarily controlled by the convergence of the Nazca and South American Plates. The main geothermal systems occur in the northern (17-28 °S) and central-southern part (33-46 °S) of Chile (Fig. 1.3). The flat slab geometry of the subducting oceanic plate (i.e. Nazca plate) beneath the continental plate (i.e. South American plate) generates areas of volcanic gaps (Barazangi and Isacks, 1976) between 28 and 33 °S, and 46 and 48 °S. In these gaps thermal manifestations are scarce and their temperature are usually lower than 30 °C (Lahsen et al., 2010).
The Northern Chile geothermal zone (Fig.1.3a) has about 90 identified hot-spring areas (Hauser, 1997), and 45 exploration concessions are being surveyed (Lahsen et al., 2015). In this region, the most advanced exploration programs have been carried out in the Colpitas, Apacheta, Pampa Lirima and El Tatio-La Torta geothermal prospects (e.g. Urzua et al., 2002; Aguirre et al., 2011; Soffia and Clavero, 2010). Exploratory (or exploitation as in the case of Apacheta, i.e. Cerro Pabellón project) wells have been drilled in all of these four prospects. Their estimated combined power potential of exploitable geothermal energy is between 400 and 1,000 MWe (Lahsen et al., 2015). Exploitation concessions have been granted for the Apacheta and El Tatio geothermal fields, and the environmental assessment for the installation of a 50 MWe power plant has been approved for Apacheta. The El Tatio project was the most advanced but, has been cancelled in 2013 due to the company failing to comply with environmental and safety requirements (source: http://www.thinkgeoenergy.com).
In the Central-Southern Chile geothermal zone (Fig. 1.3b) there are more than 200 geothermal areas (Hauser, 1997) and 31 explorations concessions are underway. The most advanced exploration surveys have been completed at the Tinguiririca, Calabozos, Laguna
11
del Maule, Nevados de Chillán, Tolhuaca, and Cordón Caulle geothermal areas (e.g., Clavero et al., 2011; Soffia and Clavero, 2010; Melosh et al., 2010, 2012; Hickson et al., 2011; Aravena et al., 2016). Exploratory wells have been drilled in all these prospects and the estimated combined power potential for the five areas ranges from 650 to 950 MWe (Lahsen et al., 2015). Exploration concessions were granted for the Laguna del Maule area (Mariposa sector) and Tolhuaca (San Gregorio) prospects, where production-size wells have been drilled. An environmental impact assessment was submitted to the authorities for the approval of the installation of a 70 MWe power plant at Tolhuaca where well Tol-4 has an output of 12 MWe based on flow testing data (Lahsen et al., 2015).
Figure 1.3 - Main geothermal prospects of a) Northern Chile, and b) Central-Southern Chile;
modified from Lahsen et al. (2015).
1.4. Cerro Pabellón geothermal project
The Cerro Pabellón geothermal power generation project is located in the Ollagüe municipality, Antofagasta region, Northern Chile, ~100 km NE from city of Calama, and at 4,520 meters a.s.l. The concession is owned by a joint project between ENEL Latin-America (Chile) Ltd., and the National Oil Company (ENAP). The project, currently under production, involves the operation of an Organic Rankine Cycle (ORC) binary geothermal power plant, consisting of two units with an installed capacity of 48 MWe (source: https://www.enelchile.cl).
12
The site was luckily discovered by CODELCO at the end of ‘90s during water-related exploring operations (Urzua et al., 2002). Magnetotelluric (MT) and time domain electromagnetic (TDEM) surveys detected a low resistivity boundary (<10 ohm-m) extending over an area of 25 km2 and geochemical survey indicated reservoir temperature of 250-260 °C (Urzua et al., 2002). Temperature >200 °C was successively measured at depth > 500 m in a 557 m-deep core-hole carried out by the Empresa Nacional de Geotermia in October 2007.
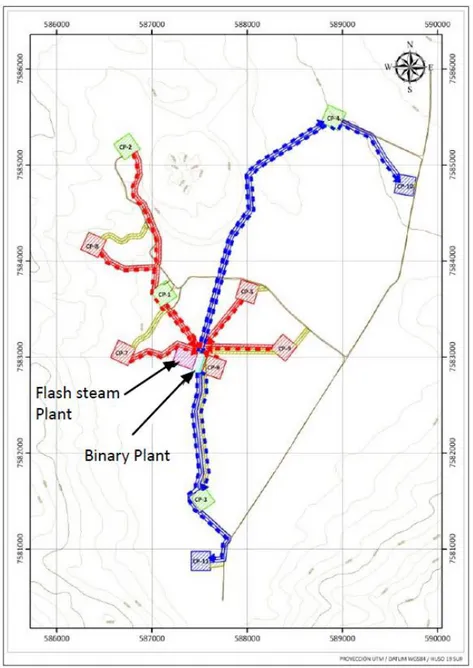
The geothermal system is located upon a large zone of silicic volcanism occupying the 21-24 °S segment of the Andean Central Volcanic Zone (de Silva, 1989; de Silva et al., 1994) and it is hosted by a ~4 km wide NW-SE trending graben where on the SW fault the Pliocene-Pleistocene lavas and pyroclastic products of the Apacheta-Aguilucho Volcanic Complex were erupted, while in the NE fault the Pleistocene Pabellón dacitic dome was extruded. Nowadays, this graben-hosted system has six deep wells platforms (Fig. 1.4), that allowed to exploit the liquid-dominate geothermal reservoir. The thickness of the reservoir is constrained by the convective regime in wells CP-1 (880 m) and CP-2 (1,120 m), starting at 900 and 820 m depth, respectively (Aravena et al., 2016). Wells CP-4 and CP-3 show a conductive regime (ENEL, 2012). The minimum horizontal extension of the reservoir (4 km2) is given by the distance between wells. Maximum extension in the NE-SW orientation is given by the projected distance between the graben main faults at the depth of the reservoir. In the NW-SE direction, maximum extension will be considered as the linear projection of thickness vs. distance for wells CP-1 and CP-2 (∼5 x 5 km2). Minimum and maximum temperatures of the reservoir are reached in wells CP-2 (212 °C) and CP-1 (256 °C) respectively, which are consistent with gas geothermometry estimates of around 250 °C reported by Urzua et al. (2002), and Tassi et al. (2010).
13
Figure 1.4 - Production and re-injection platforms of the power plant. Red lines: production
platforms and pipeline system of hot fluid toward the plant. Blue squares and line: re-injection platforms and pipeline system to re-injection wells. Green squares: platforms that have already been constructed in the context of the exploration stage. Nowadays, six platforms have been constructed (i.e. CP-1, CP-2, CP-3, CP-4 and CP-5). CP-7, CP-8, CP-9, CP-10 and CP-11 were not constructed yet, related to a possible future implementation of the power plant (ENEL, personal communication). Source: http://cdm.unfccc.int.
1.5. Summary and structure of the thesis
The structure of this PhD thesis has been thought as a compendium of scientific papers, represented by the main chapters (i.e. 2, 3 and 4), exposed in a consequential and complementary way. In fact, after this short introduction on geothermal energy and on the main features of the Cerro Pabellón project, the chapters present three main subjects, in order to highlight the multidisciplinary purpose of the study.
14
1.5.1. Chapter 2
It deals with the main petrological processes affecting the magmatic plumbing system of the Apacheta-Aguilucho Volcanic Complex and the nearby dacitic domes. Moreover, a brief synthesis of the amphibole thermobarometry results is also given. These latter have been obtained during two previous PhD projects carried out at the University of Urbino (Piscaglia, 2011; Gorini, 2017), and completed during this PhD work, so they are not extensively reported.
Abstract
The evolution of the magma plumbing system of the Pleistocene Apacheta-Aguilucho Volcanic Complex and the nearby young dacitic domes, located in the Central Andean Volcanic Zone (Northern Chile), above one of the thickest crusts in the world (>70 km), was investigated through petrographic, geochemical and isotopic studies of representative lavas and related enclaves. Updated available dates of these products, both from the Apacheta and Aguilucho stratovolcanoes and nearby domes, allow us to define the activity during the last 1 Ma. This investigation showed that the andesitic magmas were affected by processes of Assimilation plus Fractional Crystallization (AFC, with a significant role played by amphibole fractionation) during their ascent through the upper crust, presumably by the interaction with the Altiplano-Puna Magma Body (APMB). The APMB is a voluminous (∼500,000 km3) igneous, partially-molten body located at a crustal depth of 15-20 km. These andesitic magmas were erupted with no or minor additional contamination at shallower levels, or experienced plagioclase-dominated Fractional Crystallization (FC) to dacite within shallower crustal magma chambers (4-8 km depth). The constructional phase of the Apacheta and Aguilucho stratovolcanoes (≥ 1 to ca. 0.6 Ma) reflect a transition from high-flux (i.e. flare-ups) to steady state magmatism, as also documented in other Pleistocene volcanic complexes of the Altiplano-Puna Volcanic Complex. During this stage the mafic magma recharge was high enough to permit a large spectrum of hybridization of the resident magmas in the upper crust to form the abundant andesites and dacites lavas. In contrast, at ∼150-100 ka, the magmatism turned to a new stage of recharge (waning stage?) and the episodic intrusion of small-volumes of andesitic magmas permitted the remobilization of the crystal-rich dacites, triggering the extrusions of the Chanka, Chac-Inca and Cerro Pabellón domes. The andesitic enclaves in the domes studied here represent a snapshot of the magmatic processes of interaction that occurred in the shallower reservoir at the interface of the resident dacite with the ascending andesitic magma. A revised petrogenetic model, firstly reported by Coombs et al. (2002), well constrains the textural and geochemical variation in observed enclaves, which are strongly influenced by the location of crystallization with respect to the andesite-dacite interface. Nevertheless, as there are no dated volcanic products from the area between 0.6 and 0.1 Ma, the youngest dacitic domes could also be interpreted as the beginning of a new magmatic
15
pulse of the Altiplano-Puna Volcanic Complex. Independently from the significance of the mafic recharge at 150-100 ka (waning stage vs. new pulse) the youngest investigated domes share similar geochemical features and crustal depth constraints (4-8 km) with the ignimbrites of the Altiplano-Puna Volcanic Complex, therefore suggesting that the remobilized magmas erupted as the domes are possibly remains of older plumbing systems left over from the last magmatic flare-up of the Altiplano-Puna Volcanic Complex.
1.5.2. Chapter 3
In this chapter the mineralogical associations present at the Cerro Pabellón geothermal system, both deep and superficial, were investigated through X-Ray Diffraction (XRD) analyses. The purpose of this section was to examine the vertical and superficial distribution of the clay minerals forming the hydrothermal system of the Cerro Pabellón active geothermal field, in order to identify the minerals associations, define the clay-cap units and characterize the type of hydrothermal alteration. The first preliminary results from the fumarolic deposits of the Cerro Apacheta fumarolic field are here presented, although further works and analyses need to be done on these samples, to define in detailed the physico-chemical processes that affected the fluid-rocks interactions. The data presented in this chapter are the results of a jointed collaborative investigation carried out by the PhD candidate (CP-1 well and fumarolic field samples) and the C.E.G.A. researchers (PexAP-1). The results, the discussion and the conclusions are the outcome of a scientific debate between these researchers.
Abstract
Mineralogical studies on the vertical and superficial distribution of the clay minerals forming the hydrothermal system of the Cerro Pabellón active geothermal field, were carried out. From the mineral assemblages recognized in the fumarolic field and in two boreholes located in the Pampa Apacheta, the system seems to be characterized by both acid-sulfate (fumarolic field) and adularia-sericite (boreholes) alteration types. The acid-sulfate alteration characterizes the upper parts of the Apacheta volcano, where the rising magmatic gases are mixed with shallower aquifer, producing acid-sulfate waters. Here, two main subzones are recognized: i) one characterized by high amounts of smectite, mainly coupled with cristobalite and feldspar, and ii) one characterized by kaolinite, mainly coupled with halloysite and subordinate smectite. It has been constrained how these subzones show a good correspondence with the location of the thermal manifestations, and a moderate accordance with the soil temperatures measured in the sampling locations. Conversely, a not-fitting with the pH conditions of stability for the smectite clay minerals group was observed. Although a unique explanation to this controversy is difficult, our preliminary data indicate the involvement of neutralization processes in the active vents areas in order to explain the presence of
16
smectite in such an acid environment (i.e. pH = 3.5), and typical acid-fluids leaching processes in the far-from-vents areas, where kaolinite represents the main mineralogical phase.
The geothermal reservoir is characterized by an adularia-sericite alteration and, from the mineralogical assemblages recognized, is possibly related to fluids with near-neutral pH. The blind nature of the Cerro Pabellón geothermal system might be linked to the thickness and low permeability of the clay-cap units (∼300 m). Two main clay minerals transitions were detected in the clay-cap: the smectite to illite and the smectite to chlorite. In fact, the illite and chlorite only prevail in rock samples from the reservoir domain, where mixed-layer illite-smectite and chlorite-smectite are almost absent. In both reaction series, a continuous and slow reduction of the proportion of smectite layers in mixed-layer clays with depth was observed. The impermeability of the clay-cap of the geothermal system, would not favour the advance of illite-smectite and chlorite-illite-smectite reaction series.
1.5.3. Chapter 4
It deals with the lack of superficial thermal manifestations of the blind geothermal system. The sealing capacity of the clay-cap units defined in chapter 3, was investigated through CO2 soil flux and temperature measurements with the accumulation chamber methodology. Soil temperature gradients were also measured at the fumarolic field on the top of the Apacheta volcano, where the only active hydrothermal manifestations are present.
Abstract
The sealing capacity of the clay-cap units was investigated in the geothermal area through systematic diffuse CO2 soil flux and temperature measurements (~500 points), using the accumulation chamber method. The low CO2 flux and the relatively large areas of thermal anomalies identified, demonstrate the efficiency of the thick clay-cap to prevent the resurgence of fluids up to the surface. The low CO2 effluxes measured in the main geothermal areas suggest that contribution by deep-seated CO2 (magmatic origin) to soil degassing is almost negligible. In fact: i) the majority of the soil CO2 flux measurements are below background levels and most shallow soil temperatures are higher than the temperature condition of air-saturated soil. No correlation between soil temperature and CO2 flux is recorded, and the only significant thermal anomalies is registered at the active fumarolic field. The lack of soil CO2 anomalies above the existing pressurized reservoir, can be due to two main factors: i.e. the continuous, thick, and impervious clay-cap, and the magmatic gas scrubbing processes in the liquid-dominated environment, that produce the removal of CO2 and acidic magmatic compounds (i.e. SO2 and HCl), with the consequent ascent of CO2-depleted steam, heating the shallower aquifer/s. The latter resulting at the surface as a diffuse, slight thermal anomaly, recognized by a geostatistical approach, and at 187 m below the surface (i.e. at the bottom of
17
an exploratory well and above the clay-cap units) as a wispy flow of steam with measured temperature of 88 °C. As a matter of fact, the active fumarolic area, located at the summit of the Apacheta volcano, is the only visible evidence of the hidden geothermal reservoir in the Cerro Pabellón area.
1.5.4. Chapter 5
In this final chapter general conclusions and consideration on the 3 years PhD course are given, considering the main results obtained during this project. An update conceptual model of the Cerro Pabellón geothermal system and possible outlooks are also presented.
18
C
HAPTER
2
P
ETROLOGICAL EVOLUTION OF THEA
PACHETA-A
GUILUCHOV
OLCANICC
OMPLEX AND CONSTRAINTS FOR THE MAIN HEAT SOURCETHE MAIN PART OF THIS CHAPTER HAS BEEN PUBLISHED AS:
Taussi, M., Godoy, B., Piscaglia, F., Morata, D., Agostini, S., Le Roux, P., Gonzalez-Maurel, O., Gallmeyer, G., Menzies, A., Renzulli, A., 2019. The upper crustal magma plumbing system of the Pleistocene Apacheta-Aguilucho Volcanic Complex area (Altiplano-Puna, northern Chile) as inferred from the erupted lavas and their enclaves. Journal Volcanology and
Geothermal Research. Accepted 25 January 2019.
https://doi.org/10.1016/j.jvolgeores.2019.01.021.
THE AMPHIBOLE THERMOBAROMETRY RESULTS HAVE BEEN PUBLISHED IN:
Gorini, A., Ridolfi, F., Piscaglia, F., Taussi, M., Renzulli, A., 2018. Application and reliability of calcic amphibole thermobarometry as inferred from calc-alkaline products of active geothermal areas in the Andes. Journal of Volcanology and Geothermal Research 358, pp. 58-76. https://doi.org/10.1016/j.jvolgeores.2018.03.018.
19
2.1. Introduction
The Altiplano-Puna Volcanic Complex (APVC) is an ignimbritic plateau situated between 21° and 24°S and straddling Chile, Bolivia and Argentina (de Silva, 1989) in the Andean Central Volcanic Zone (CVZ; Fig. 2.1a). The 10–1 Ma ignimbrite flare-ups that
occurred in this plateau are characterized by an episodic spatiotemporal pattern of eruptions at rates much higher than typical of continental arcs (de Silva and Gosnold, 2007). Large volumes (~15,000 km3; de Silva and Kay, 2018) of dacitic to rhyolitic magmas, erupted in four major pulses at ∼10, 8, 6, and 4 Ma increased in intensity until 4 Ma (Salisbury et al., 2011) and followed by a sharp decrease. Quaternary volcanism has a periodicity of ~1 Ma and exploits relict magmas produced earlier (de Silva et al., 2015). This tempo is controlled by the thermomechanical evolution of the upper-crustal magma reservoirs. As magma accumulates in the upper crust, feedbacks between temperature, host-rock mechanics and chamber pressurization results in ductile host-rock rheologies, which promote storage and growth over eruption and lead to reservoir growth under conditions of constant recharge flux and/or crystallization (de Silva and Gregg, 2014; de Silva et al., 2015; de Silva and Kay, 2018).
The area of the APVC investigated in the present work is represented by the Pleistocene Apacheta-Aguilucho Volcanic Complex (AAVC; Aguilera et al., 2008; Mercado et al., 2009; Fig. 2.1), and three late Pleistocene dacitic domes associated with the last eruptive pulse of the APVC: Chanka, Chac-Inca and Cerro Pabellón (hereafter Pabellón) (Fig. 2.1b). Between the AAVC and the Pabellón dome, the high-enthalpy geothermal field of the “Proyecto Cerro Pabellón” (previously called Apacheta project by Urzua et al., 2002), was developed. This part of the Central Volcanic Zone has been affected by tectonic shortening that began about 35 Ma with strong acceleration during the last 10 Ma (Freymuth et al., 2015; Wörner et al., 2018), producing an anomalously thick crust (>70 km; Beck et al., 1996). The overthickened crust below the APVC hosts a partially-molten amalgamated igneous body (Zandt et al., 2003; Ward et al., 2014), the Altiplano-Puna Magma Body (APMB; sensu
Chmielowsky et al., 1999). This magmatic body has been well constrained by seismic (Ward et al., 2014), gravimetric (del Potro et al., 2013) and magnetotelluric studies (Comeau et al., 2015, 2016), and is interpreted as a batholith (de Silva and Gosnold, 2007; Kern et al., 2016) corresponding to a zone of melting, assimilation, storage and homogenization (MASH, sensu
Hildreth and Moorbath, 1988) at upper crustal levels (Ward et al., 2014; Godoy et al., 2014; Burns et al., 2015; de Silva and Kay, 2018), which fed the shallower sub-volcanic systems (de Silva and Gosnold, 2007). This partially molten igneous body represents a “mush” column (de Silva et al., 2006; Muir et al., 2014, 2015; Gottsmann et al., 2017), which contaminates the mantle-derived magmas with different degrees of assimilation (e.g. Kay et al., 2010; Burns et al., 2015; Godoy et al., 2017a; Maro et al., 2017; de Silva and Kay, 2018). The youngest volcanic products (< 2 Ma) show an increasing degree of contamination with location of the
20
partially molten body, going from the margins towards its centre located in correspondence to the Uturuncu volcano (Bolivia) (Michelfelder et al., 2013; Godoy et al., 2017a). In this context, the extrusion of the young dacitic domes, which represent the most recent phase of the APVC (de Silva et al., 1994; Tierney et al., 2016), together with monogenic edifices of other recent eruptions, such as La Poruña scoria cone (Bertin and Amigo, 2015) located about 30 km West of the studied area (Fig. 2.1c), may represent a window into pluton assembly during low eruptive flux stages of a magmatic flare-up that characterized the evolution of the APVC in the Quaternary period (de Silva and Gregg, 2014; Tierney et al., 2016). The present chapter is focused on the AAVC lavas, the Chanka, Chac-Inca and Pabellón dacitic domes and their enclaves, in order to explore (i) the Pleistocene magmatic plumbing system working in this area and (ii) the role played by the APMB in the evolution of the erupted magmas.
The aim of this chapter is to give a petrographic, geochemical (major and trace elements) and isotopic (87Sr/86Sr, 143Nd/144Nd, 206Pb/204Pb; 207Pb/204Pb; 208Pb/204Pb) characterization of representative samples from the extrusive products of the AAVC and the nearby enclave-hosting dacitic domes of Chanka, Chac-Inca and Pabellón. This dataset was applied to petrological modelling in order to investigate the intra-crustal magmatic processes in the last 1 Ma span time. These constrains, coupled with the results of the amphibole thermobarometry published in Gorini et al. (2018), can give a better comprehension of the intra-crustal magmatic evolution of the volcanic plumbing systems, and a characterization of the possible heat source/s of the geothermal area.
21
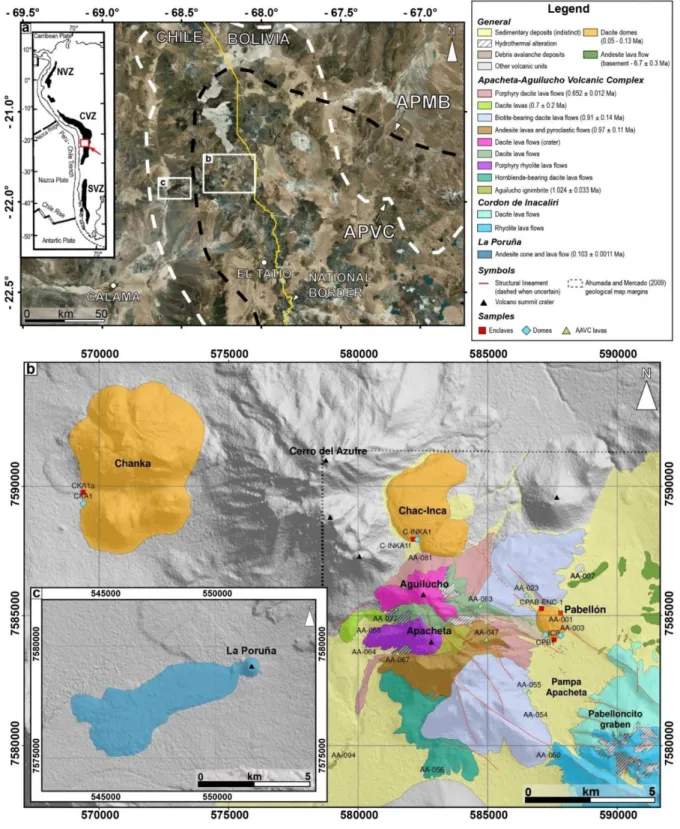
Figure 2.1 - Location map of the Apacheta-Aguilucho Volcanic Complex and the domes. a)
The small white rectangles indicate the locations of the studied areas reported in (b) and (c), in the framework of the Andean Central Volcanic Zone (CVZ; inset figure); the white dashed line delineates the Altiplano-Puna Volcanic Complex (APVC), black dashed line indicates the surface projection of the Altiplano-Puna Magma Body (APMB), after Zandt et al. (2003); yellow line indicates the national border between Chile and Bolivia. b) Simplified geological map of the Apacheta-Aguilucho Volcanic Complex showing the main volcanic and structural features of the area (after Ahumada and Mercado, 2009, Godoy et al., 2017b, and Sellés and Gardeweg, 2017). c) Enlarged view of the La Poruña scoria cone. Coordinates of b) and c) in WGS84, UTM 19S. Figure from Taussi et al. (2019).
22
2.2. Geological background
2.2.1 Apacheta-Aguilucho Volcanic Complex and dacitic domes
The Pleistocene Apacheta-Aguilucho Volcanic Complex (21,84°S; 68,20°W) and the nearby young dacitic domes (Chanka, 21,78°S; 68,31°W - Chac-Inca, 21,80°S; 68,21°W - Pabellón, 21,84°S; 68,15°W) are located about 100 km NE of the city of Calama and about 55 km NW of the El Tatio geothermal field, near the international border between Chile and Bolivia (Fig. 2.1a). Based on the NW–SE alignment of the APVC centres, Davidson and de Silva (1992) and de Silva et al. (1994) suggested that the principal volcanic features are controlled by a series of NW-striking faults, an association that can also be recognized in the study area. This sector is tectonically characterized by the presence of two major faults with converging dips, characterized by 50-150 m high scarps which form a NW-oriented symmetric graben, ~4 km wide and ~20 km long (Pabellóncito graben; Francis and Rundle, 1976). This structure was formed during a Late Pliocene-Quaternary extensional phase (Tibaldi et al., 2009), and has been linked by Tibaldi and Bonali (2018) to gravity spreading of the Pliocene-Pleistocene aged Palpana-Inacaliri volcanic chain (Wörner et al., 2000; Sellés and Gardeweg, 2017). The young dacitic domes of Chanka, Chac-Inca and Pabellón were emplaced along this extensional structure, beside the AAVC and the Cerro del Azufre volcano, this latter being still active in the late-glacial period (de Silva and Francis, 1991). Both the AAVC and the dacitic domes overlay an Eocene-Miocene basement, made up of a sequence of andesitic lava flows, conglomerates, breccias, sandstones, limestones and gypsum formations (Ramírez and Huete, 1981). Over this basement, Miocene ignimbrites and andesitic lava flows (7.5 ± 0.6 Ma, and 6.7 ± 0.3 Ma, respectively; Rivera et al., 2015) are exposed. The AAVC is mainly characterized by andesitic, dacitic and rhyolitic products (Piscaglia, 2012). Its magmatic history has been divided into two main eruptive periods (Mercado et al., 2009; Piscaglia, 2012): a Middle Pleistocene phase that involved the building of the Apacheta stratovolcano and a Mid-Upper Pleistocene phase when the Aguilucho stratovolcano formed. The first phase is constrained by the ages of the Aguilucho ignimbrite (1.024 ± 0.033 Ma, that despite the name pertains to the Apacheta activity; Sellés and Gardeweg, 2017), and of a dacite lava flow (0.91 ± 0.14 Ma; Rivera et al., 2015) (Fig. 2.1b). Conversely the second phase is made up by two dacite lava flows of the Aguilucho volcano in the western (0.7 ± 0.2 Ma; Rivera et al., 2015) and northern (0.652 ± 0.012; Sellés and Gardeweg, 2017) flanks (Fig. 2.1b). The domes of this area (Fig. 2.1b) correspond to crystal-rich dacitic flows, with occasional andesitic enclaves, erupted during Upper Pleistocene, with ages obtained for Chanka (119.8 ± 5.4 ka; Tierney et al., 2016), Chac-Inca (114.0 ± 37.0 ka; Rivera et al., 2015) and Pabellón (80.0-130.0 ka according to Renzulli et al., 2006 and 50.0 ± 10.0 ka according to Urzua et al., 2002). La Poruña represents a monogenetic
23
andesitic scoria cone with a ~8 km long lava flow (Fig. 2.1c), dated 103.0 ± 1.1 ka (Wörner et al., 2000).
2.2.2 Altiplano-Puna Magma Body
The Altiplano-Puna Magma Body (APMB) in the Central Andes is the largest known zone of partial melting in the continental crust, spanning a region 200 km in diameter (Fig. 2.1a), at 4-25 km b.s.l. and with an estimated volume of 500,000 km3 (Ward et al., 2014). The APMB anomaly has been described by magnetotelluric (MT) surveys (Comeau et al., 2015, 2016) as a low-resistivity zone with the top at ~15 km below sea level (defined at 3 Ω·m) due
to the presence of andesitic melts with a melt fraction up to 25% (Schilling et al., 2006; Ward et al., 2014; Comeau et al., 2015) and an estimated temperature of ∼1000 °C (Comeau et al., 2016). The top of the APMB has been constrained about 5 km deeper than originally reported by Ward et al. (2014), probably due to the low spatial resolution of ambient noise tomography, because of the long wavelengths of the seismic waves used, or to the possibility that the materials between ~4-15 km b.s.l. really do have a low seismic velocity but relatively high resistivity compared to the APMB (Pritchard and Gregg, 2016). The maximum thickness of the APMB seismic anomaly from the joint analysis of ambient noise tomography and receiver functions used by Ward et al. (2014) is ~11 km, defined through shear waves velocity (Vs) of 2.9 km/s, because velocities below this value clearly imply partial melting (Ward et al., 2014). An isostatic residual gravity field (Götze et al., 1994; Götze and Krause, 2002) reveals also a strong negative anomaly that supports an extensive low-density area beneath the APVC, centred in southern Bolivia under the Uturuncu volcano, and a dense grid of observations and new models have produced a range of plausible shallower low-density structures, interpreted as diapiric columns of partially molten rock that connect the APMB with putative shallow-level magma storage regions (Annen et al., 2015) constrained by experiments and melt inclusions (del Potro et al., 2013; Muir et al., 2014). S-wave velocities indicate an increase in melt/fluid percentage from the margin to the center of the partially molten body from ∼4% for zones with S-velocities of 3.2 km/s, to ∼10% (2.9 km/s), and up to 25% in zones with velocities <1.9 km/s (Ward et al., 2014). This variation, in the Western margin of the anomaly, is emphasized by the different degree of contamination of the erupted magmas that pass through the APMB and present a lateral variation of Sr- and Nd-isotope compositions (Michelfelder et al., 2013; Godoy et al., 2017a). The interaction between less differentiated magma and this crystal-rich mush increases from the margins to the center of the anomaly, where crustal assimilation is more significant as magmas interact along the entire mush column (Muir et al., 2014; 2015).
2.3. Sampling and analytical methods
Representative samples from the Apacheta-Aguilucho Volcanic Complex and the dacitic domes (lavas and enclaves) were collected during several field trips, between 2007 and
24
2017. The sample locations are shown in Figure 2.1b. A total of 27 samples were prepared for major oxides and trace element geochemical analyses; 15 samples were also prepared for isotopic analyses. One sample was prepared for 40Ar/39Ar analyses at the Servicio Nacional de Geología y Minería, Chile (SERNAGEOMIN) (additional information is given in Appendix - C2-1). Geochemical analyses of major and trace elements were carried out at Acme Analytical Laboratories Ltd. (ACMElab; Canada) with Inductively Coupled Plasma-Optical Emission Spectrometry (ICP-OES) and Mass Spectrometry (ICP-MS), at Activation Laboratories Ltd. (Actlabs; Canada) with ICP-OES and ICP-MS, and at the University of Cape Town (South Africa) with X-ray fluorescence (XRF). Sr-, Nd- and Pb-isotope analysis were performed at the “Istituto di Geoscienze e Georisorse” - National Research Council (IGG-CNR) in Pisa (Italy) with a TIMS Finnigan MAT 262, and at the University of Cape Town (South Africa) using a NuPlasma HR multicollector-ICP-MS (MC-ICP-MS). A detailed description of the analytical methods is reported in Appendix - C2-1.
2.4. Results
All the sampled and investigated volcanic products were classified based on major oxides whole rock compositions (Table 2.1, from Taussi et al., 2019) and modal mineralogy. All the compositions reported below are normalized to an anhydrous base. Geochronological analysis on the andesitic lava flow outcropping on the Apacheta volcano (Fig. 2.1b) returned a value of 0.97 ± 0.11 Ma, thus in agreement with the Apacheta activity phase. Detailed geochronological results from Taussi et al., (2019) are given in Appendix - C2-2.
2.4.1 Petrography and mineral assemblages
2.4.1.1 Apacheta-Aguilucho Volcanic Complex lavas
The AAVC is mainly characterized by extrusives of the high-K calc-alkaline series (andesites to rhyolites; Fig. 2.2). Andesites (57.7-62.4 wt% SiO2) show a porphyritic index (P.I.) ranging from 10 to 25 vol.%, with a modal mineralogy consisting of plagioclase, orthopyroxene, clinopyroxene, amphibole, biotite, Fe-Ti oxides and rare olivine. Subhedral olivine, mostly replaced by goethite, hematite and clay minerals (i.e. iddingsite), is found in the less silicic sample (AA-047). Plagioclases have variable sizes; bigger sized crystals (1-2 mm) show resorption and sieve textures with intense zoning, while smaller crystals (<1 mm) generally do not show these textures. Groundmass is micro- to cryptocrystalline to glassy, with the same mineralogical paragenesis as phenocrysts. Dacites (63.1-65.4 wt% SiO2) are the most abundant products of the AAVC; they are partially vesiculated with porphyritic textures (P.I. = 10-20 vol.%), and contain plagioclase, amphibole, biotite, sanidine, quartz, clinopyroxene, orthopyroxene and Fe-Ti oxides, in decreasing order of abundance. Plagioclase frequently shows disequilibrium features, such as sieve textures and zonings. Amphibole and biotite are
25
often characterized by breakdown rims consisting of plagioclase, pyroxene ± oxides. Groundmass varies from micro- to cryptocrystalline and consists of plagioclase, alkaline feldspar, and amphibole microlites. Rhyolitic composition is represented only by sample AA-064, which is the most evolved magma erupted in the AAVC (69.6 wt% SiO2). It has a porphyritic texture (P.I. = 20 vol.%) with convoluted banded textures consisting of lighter and darker-coloured sections. The modal mineralogy is represented by plagioclase, sanidine, amphibole, quartz, biotite, orthopyroxene, clinopyroxene, Fe-Ti oxides and titanite as accessory phase. The groundmass is micro-cryptocrystalline with interstitial devitrified glass and a locally pilotaxitic texture. Plagioclase phenocrysts show inverse and oscillatory zoning. Quartz crystals show rounded edges and are sometimes strongly embayed. Clinopyroxenes represent the most abundant mafic phase. Hydrous minerals are always affected by breakdown textures or secondary alteration processes.
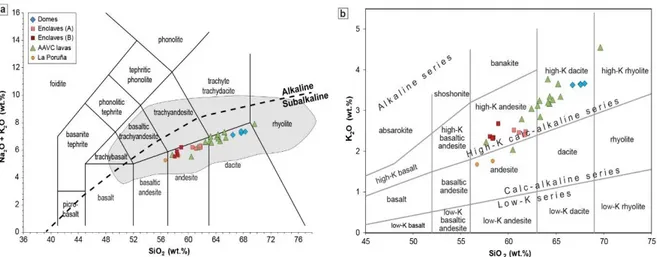
Figure 2.2 - a) Total-Alkali vs. Silica (TAS) diagram for sampled lavas of the
Apacheta-Aguilucho Volcanic Complex, and the domes and enclaves therein (after Le Bas et al., 1986). Lava samples show a well-defined trend, varying from andesitic to rhyolitic in composition; b) K2O vs. SiO2 diagram for the same samples as in a) (after Peccerillo and Taylor, 1976). Samples SP1 (Mamani et al., 2008) and POR-10-01 (Godoy et al., 2014) from La Poruña scoria cone are also shown. The grey field represents the composition of Central Andes lavas (after Mamani et al., 2010); while the dashed line separates alkaline and sub-alkaline lavas (after Irvine and Baragar, 1971). Figure modified from Taussi et al. (2019).
2.4.1.2 Domes
Chanka, Chac-Inca and Pabellón domes are classified as high-K dacites (66.7-68.0 wt% SiO2; 3.6-3.7 wt% K2O; Fig. 2.2) with a porphyritic and partially seriate texture (P.I. = 16-23 vol.%). The phenocrysts, in order of abundance, consist of plagioclase, amphibole, biotite, quartz, pyroxene, titanite and Fe-Ti oxides, plus micro-phenocrysts of apatite and zircon as accessory phases (Fig. 2.3a). The groundmasses are micro-cryptocrystalline (with the same mineral assemblage as the phenocrysts), slightly glassy and characterized by perlitic cracks and interstitial devitrified glass. Plagioclase phenocrysts are variable in size with oscillatory
26
zoning, sometimes with coarse-sieve textures and smooth edges (Fig. 2.3b). Besides the frequent enclaves, the dacitic domes contain portions of a “cryptic” mafic-intermediate component characterized by microlites mainly consisting of plagioclase and amphibole (Fig. 2.3c). Quartz crystals have rounded edges. Hydrous minerals show euhedral to subhedral habits, with the larger sized crystals (up to 2 mm) sometimes affected by intense breakdown that occasionally replaces the entire mineral with pseudomorph assemblages made of plagioclase + pyroxene ± oxides. Accessory phases are frequently hosted as inclusions in hydrous minerals. The contact between the dacite and the enclaves is irregular, crenulated and cuspidate (Fig. 2.3d).
Figure 2.3 - Photomicrographs showing typical textures of the dacitic domes. a) a
representative mineral assemblage composed of a micro-cryptocrystalline groundmass with abundant plagioclase (plg), amphibole (amp) and biotite (bt); b) plagioclase phenocrysts of variable sizes locally showing coarse-sieve texture and smooth edges, the contact between the hosting dacite and the andesitic enclave is also highlighted; c) portions of groundmass microlites mainly consisting of plagioclase and amphibole, texturally compatible with the andesitic enclaves; d) an irregular, crenulated and cuspidate contact between the hosting dacite and the andesitic enclave. Figure from Taussi et al. (2019).
27
2.4.1.3 Micro-vesiculated enclaves
All the lava domes contain frequent fine-grained and micro-vesiculated high-K andesitic enclaves (58.1-61.8 wt% SiO2; 2.3-2.7 K2O; Fig. 2.2b). They range from 2 up to 20 cm (Fig. 2.4a,b) in size and show a very low P.I. (3-5 vol.%). Different colouration on a mesoscopic scale can be found even within the same enclave (Fig. 2.4c). This is probably due to differences in content and degree of interconnection of the vesicles, since no geochemical (see Table 2.1 for sample CKA1a_ch lighter portion, CKA1b_sc, darker portion of the enclave), mineralogical or petrographic variations were recognized (e.g. modal mineralogy; core-to-rim variations in crystallinity). The crystal assemblage of the enclaves consists of plagioclase, pyroxene, amphibole, biotite, olivine and quartz. The groundmass is characterized by quenched and acicular phases of plagioclase, pyroxene, amphibole and rare biotite and Fe-Ti oxides, arranged in a diktytaxitic-like texture. This texture is constituted by abundant angular interstitial gas cavities between the plagioclase laths (Fig. 2.4d) and variable amount of glass. Although the general mineral assemblages are almost the same for all the analysed enclaves, we observed some peculiar differences which have allowed to distinguish two petrographic types independent of the size of the enclave. The first type, “Type-A” (Fig. 2.4d,e,f), show a very fine-grained texture with small and acicular micro-phenocrysts and widespread vesicles. Xenocrysts assemblages are mostly represented by embayed quartz with rim overgrowths of pyroxene and amphibole, and large-sized plagioclases (up to 3 mm) with sieve textures limited to crystal rims or absent. Olivine crystals are scarce or absent in these enclaves. The second type of micro-vesiculated enclaves, “Type-B” (Fig. 2.4g), show a slightly coarser texture and are mainly characterized by plagioclase xenocrysts with extensive sieve and resorbed textures, and the presence of olivine phenocrysts. Scarce or no quartz xenocrysts is recognized among this type.
28
Figure 2.4 - Micro-vesiculated enclaves within the dacitic domes and photomicrographs
showing typical petrographic textures; a) and b) show enclaves of different sizes; c) shows colour difference inside the enclaves themselves, dashed red line mark the contact between the enclave (E) and the dacite (D); d) microphotograph showing the diktytaxitic-like texture of the groundmass of the enclaves with angular vesicles (ves) between plagioclase (plg) and amphibole (amp) laths; e) microphotograph showing a very fine-grained micro-vesiculated groundmass with orthopyroxene (opx) phenocrysts (Type-A enclave); f) microphotograph showing large sized plagioclases with no sieve textures and embayed quartz (qz) in a very-fine micro-vesiculated groundmass of a Type-A enclave; g) microphotograph showing olivine phenocrysts and plagioclase with extensive sieve and resorbed textures in a slightly coarser groundmass, typical of Type-B enclaves. Figure from Taussi et al. (2019).
2.4.2 Data on major-trace element and Sr-Nd-Pb isotopes
29 Table 2.1
Major and trace element compositions of domes, enclaves and lava samples from the Apacheta-Aguilucho Volcanic Complex area.
Location Chanka Chac-Inca
Sample CKA1 CKA1a_ch CKA1a_sc C-INKA1 C-INKA1f Unit Dacite Enclave (A) Enclave (A) Dacite Enclave (A) Age 0.1198 ± 0.054 Ma1 0.114 ± 0.37 Ma2 Coordinates WGS84 19S 569389 569383 569383 582287 582120 7589334 7589771 7589771 7587947 7587957 Major oxides (wt%) SiO2 65.81 59.62 59.99 66.92 61.02 Al2O3 15.08 16.38 15.85 14.98 16.03 Fe2O3(tot) 3.29 6.18 6.11 4.22 5.63 MgO 1.47 3.32 3.37 1.54 3.29 CaO 3.39 5.57 5.62 3.49 5.54 Na2O 3.54 3.60 3.56 3.58 3.84 K2O 3.55 2.48 2.42 3.60 2.38 TiO2 0.46 0.83 0.84 0.50 0.78 P2O5 0.12 0.29 0.28 0.12 0.22 MnO 0.06 0.09 0.09 0.07 0.08 LOI 1.99 1.09 1.55 0.48 1.29 Sum 98.75 99.45 99.67 99.50 100.11 Trace elements (ppm) V 70 144 141 81 139 Cr 90 90 40 70 Co 7.0 15 15 8.0 14 Ga 18 19 20 17 20 Rb 175 73 73 181 63 Sr 342 526 533 366 580 Y 13 15 14 13 13 Zr 139 161 155 147 169 Nb 10 8.0 8.0 10 7.0 Sn 2.0 2.0 1.0 2.0 1.0 Cs 13 3.3 3.1 13 2.2 Ba 671 794 809 692 829 La 32 26 26 35 29 Ce 61 53 54 66 58 Pr 6.5 6.2 6.2 7.0 6.7 Nd 22 23 23 24 25 Sm 3.9 4.6 4.6 4.5 4.9 Eu 0.83 1.1 1.2 0.83 1.2 Gd 3.0 3.8 4.1 3.2 3.8 Tb 0.40 0.50 0.60 0.50 0.50 Dy 2.4 3.0 3.0 2.6 2.9 Ho 0.50 0.50 0.50 0.50 0.50 Er 1.3 1.4 1.5 1.4 1.5 Tm 0.18 0.19 0.19 0.21 0.20 Yb 1.4 1.3 1.3 1.4 1.3 Lu 0.23 0.20 0.22 0.22 0.21 Hf 3.8 3.8 3.7 4.4 4.0 Ta 1.4 0.70 0.70 1.3 0.60 Tl 0.80 0.40 0.40 0.90 0.30 Th 32 9.5 9.3 32 7.2 U 11 3.1 2.9 10 2.1 Be 3.0 2.0 2.0 3.0 2.0 Ni 20 40 Cu 10 20 20 20 Zn 60 90 80 70 90 As 12 7.0 10 12 Pb 20 12 12 21 12 Sc 7.0 14 14 8.0 14
30 Table 2.1
(continued)
Location Cerro Pabellón
Sample AA003 CPB1 AA001 ICP16 ICP22 ICP24
Unit Dacite Dacite Enclave (B) Enclave (B) Enclave (A) Enclave (B)
Age 0.08 - 0.13 Ma3 Coordinates WGS84 19S 587826 587232 587826 587562 587562 587562 7584239 7584266 7585104 7584075 7584075 7584075 Major oxides (wt%) SiO2 64.80 66.37 57.33 57.33 61.69 57.23 Al2O3 15.49 15.12 17.06 15.98 16.46 16.22 Fe2O3(tot) 3.90 3.55 6.22 7.35 5.93 7.31 MgO 1.71 1.60 3.66 4.68 3.10 4.01 CaO 3.53 3.65 5.72 6.84 5.32 6.57 Na2O 3.41 3.65 3.42 3.14 3.70 3.25 K2O 3.53 3.56 2.60 2.33 2.48 2.29 TiO2 0.54 0.47 0.89 0.76 0.82 0.78 P2O5 0.15 0.14 0.25 0.20 0.22 0.17 MnO 0.06 0.06 0.09 0.11 0.08 0.11 LOI 3.11 1.67 1.89 1.16 0.96 1.01 Sum 100.23 99.84 99.13 99.88 100.76 98.95 Trace elements (ppm) V 87 73 157 176 138 171 Cr 20 24 80 210 80 80 Co 9.0 7.0 16 22 14 18 Ga 20 18 23 17 19 18 Rb 191 172 85 85 81 74 Sr 376 354 630 503 601 542 Y 11 13 14 15 13 16 Zr 139 152 163 120 164 137 Nb 11 12 8.0 6.0 8.0 6.0 Sn 2.0 2.0 2.0 1.0 2.0 2.0 Cs 13 14 3.1 3.5 3.3 3.1 Ba 707 688 813 581 812 667 La 35 32 29 19 28 26 Ce 66 57 59 41 59 50 Pr 6.2 6.3 6.3 4.6 6.8 5.6 Nd 24 22 27 18 25 21 Sm 3.9 4.1 5.1 3.8 4.9 4.2 Eu 0.89 0.83 1.3 1.0 1.2 1.1 Gd 3.1 3.0 4.0 3.3 3.7 3.6 Tb 0.50 0.40 0.60 0.60 0.50 0.60 Dy 2.6 2.6 3.0 3.1 2.8 3.3 Ho 0.50 0.50 0.60 0.60 0.50 0.60 Er 1.4 1.4 1.6 1.7 1.4 1.8 Tm 0.21 0.22 0.22 0.25 0.20 0.28 Yb 1.4 1.4 1.4 1.7 1.3 1.9 Lu 0.22 0.22 0.21 0.26 0.21 0.29 Hf 3.9 4.8 4.2 3.1 4.2 3.4 Ta 1.4 1.4 0.70 0.50 0.60 0.60 Tl 1.2 1.1 0.70 0.40 0.30 0.40 Th 30 31 8.6 6.7 8.3 8.0 U 10 10 2.5 2.1 2.5 2.4 Be 3.0 2.0 1.0 2.0 2.0 Ni 40 20 20 Cu 20 20 30 30 40 Zn 60 100 90 100 90 As 7.0 14 6.0 6.0 5.0 Pb 13 8.0 11 20 11 Sc 7.0 15 21 14 21
31 Table 2.1
(continued)
Outcrop Cerro
Pabellón Apacheta - Aguilucho Volcanic Complex
Sample CPAB-ENC-1 AA-007 AA-023 AA-024 AA-047 AA-050 Unit Enclave (B) Dacite Andesite Dacite Andesite Dacite
Age 0.91 ± 0.14 Ma2 Middle Pleistocene4 0.91 ± 0.14 Ma2 0.97 ± 0.11 Ma5 0.91 ± 0.14 Ma2 Coordinates WGS84 19S 587081 588670 586495 586495 584937 587346 7585275 7586793 7585794 7585794 7584092 7579885 Major oxides (wt%) SiO2 57.06 62.05 61.31 62.10 56.22 63.92 Al2O3 16.77 16.47 17.02 16.69 18.07 16.48 Fe2O3(tot) 6.65 5.09 5.21 5.13 6.59 4.62 MgO 4.01 2.29 2.27 2.25 3.18 2.07 CaO 6.32 4.69 4.92 4.82 6.76 4.32 Na2O 3.50 3.60 3.49 3.45 3.35 3.79 K2O 2.26 2.79 2.99 3.07 2.16 3.32 TiO2 0.84 0.73 0.72 0.69 0.78 0.63 P2O5 0.24 0.19 0.18 0.19 0.24 0.15 MnO 0.09 0.08 0.08 0.08 0.11 0.07 LOI 1.19 1.01 1.60 1.30 2.30 0.40 Sum 98.93 98.99 99.79 99.77 99.76 99.77 Trace elements (ppm) V 161 117 107 100.00 155 77 Cr 101 20 20 Co 49 12 11 11 18 9.9 Ga 20 19 19 19 19 Rb 64 113 122 123 104 139 Sr 641 444 466 450 551 448 Y 19 21 19 18 19 15 Zr 174 173 181 187 147 159 Nb 12 11 12 13 8.0 11 Sn 1.0 1.0 2.0 2.0 2.0 Cs 3.9 7.4 7.1 2.6 5.6 Ba 933 742 679 683 607 655 La 39 33 32 21 30 Ce 78 64 60 41 56 Pr 8.2 8.0 7.7 5.3 6.9 Nd 33 29 28 21 23 Sm 6.0 5.2 5.0 4.0 4.3 Eu 1.2 1.0 1.0 1.0 0.92 Gd 4.9 4.7 4.4 4.0 3.4 Tb 0.70 0.66 0.63 0.61 0.54 Dy 4.0 3.9 3.5 3.7 2.9 Ho 0.80 0.67 0.66 0.80 0.54 Er 2.2 2.0 1.7 2.2 1.5 Tm 0.33 0.33 0.31 0.36 0.25 Yb 2.1 1.9 1.9 2.3 1.6 Lu 0.29 0.29 0.27 0.32 0.24 Hf 4.7 5.6 4.8 3.7 4.4 Ta 1.3 1.2 1.4 0.60 1.2 Tl 0.50 Th 23 23 22 5.9 23 U 7.5 7.7 7.9 1.2 7.8 Be 2.0 2.0 2.0 2.0 1.0 Ni 12 2.4 1.8 6.0 1.8 Cu 24 40 17 12 33 9.3 Zn 83 90 27 23 30 16 As 1.3 1.5 Pb 9 Sc 23 12
32 Table 2.1
(continued)
Outcrop Apacheta - Aguilucho Volcanic Complex
Sample AA-054 AA-055 AA-056 AA-058 AA-064 AA-067 Unit Dacite Dacite Dacite Dacite Rhyolite Andesite Age 0.91 ± 0.14 Ma2 0.91 ± 0.14 Ma2 Lower Pleistocene4 0.70 ± 0.2 Ma2 Middle Pleistocene4 0.97 ± 0.11 Ma5 Coordinates WGS84 19S 586848 586588 582845 579850 580225 581521 7581446 7582077 7578792 7584178 7583868 7583555 Major oxides (wt%) SiO2 63.33 63.85 62.08 63.98 68.44 58.49 Al2O3 16.52 16.23 16.65 16.58 14.75 18.12 Fe2O3(tot) 4.58 4.11 4.61 4.71 2.87 6.10 MgO 1.92 1.86 2.30 2.11 1.15 1.29 CaO 4.30 3.92 4.78 4.49 2.78 4.22 Na2O 3.33 3.57 3.68 3.78 3.32 3.26 K2O 3.19 3.57 3.18 3.17 4.46 2.66 TiO2 0.59 0.57 0.64 0.63 0.38 0.88 P2O5 0.17 0.13 0.15 0.15 0.08 0.24 MnO 0.07 0.07 0.07 0.07 0.06 0.04 LOI 1.80 1.90 1.60 0.10 1.50 4.50 Sum 99.80 99.78 99.74 99.77 99.79 99.80 Trace elements (ppm) V 94 109 129 127 78 80 Cr 21 34 21 Co 9.3 9.9 12 12 6.1 13 Ga 19 19 21 20 19 20 Rb 147 179 129 152 293 80 Sr 418 409 507 467 273 435 Y 18 20 18 19 23 17 Zr 192 180 167 171 189 153 Nb 14 13 11 12 18 9.1 Sn 3.0 2.0 2.0 2.0 3.0 7.0 Cs 11 13 9.0 6.9 25 1.1 Ba 628 680 743 696 541 659 La 35 35 31 33 52 22 Ce 66 69 61 65 98 45 Pr 8.2 8.4 7.5 7.9 11 5.9 Nd 29 27 25 27 34 22 Sm 5.0 5.0 4.8 4.9 5.6 4.3 Eu 0.96 0.95 1.0 1.0 0.80 1.2 Gd 4.5 4.0 3.7 4.0 4.4 3.7 Tb 0.61 0.67 0.61 0.66 0.72 0.60 Dy 3.3 3.4 3.4 3.4 3.7 3.1 Ho 0.62 0.66 0.62 0.68 0.78 0.65 Er 1.9 1.9 1.7 1.9 2.2 1.8 Tm 0.31 0.32 0.29 0.32 0.37 0.28 Yb 1.8 2.0 1.8 2.1 2.4 1.7 Lu 0.29 0.29 0.27 0.30 0.37 0.24 Hf 5.4 5.8 5.2 5.5 7.0 4.4 Ta 1.6 1.5 1.0 1.3 2.4 0.60 Tl 0.20 0.20 0.20 Th 32 33 21 25 57 4.5 U 10 12 7.4 9.1 23 1.2 Be 3.0 2.0 1.0 2.0 4.0 1.0 Ni 3.7 3.1 2.7 4.4 3.2 6.5 Cu 11 17 17 20 19 45 Zn 38 33 30 25 18 32 As 0.80 0.80 1.3 Pb Sc
33 Table 2.1
(continued)
Apacheta - Aguilucho Volcanic Complex
Sample AA-077 AA-081 AA-083 AA-094 Unit Dacite Dacite Dacite Andesite Age Pleistocene4 0.652 ± 0.012 Ma4 Pleistocene4 1.024 ± 0.033 Ma4 Coordinates WGS84 19S 581045 582405 584711 579434 7585154 7587497 7585422 7579884 Major oxides (wt%) SiO2 62.80 63.15 64.65 59.97 Al2O3 16.21 16.26 15.90 16.65 Fe2O3(tot) 4.53 4.61 4.28 6.12 MgO 2.10 2.07 2.05 3.97 CaO 4.53 4.60 4.30 6.03 Na2O 3.57 3.15 3.52 3.46 K2O 3.10 3.70 3.29 2.02 TiO2 0.61 0.67 0.58 0.75 P2O5 0.15 0.17 0.15 0.16 MnO 0.07 0.07 0.07 0.10 LOI 2.10 1.30 1.00 0.50 Sum 99.77 99.75 99.79 99.73 Trace elements (ppm) V 109 118 106 122 Cr 27 14 103 Co 11 11 10 17 Ga 19 20 19 19 Rb 158 169 173 85 Sr 451 475 418 437 Y 19 21 18 20 Zr 161 175 173 156 Nb 12 13 13 11 Sn 2.0 2.0 2.0 4.0 Cs 11 11 13 7.9 Ba 683 737 681 570 La 31 35 36 28 Ce 63 69 70 57 Pr 7.5 8.5 8.2 7.1 Nd 24 28 27 23 Sm 4.7 5.3 4.9 4.9 Eu 0.99 1.1 0.99 1.0 Gd 3.9 4.4 3.8 4.2 Tb 0.64 0.71 0.60 0.70 Dy 3.3 3.5 3.3 3.8 Ho 0.66 0.71 0.60 0.73 Er 1.7 2.1 1.7 2.0 Tm 0.28 0.34 0.26 0.32 Yb 1.9 2.0 1.7 2.0 Lu 0.27 0.32 0.25 0.29 Hf 5.3 5.1 5.4 5.4 Ta 1.2 1.2 1.4 0.90 Tl Th 24 26 31 17 U 8.9 8.9 10 5.8 Be 2.0 2.0 2.0 3.0 Ni 2.0 2.4 2.8 4.0 Cu 16 12 18 25 Zn 16 33 28 11 As 0.90 0.90 Pb Sc
Ages from: 1 - Tierney et al. (2016); 2 - Rivera et al. (2015); 3 - Renzulli et al. (2006); 4 - Sellés and Gardeweld (2017); 5 - Taussi et al. (2019)
(A) and (B) indicates Type-A and Type-B enclaves, respectively Values not shown were not analysed or are below the detection limit.
34
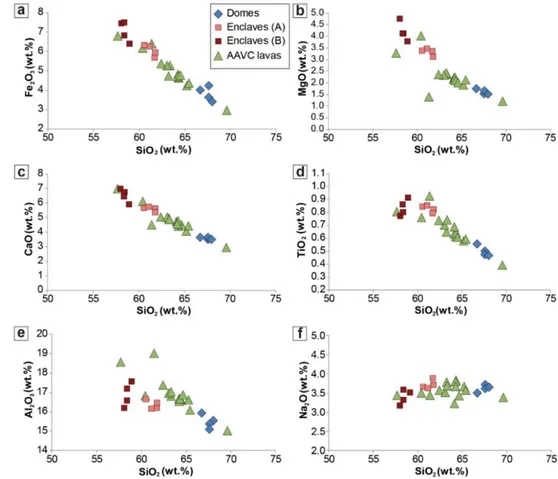
Lavas from AAVC and from the domes, including the enclaves, display a broad range in SiO2 content, from 57.7 to 69.6 wt%, and relatively low MgO contents (<5 wt%), with the higher MgO values for the enclaves (3.1-4.7 wt%) and for sample AA-094 (4.0 wt%). Almost all the samples studied (lavas, domes and enclaves) form a uniform trend in most of the bivariate diagrams (Figs. 2.5 and 2.6). There is an evident gap in SiO2 content between the enclaves and the domes (~4.0 wt%), which is filled by the dacites of the AAVC. SiO2 has a negative correlation with Fe2O3 (Fig. 2.5a), MnO (not shown), MgO (Fig. 2.5b) and CaO (Fig. 2.5c). TiO2 and Al2O3 show negative correlations in lavas and domes (Fig. 2.5d,e); in the enclaves an initial increase in TiO2 and Al2O3 in the less differentiated samples (<59 wt% SiO2; Type-B enclaves) is followed by a decrease in the more evolved ones (Type-A enclaves). Na2O vs. SiO2 (Fig. 2.5f) shows an almost flat pattern, while P2O5 vs. SiO2 diagram shows a scattered trend (not shown). K2O shows a positive correlation with SiO2 in the AAVC lavas, showing almost the same values for all the enclaves (2.3-2.7 wt%) and all the domes (3.6-3.7 wt%) (Fig. 2.2b).
Figure 2.5 - Major oxides vs. SiO2 diagrams for sampled lavas of the Apacheta-Aguilucho
Volcanic Complex, domes and enclaves therein. Figure from Taussi et al. (2019).
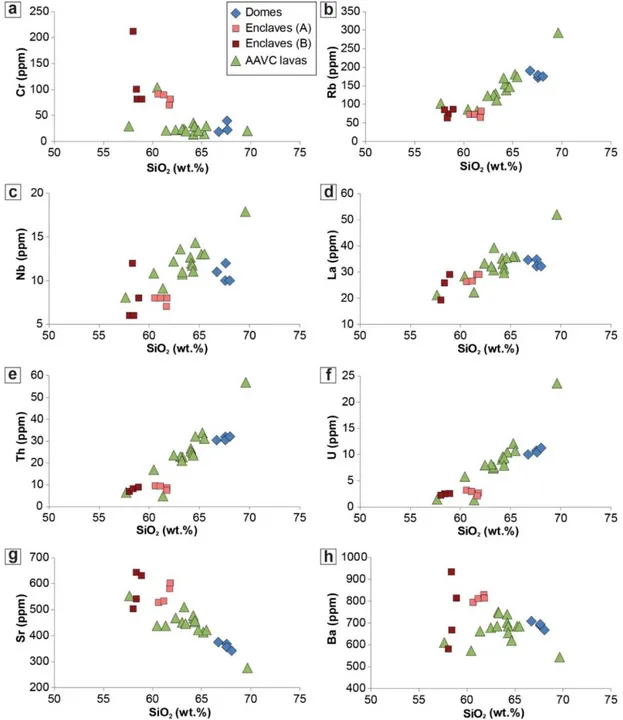
Selected trace element against SiO2 concentrations are reported in Figure 2.6. In the enclaves-domes series, Cr content decreases from the enclaves toward the dome lavas (Fig.
35
2.6a), whereas Rb, Nb, La, Th and U have a positive correlation with SiO2 (Fig. 2.6b,c,d,e,f). Sr and Ba show similar patterns with an initial scattered pattern in the less differentiated samples (<59 wt% SiO2), followed by an abrupt decrease toward the most differentiated products (Fig. 2.6g,h). In the AAVC lavas, Sr shows a general decrease (in absolute values) from the andesites to the rhyolite, but an almost stable plateau for the dacites (Fig. 2.6g). Rb, Nb, La, Th and U increase in concentrations with SiO2 enrichment (Fig. 2.6b,c,d,e,f) while Ba shows no correlation (Fig. 2.6h).
Figure 2.6 - Trace elements vs SiO2 diagrams for sampled lavas of the Apacheta-Aguilucho
36
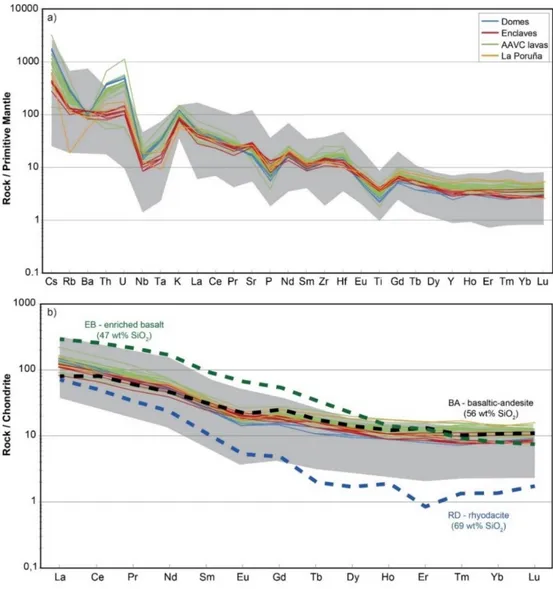
Concerning the patterns of the incompatible elements and REE (normalized to Primitive Mantle and Chondrite, respectively; Fig. 2.7), all the studied samples are within the range of the Central Volcanic Zone field (Mamani et al., 2010). They exhibit a marked enrichment in Cs, Rb, K, Th and U, combined with a marked depletion in Nb, Ta, P and Ti, and a flatter pattern of REE (low LREE/HREE) than most of the other erupted products in the Central Volcanic Zone (Mamani et al., 2010). Their low LREE/HREE ratios are relatively similar to that of the Basaltic-Andesite (BA) end-member (Blum-Oeste and Wörner, 2016), which has been linked to an evolved product of a typical primary arc magma that is generally ubiquitous in the sub-Andean mantle wedge.
Figure 2.7 - a) Trace elements normalized to primitive mantle, and b) REE normalized to
chondritic values (after Sun and McDonough, 1989) for representative lava samples of Apacheta-Aguilucho Volcanic Complex (green lines), dacitic domes (blue lines), the enclaves (red lines) and La Poruña scoria cone samples from Mamani et al. (2008) and Godoy et al. (2014) (orange lines). Grey areas represent normalized compositions of lavas erupted in the Central Volcanic Zone of the Andes (data after Mamani et al., 2010). End-members for the Central Andean magmatism as defined by Blum-Oeste and Wörner (2016) are shown by thick dashed lines (EB, enriched basalt in green; BA, basaltic-andesite in black; RD, rhyodacite in blue). Figure from supplementary material in Taussi et al. (2019).