International Journal of n. 1, pp. 3 Received: July 19, 2015
This paper attempts to answer the question whether people consider
equal outcomes fair. I find that this is not always the case. In an experiment where subjects are given equal opportunities to choose how to divide money between each other in a two player game, any strategy is perceived to be fair
maximizing strategy. The equal divisions that lead to equal outcomes are sometimes considered unfair by both players. Moreover, players frequently punished the others, whose decisions led to equal outcomes. I h
have different conceptions of what a fair outcome and fair punishment are.
Keywords: Fairness, Equal outcomes, Effort.
1. Introduction
This paper looks into people’s conceptions of fairness with regard to economic decision making. Concern for fairness is important because it stimulates people to deviate from self interest and profit maximization if it leads to unfairness and punish others at the cos themselves (Rabin, 1993; Fehr and Schmidt, 1999;
2000; Falk and Fischbacher, 2006).
assumption that equal outcomes are fair or, at least, the less is the
outcomes, the fairer they are. It is also assumed in many experiments that equal or the most equal outcome available is fair
al, 2011; Sheskin et al, 2014).
The problems with equal outcomes not always being fair have been addressed as early as Nash (1950). People may value things that they are dividing differently, have different beliefs about preferences of other people (Yaari and Bar
and ideas of fairness (Charness and Rabin, 2002), or perceive intentions of others diff (Falk et al, 2008). In their paper criticizing mainstream theories of fairness
Levine (2012) argue that what is fair for one person may not rewards are not certain.
There are some empirical
Baumard et al (2012) build an experiment with young children where participants have to
International Journal of Economic Behavior, vol 5, n. 1, pp. 133
International Journal of n. 1, pp. 3-14, 201
IS EQUALITY
ARTHUR TARASOV
Maria Curie-Sklodowska University, Poland
Accepted: Nov 2, 2015 Online Published:
Abstract
This paper attempts to answer the question whether people consider decisions that lead to equal outcomes fair. I find that this is not always the case. In an experiment where subjects are given equal opportunities to choose how to divide money between each other in a two player game, any strategy is perceived to be fair more than half the time, including the profit maximizing strategy. The equal divisions that lead to equal outcomes are sometimes considered unfair by both players. Moreover, players frequently punished the others, whose decisions led to equal outcomes. I hypothesize that such punishments occur because people have different conceptions of what a fair outcome and fair punishment are.
outcomes, Reciprocal punishment, Fair division,
looks into people’s conceptions of fairness with regard to economic decision making. Concern for fairness is important because it stimulates people to deviate from self interest and profit maximization if it leads to unfairness and punish others at the cos
Fehr and Schmidt, 1999; Bolton and Ockenfels, 2000; Nowak et al, 2000; Falk and Fischbacher, 2006). Most theories, including the ones cited above rely on an assumption that equal outcomes are fair or, at least, the less is the difference between outcomes, the fairer they are. It is also assumed in many experiments that equal or the most equal outcome available is fair (Thaler, 1988; Güth et al, 2001; Henrich et al, 2010
.
ith equal outcomes not always being fair have been addressed as early as Nash (1950). People may value things that they are dividing differently, have different beliefs about preferences of other people (Yaari and Bar-Hillel, 1984), have different social v and ideas of fairness (Charness and Rabin, 2002), or perceive intentions of others diff
In their paper criticizing mainstream theories of fairness
that what is fair for one person may not be fair for the other person if the some empirical studies where equality is not a direct measure
an experiment with young children where participants have to
ournal of Economic Behavior, vol 5, n. 1, pp. 133
QUALITY FAIR?
ARTHUR TARASOV
Sklodowska University, Poland
Online Published: Nov 30, 2015
decisions that lead to equal outcomes fair. I find that this is not always the case. In an experiment where subjects are given equal opportunities to choose how to divide money between each other in a
two-more than half the time, including the profit-maximizing strategy. The equal divisions that lead to equal outcomes are sometimes considered unfair by both players. Moreover, players frequently punished the others, whose ypothesize that such punishments occur because people have different conceptions of what a fair outcome and fair punishment are.
division, Social values,
looks into people’s conceptions of fairness with regard to economic decision making. Concern for fairness is important because it stimulates people to deviate from self-interest and profit maximization if it leads to unfairness and punish others at the cost to
Bolton and Ockenfels, 2000; Nowak et al, Most theories, including the ones cited above rely on an difference between outcomes, the fairer they are. It is also assumed in many experiments that equal or the most (Thaler, 1988; Güth et al, 2001; Henrich et al, 2010; LoBue et ith equal outcomes not always being fair have been addressed as early as Nash (1950). People may value things that they are dividing differently, have different beliefs Hillel, 1984), have different social values and ideas of fairness (Charness and Rabin, 2002), or perceive intentions of others differently In their paper criticizing mainstream theories of fairness, Fudenberg and be fair for the other person if the measure of fairness. an experiment with young children where participants have to
make an effort before distributing rewards. Dividing the rewards according to the participants’ contribution is considered fair. In another experiment with young children, Castelli et al (2014) show that some participants consider advantageously inequitable offers fair.
In their experiment on fairness and cheating involving the dictator game, Houser et al (2012) measure fairness objectively and subjectively. The subjective measure of fairness is a survey where participants are asked how fair in their opinion the division of money was. The objective measure is based on empirical results of the ultimatum game previously played in other experiments (Camerer, 2003). Remarkably, many responders consider divisions below even split to be fair. I.e. some participants think it is fair for the other person to take most of the money.
Interesting debate about fairness takes place in the field of information technology where multiple resources can be allocated according to various criteria, many of which are fair from different perspectives (Ghodsi et al, 2011). Luckily, computer systems have no emotions (yet) and the fair outcome is simply the most efficient one.
In another experimental study Durante et al (2014) show that fair or preferred level of redistribution of wealth within a society depends on task performance. The authors find that inequality in income stemming from differences in knowledge or skill is often considered fair.
Roemer (1998) and Devooght (2008) argue that inequality originating from factors like education or effort is fair, while inequality that stems from circumstantial factors like race, gender, or chance is unfair. Yet, it is easy to imagine how in some social groups people would consider a certain race to be privileged and racial equality to be unfair and even unthinkable. Using Roemer’s (1998) and Devooght’s (2008) ideas, Figueiredo and Netto (2014) in their macroeconomic study find that increased equality in Brazilian society does not translate into increased fairness within the society.
I conduct an experiment to specifically test whether people may consider equal outcomes unfair and willing to punish the others for dividing money equally with them. I designed a game where two players get to divide one money pool each and then have a chance to punish the other player by reducing the other player’s outcome at the cost of own outcome. The game contains loaded language and attempts to test how various settings affect fairness preferences of participants. Section 2 describes the design of the game. Formal models are moved to appendices at the end of the paper.
The results show that people’s fairness conceptions vary considerably and decisions to divide money equally are considered fair about as often as decisions to maximize outcome. The results are discussed in detail in section 3.
2. Experimental design
Subjects play a two-player game where each player is given a pool of money and has to decide how to divide it between herself and the other player. The other player makes the same decision simultaneously. Both players observe each other’s decisions after the money pools are divided. In the second stage of the game, each player has an opportunity to impose a costly punishment upon the other player by reducing both players’ outcomes by the same percentage.
2.1. The Game of Division and Punishment: Stage 1
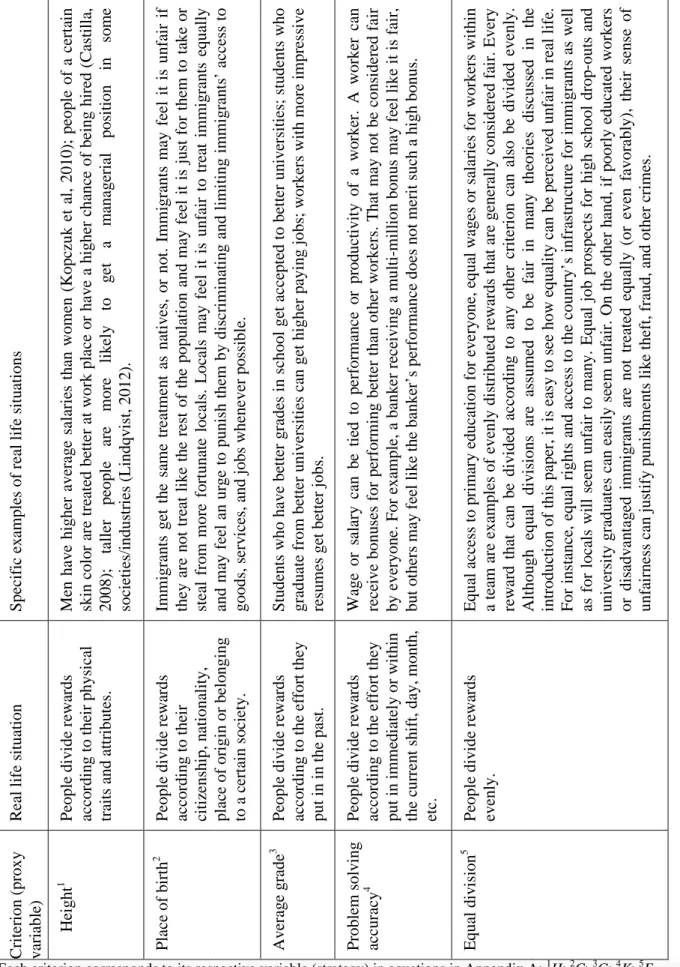
Player 1 and player 2 divide their respective equal pools of money proportionally to one of the criteria that are relevant to real life situations. Among these criteria can be any traits, merits, or efforts that people value. The criteria I chose are described in Table 1.
International Journal of n. 1, pp. 3
Table 1 – The criteria for division of money in the first stage of the game
S p ec if ic e x am p le s o f re al l if e si tu at io n s M en h av e h ig h er a v er ag e sa la ri es t h an w o m en ( K o p cz u k e t al , 2 0 1 0 ); p eo p le o f a ce rt ai n sk in c o lo r ar e tr ea te d b et te r at w o rk p la ce o r h av e a h ig h er c h an ce o f b ei n g h ir ed ( C as ti ll a, 2 0 0 8 ); ta ll er p eo p le ar e m o re li k el y to g et a m an ag er ia l p o si ti o n in so m e so ci et ie s/ in d u st ri es ( L in d q v is t, 2 0 1 2 ). Im m ig ra n ts g et t h e sa m e tr ea tm en t as n at iv es , o r n o t. I m m ig ra n ts m ay f ee l it i s u n fa ir i f th ey a re n o t tr ea t li k e th e re st o f th e p o p u la ti o n a n d m ay f ee l it i s ju st f o r th em t o t ak e o r st ea l fr o m m o re f o rt u n at e lo ca ls . L o ca ls m ay f ee l it i s u n fa ir t o t re at i m m ig ra n ts e q u al ly an d m ay f ee l an u rg e to p u n is h t h em b y d is cr im in at in g a n d l im it in g i m m ig ra n ts ’ ac ce ss t o R ea l li fe s it u at io n P eo p le d iv id e re w ar d s ac co rd in g t o t h ei r p h y si ca l tr ai ts a n d a tt ri b u te s. P eo p le d iv id e re w ar d s ac co rd in g t o t h ei r ci ti ze n sh ip , n at io n al it y , p la ce o f o ri g in o r b el o n g in g C ri te ri o n ( p ro x y v ar ia b le ) H ei g h t 1 P la ce o f b ir th 2
Each criterion corresponds to its respective variable (strategy) in equations in Appendix A:
International Journal of n. 1, pp. 3-14, 201 The criteria for division of money in the first stage of the game
an d m ay f ee l an u rg e to p u n is h t h em b y d is cr im in at in g a n d l im it in g i m m ig ra n ts ’ ac ce ss t o g o o d s, s er v ic es , an d j o b s w h en ev er p o ss ib le . S tu d en ts w h o h av e b et te r g ra d es i n s ch o o l g et a cc ep te d t o b et te r u n iv er si ti es ; st u d en ts w h o g ra d u at e fr o m b et te r u n iv er si ti es c an g et h ig h er p ay in g j o b s; w o rk er s w it h m o re i m p re ss iv e re su m es g et b et te r jo b s. W ag e o r sa la ry c an b e ti ed t o p er fo rm an ce o r p ro d u ct iv it y o f a w o rk er . A w o rk er c an re ce iv e b o n u se s fo r p er fo rm in g b et te r th an o th er w o rk er s. T h at m ay n o t b e co n si d er ed f ai r b y e v er y o n e. F o r ex am p le , a b an k er r ec ei v in g a m u lt i-m il li o n b o n u s m ay f ee l li k e it i s fa ir , b u t o th er s m ay f ee l li k e th e b an k er ’s p er fo rm an ce d o es n o t m er it s u ch a h ig h b o n u s. E q u al a cc es s to p ri m ar y e d u ca ti o n f o r ev er y o n e, e q u al w ag es o r sa la ri es f o r w o rk er s w it h in a te am a re e x am p le s o f ev en ly d is tr ib u te d r ew ar d s th at a re g en er al ly c o n si d er ed f ai r. E v er y re w ar d t h at c an b e d iv id ed a cc o rd in g t o a n y o th er c ri te ri o n c an a ls o b e d iv id ed e v en ly . A lt h o u g h eq u al d iv is io n s ar e as su m ed to b e fa ir in m an y th eo ri es d is cu ss ed in th e p la ce o f o ri g in o r b el o n g in g to a c er ta in s o ci et y . P eo p le d iv id e re w ar d s ac co rd in g t o t h e ef fo rt t h ey p u t in i n t h e p as t. P eo p le d iv id e re w ar d s ac co rd in g t o t h e ef fo rt t h ey p u t in i m m ed ia te ly o r w it h in th e cu rr en t sh if t, d ay , m o n th , et c. P eo p le d iv id e re w ar d s ev en ly . A v er ag e g ra d e 3 P ro b le m s o lv in g ac cu ra cy 4 E q u al d iv is io n 5
Each criterion corresponds to its respective variable (strategy) in equations in Appendix A:
A lt h o u g h eq u al d iv is io n s ar e as su m ed to b e fa ir in m an y th eo ri es d is cu ss ed in th e in tr o d u ct io n o f th is p ap er , it i s ea sy t o s ee h o w e q u al it y c an b e p er ce iv ed u n fa ir i n r ea l li fe . F o r in st an ce , eq u al r ig h ts a n d a cc es s to t h e co u n tr y ’s i n fr as tr u ct u re f o r im m ig ra n ts a s w el l as f o r lo ca ls w il l se em u n fa ir t o m an y . E q u al j o b p ro sp ec ts f o r h ig h s ch o o l d ro p -o u ts a n d u n iv er si ty g ra d u at es c an e as il y s ee m u n fa ir . O n t h e o th er h an d , if p o o rl y e d u ca te d w o rk er s o r d is ad v an ta g ed i m m ig ra n ts a re n o t tr ea te d e q u al ly ( o r ev en f av o ra b ly ), t h ei r se n se o f u n fa ir n es s ca n j u st if y p u n is h m en ts l ik e th ef t, f ra u d , an d o th er c ri m es .
If player 1, for example, chooses to divide her money pool proportionally to the players’ height, then the taller player will get more money and the shorter player will get less money. If both players are of the same height, the money pool is divided equally. Player 2 has the same decision to make and divides his money pool according to one of the criteria from the same set. After both players made their decisions, each will end up with a share of her money pool and a share of the other player’s money pool. The outcome for each player in this stage of the game will be a sum of these two shares. The game is formally presented in Appendix A. The outcomes become a common knowledge after both players made their decisions.
2.2. The Game of Division and Punishment: Stage 2
Players may end up with unequal outcomes after the first stage. In this case, they may feel that the outcomes are unfair, according to the theories of fairness (Fehr and Schmidt, 1999; Bolton and Ockenfels, 2000; Falk and Fischbacher, 2006). If one player believes her outcome is unfair, she is more likely to punish the other player. However, it is possible that a player may consider an unequal outcome to be fair. A common assumption is that all equal outcomes are fair, like in the ultimatum game or dictator game experiments (Thaler, 1988; Güth et al, 2001; Henrich et al, 2010). My experiment challenges this assumption.
In the second stage of the game, both players have an opportunity to punish each other by reducing the outcomes. Each player can reduce both players’ outcomes by the same percentage. Therefore, the punishment is costly to the punishing player unless the punishing player has the outcome of 0. Neither player’s outcome can be reduced below 0. The players make their punishing decisions simultaneously. The game ends after both players made their punishing decisions. Formal definitions of payoffs and strategies in the second stage of the game are in Appendix B.
2.3. The Experimental Procedure
Twenty four subjects participated in the experiment. The subjects played the game described above three times. Subjects were divided into two sections and randomly paired up in each of the three treatments. Everyone was informed that they are very unlikely to face the same player in the next treatment. The experiment took place in a computer lab of Maria Curie-Sklodowska University in Lublin and was programmed using z-Tree software (Fischbacher, 2007). The subjects were mostly second year students majoring in economic disciplines. The language of the experiment was English, the second language for all of the subjects. The subjects were not allowed to communicate, but they could call out a phrase if they did not understand it and someone would translate it into their native language.
In the beginning of the experiment, participants entered their height, average grade, and answered whether they were born locally. Then they received instructions about the rules of the first stage of the game:
“Now you will be grouped up with a random anonymous player. You will not know the identity of the other player and the other player will not know your identity neither during the experiment nor afterwards. You are given a money pool of 2 zloty. You have to divide this money pool between yourself and the other player proportionally to one of the criteria. You have to make a decision which criterion to use for the division of this money pool. The other player is also given a money pool of her own that also amounts to 2 zloty and will have to make the same decisions as you.”
International Journal of n. 1, pp. 3
Then the subjects were asked to solve a mathematical problem: to approximate a square root of a randomly generated fraction in decimal form in 60 seconds. The calculators and mobile phones were not allowed. The accuracy of the solution from 0% to 100% appeared on the screen after the players entered their answers.
The next screen contained the
to make the decision. There was information below the list on the same screen about what outcome each decision would lead to, so the subjects did not have to do any calculations to figure out what decision would lead to what outcome.
Between the first and the second stages of the game, the subjects in each group were informed about what decision the other player made and the outcomes of both players. On the same screen they were explicitly asked
money and the division of money by the other player fair.
The next screen offered the players an opportunity to reduce the outcome of the other player and own outcome by the same percentage. I avoided th
other loaded term in the instructions to the punishment stage. At the end of the treatment the players could see how much they earned and how much their winnings and the winnings of the other player were reduced. This treatment w
observations in total. The subjects received the show up fee of 2 zloty in addition to money pools of 2 zloty per player per stage.
The program code used in the experiment is available from author upon request.
3. Results
Below, I show what players considered fair and unfair and what decisions the players tended to punish more. I provide my interpretation of the results and discuss possible implications of the results for theories of fairness and real life situations.
3.1. What is Fair?
“The just cause… is: we did it, therefore it’s a just cause.”
I start this section with a caveat that the participants in this experiment are not native English speakers and may understand the word “fair” differently. Th
the word fairness, but about its economic content and consequences.
Out of 72 observations, each strategy, except for ‘division according to the place of birth’, was played at least 15 times. The players who made the di
those divisions fair at least 72% of the time (Table 2). Interestingly, not all equal divisions were considered fair by either player. A little over 62% of the strategies played were dominant strategies, where the players max
dominant strategies fair just as frequently as equal divisions: 73% of the time.
Each strategy was considered fair by the other player about three quarters of the time, even the dominant strategies. The only e
was considered unfair by the other player more often.
There are several ways of looking at the results. On one hand, divisions of money proportionally to effort either put in in the past or immediately are
considered unfair by either player. However, divisions according to physical and social traits were still considered fair more than half of the time. These results should be taken cautiously because the subjects in this experime
comfortable with decisions that maximize profits in experiments (Rubinstein, 2006).
International Journal of n. 1, pp. 3-14, 201
Then the subjects were asked to solve a mathematical problem: to approximate a square of a randomly generated fraction in decimal form in 60 seconds. The calculators and mobile phones were not allowed. The accuracy of the solution from 0% to 100% appeared on the screen after the players entered their answers.
The next screen contained the list of criteria shown in Table 1 where the participants had to make the decision. There was information below the list on the same screen about what outcome each decision would lead to, so the subjects did not have to do any calculations to
t decision would lead to what outcome.
Between the first and the second stages of the game, the subjects in each group were informed about what decision the other player made and the outcomes of both players. On the same screen they were explicitly asked to state whether they consider their own division of money and the division of money by the other player fair.
The next screen offered the players an opportunity to reduce the outcome of the other player and own outcome by the same percentage. I avoided the word “punishment” or any other loaded term in the instructions to the punishment stage. At the end of the treatment the players could see how much they earned and how much their winnings and the winnings of the other player were reduced. This treatment was repeated three times generating 72 observations in total. The subjects received the show up fee of 2 zloty in addition to money pools of 2 zloty per player per stage.
The program code used in the experiment is available from author upon request.
Below, I show what players considered fair and unfair and what decisions the players tended to punish more. I provide my interpretation of the results and discuss possible implications of the results for theories of fairness and real life situations.
“The just cause… is: we did it, therefore it’s a just cause.”
I start this section with a caveat that the participants in this experiment are not native English speakers and may understand the word “fair” differently. This study is not about linguistics of the word fairness, but about its economic content and consequences.
Out of 72 observations, each strategy, except for ‘division according to the place of birth’, was played at least 15 times. The players who made the divisions considered each one of those divisions fair at least 72% of the time (Table 2). Interestingly, not all equal divisions were considered fair by either player. A little over 62% of the strategies played were dominant strategies, where the players maximized their outcome. Players considered these dominant strategies fair just as frequently as equal divisions: 73% of the time.
Each strategy was considered fair by the other player about three quarters of the time, even the dominant strategies. The only exception was ‘division according to
was considered unfair by the other player more often.
There are several ways of looking at the results. On one hand, divisions of money proportionally to effort either put in in the past or immediately are slightly less likely to be considered unfair by either player. However, divisions according to physical and social traits were still considered fair more than half of the time. These results should be taken cautiously because the subjects in this experiment were economics students, who tend to be more comfortable with decisions that maximize profits in experiments (Rubinstein, 2006).
Then the subjects were asked to solve a mathematical problem: to approximate a square of a randomly generated fraction in decimal form in 60 seconds. The calculators and mobile phones were not allowed. The accuracy of the solution from 0% to 100% appeared on list of criteria shown in Table 1 where the participants had to make the decision. There was information below the list on the same screen about what outcome each decision would lead to, so the subjects did not have to do any calculations to Between the first and the second stages of the game, the subjects in each group were informed about what decision the other player made and the outcomes of both players. On the to state whether they consider their own division of The next screen offered the players an opportunity to reduce the outcome of the other e word “punishment” or any other loaded term in the instructions to the punishment stage. At the end of the treatment the players could see how much they earned and how much their winnings and the winnings of as repeated three times generating 72 observations in total. The subjects received the show up fee of 2 zloty in addition to money
The program code used in the experiment is available from author upon request.
Below, I show what players considered fair and unfair and what decisions the players tended to punish more. I provide my interpretation of the results and discuss possible implications of
“The just cause… is: we did it, therefore it’s a just cause.” – Noam Chomsky
I start this section with a caveat that the participants in this experiment are not native English is study is not about linguistics of Out of 72 observations, each strategy, except for ‘division according to the place of birth’, visions considered each one of those divisions fair at least 72% of the time (Table 2). Interestingly, not all equal divisions were considered fair by either player. A little over 62% of the strategies played were imized their outcome. Players considered these dominant strategies fair just as frequently as equal divisions: 73% of the time.
Each strategy was considered fair by the other player about three quarters of the time, xception was ‘division according to height’, which There are several ways of looking at the results. On one hand, divisions of money slightly less likely to be considered unfair by either player. However, divisions according to physical and social traits were still considered fair more than half of the time. These results should be taken cautiously nt were economics students, who tend to be more comfortable with decisions that maximize profits in experiments (Rubinstein, 2006).
Table 2 – The number and percentage of divisions considered fair (unfair) and punished by each player D o m in an t st ra te g y * 4 5 6 2 .5 3 3 7 3 .3 1 4 3 1 .1 2 7 6 0 .0 4 2 .4 (2 8 .6 ) T o ta l 7 2 1 0 0 .0 5 6 7 7 .8 2 1 2 9 .2 4 3 5 9 .7 4 5 .5 (2 6 .7 ) C ri te ri o n f o r d iv is io n P ro b le m so lv in g a cc u ra cy (i m m ed ia te ef fo rt ) 1 8 2 5 .0 1 4 7 7 .8 4 2 2 .2 1 1 6 1 .1 4 1 .3 (2 7 .5 ) P la ce o f b ir th (s o ci al t ra it ) 4 5.6 4 1 0 0 .0 1 2 5 .0 3 7 5 .0 3 0 .7 (3 4 .1 ) E q u al d iv is io n 1 5 2 0 .8 1 1 7 3 .3 4 2 6 .7 1 2 8 0 .0 4 4 .0 (2 7 .9 ) A v er ag e g ra d e (p as t ef fo rt ) 1 7 2 3 .6 1 4 8 2 .4 4 2 3 .5 1 1 6 4 .7 4 9 .5 (3 1 .3 ) H ei g h t (p h y si ca l tr ai t) 1 8 2 5 .0 1 3 7 2 .2 8 4 4 .4 6 3 3 .3 5 6 .2 (2 5 .1 ) N u m b er o f ti m es p la y ed N u m b er o f ti m es p la y ed , % T im es c o n si d er ed f ai r T im es c o n si d er ed f ai r, % T im es co n si d er ed u n fa ir b y th e o th er p la y er T im es co n si d er ed u n fa ir b y th e o th er p la y er , % T im es p u n is h ed b y th e o th er p la y er T im es p u n is h ed b y th e o th er p la y er , % A v er ag e p u n is h m en t b y th e o th er p la y er , ex cl u d in g 0 % p u n is h m en ts , % ( σ )
International Journal of n. 1, pp. 3
We can conclude with a high degree of certainty that equal outcomes are not always considered fair. Yet, we cannot tell exactly what people mean by the word “
meaning of the word itself is subjective.
arguably the most important consequence of unfairness: punishment. Humans are shown to punish unfairness in multiple experiments. Mainstream theories o
Schmidt, 1999; Bolton and Ockenfels, 2000) and reciprocity (Falk and Fischbacher, 2006) show that punishment can be a direct consequence of the sense of unfairness. Although, punishment may also be a way to reduce the advantage of the
motivated by spite and anger induced by other factors (Falk et al, 2005). In the design of the experiment, I make an assumption that the decision to punish must be positively correlated with the sense of unfairness. The interpretation
Punishments were on average twice as frequent as divisions that subjects considered unfair. Some punishments were as small as 2% and could have been out of curiosity or mistake (Appendix D). Therefore, I also
The frequency and size of punishments of equal divisions support the hypothesis that equal outcomes are not necessarily perceived as fair. This raises a question, however, of whether so many equal outcomes were punished due to concerns for fairness alone.
It could have been that subjects did not understand the instructions correctly or wanted to test what happens if they punish. By looking at the results across each treatment in Table 3, we can see that it is not the case. The frequency of punishments as well as the size of punishments only increases with each treatment.
Table 3 – Divisions considered fair (unfair) and punished across treatments
Number of observations
Times the strategy played considered fair Times the strategy played considered fair, %
Times the strategy played considered unfair by the other player Times the strategy played considered unfair by the other Times the strategy played punished by the other player Times the strategy played punished by the other player, % Average punishment by the other player, excluding 0% punishments, % (σ)
A possible explanation is that the players who got a smaller outcome tried to reduce their disadvantage by reducing both players’ outcomes. Falk et al (2005) observed such behavior in their experiment where participants eagerly punished
other player. I measured how many punishments decreased disadvantage for the punishing player and it was around half of all punishments (Table
either decreased advantage or did n
International Journal of n. 1, pp. 3-14, 201
We can conclude with a high degree of certainty that equal outcomes are not always considered fair. Yet, we cannot tell exactly what people mean by the word “
meaning of the word itself is subjective. In the second stage of the experiment, I
arguably the most important consequence of unfairness: punishment. Humans are shown to punish unfairness in multiple experiments. Mainstream theories of fairness (
Bolton and Ockenfels, 2000) and reciprocity (Falk and Fischbacher, 2006) show that punishment can be a direct consequence of the sense of unfairness. Although, punishment may also be a way to reduce the advantage of the opponent or be purely motivated by spite and anger induced by other factors (Falk et al, 2005). In the design of the experiment, I make an assumption that the decision to punish must be positively correlated with the sense of unfairness. The interpretation of the results are based on this assumption.
Punishments were on average twice as frequent as divisions that subjects considered unfair. Some punishments were as small as 2% and could have been out of curiosity or mistake (Appendix D). Therefore, I also measured the average size of punishments (Table 2). The frequency and size of punishments of equal divisions support the hypothesis that equal outcomes are not necessarily perceived as fair. This raises a question, however, of whether so
es were punished due to concerns for fairness alone.
It could have been that subjects did not understand the instructions correctly or wanted to test what happens if they punish. By looking at the results across each treatment in Table 3, we t is not the case. The frequency of punishments as well as the size of punishments only increases with each treatment.
Divisions considered fair (unfair) and punished across treatments I
treatment treatment 24
Times the strategy played considered fair 18
Times the strategy played considered fair, % 75.0 Times the strategy played considered unfair by the other player 6 Times the strategy played considered unfair by the other player, % 25.0 Times the strategy played punished by the other player 12 Times the strategy played punished by the other player, % 50.0 Average punishment by the other player, excluding 0% 37.5 (18.4)
A possible explanation is that the players who got a smaller outcome tried to reduce their disadvantage by reducing both players’ outcomes. Falk et al (2005) observed such behavior in their experiment where participants eagerly punished if punishments were more costly to the other player. I measured how many punishments decreased disadvantage for the punishing player and it was around half of all punishments (Table 4). The other half of the punishments either decreased advantage or did not change the difference between outcomes.
We can conclude with a high degree of certainty that equal outcomes are not always considered fair. Yet, we cannot tell exactly what people mean by the word “fair”, as the In the second stage of the experiment, I measure arguably the most important consequence of unfairness: punishment. Humans are shown to f fairness (Fehr and Bolton and Ockenfels, 2000) and reciprocity (Falk and Fischbacher, 2006) show that punishment can be a direct consequence of the sense of unfairness. Although, opponent or be purely motivated by spite and anger induced by other factors (Falk et al, 2005). In the design of the experiment, I make an assumption that the decision to punish must be positively correlated
are based on this assumption. Punishments were on average twice as frequent as divisions that subjects considered unfair. Some punishments were as small as 2% and could have been out of curiosity or a measured the average size of punishments (Table 2). The frequency and size of punishments of equal divisions support the hypothesis that equal outcomes are not necessarily perceived as fair. This raises a question, however, of whether so It could have been that subjects did not understand the instructions correctly or wanted to test what happens if they punish. By looking at the results across each treatment in Table 3, we t is not the case. The frequency of punishments as well as the size of
Divisions considered fair (unfair) and punished across treatments II treatment III treatment 24 24 21 16 87.5 66.7 6 9 25.0 37.5 15 16 62.5 66.7 41.9 (28.9) 54.8 (29.2) A possible explanation is that the players who got a smaller outcome tried to reduce their disadvantage by reducing both players’ outcomes. Falk et al (2005) observed such behavior in if punishments were more costly to the other player. I measured how many punishments decreased disadvantage for the punishing 4). The other half of the punishments ot change the difference between outcomes.
Table 4 – Relative frequency and size of punishments that decreased disadvantage between players’ outcomes I treatment II treatment III treatment Total
Number of punishments by the other player 12 15 16 43
Average punishment by the other player (excluding 0% punishments), %
37.5 41.9 54.8 45.5
Number of punishments that decreased disadvantage
7 10 10 27
% of punishments that decreased disadvantage 58.3 66.7 62.5 62.8 Average punishment that decreased disadvantage,
% (σ) 36.4 (18.9) 47.2 (29.4) 55.7 (33.2) 47.6 (28.7) Total number of situations where one player had a
disadvantage
10 12 12 34*
*34 players had advantage, while 4 players had equal outcomes.
3.2. Why Punish Equal Outcomes?
One possible explanation why 80% of equal divisions were punished lies in the design of the game. In ultimatum game experiments the punisher goes last in the sequence and the player who proposes the division cannot punish the punisher. Here, if we assume that each player has her own idea of what is a fair outcome, we must consider that each player also has her own idea of what punishment is fair and what punishment is unjust. If a player perceives the punishment as unfair, logically, she would enjoy punishing the punisher to restore fairness as she sees it. Of course, this would be unfair from the perspective of the other player (initial punisher), who would want to punish again. This string of reciprocal punishments could go on forever unless both players eventually converged on what to consider a fair outcome.
Consider a situation where Player E chooses equal outcome and Player M chooses to maximize her outcome, yet each player believes that her decision is fair. Both players need to decide simultaneously whether to punish or not. Since each player thinks that her decision is fair, they both will perceive any punishment by the other player as unfair and unjust. If Player M believes that Player E’s punishment is likely, then Player M can punish in advance to mitigate the feeling of being unjustly punished. I describe this idea mathematically in Appendix C.
In a famous quote often ascribed to Oscar Wilde: “No good deed goes unpunished”, a good deed can be perceived as not a good deed by the punisher, while the punisher may think that she is not a punisher at all, but doing a good (or at least a fair) deed instead.
3.3. Implications for Economic Experiments and Real Life Situations
Many experiments rely on the assumption that equal outcomes are considered fair by all players. The results obtained in our experiment do not necessarily make the experiments that rely on such assumption inaccurate, but provide a warning that different conceptions of fairness may influence the decisions of subjects. Consider a classic ultimatum game, where player 1 has to divide a sum of money between herself and player 2 and player 2 can either accept or reject the division. Rejection results in both players getting nothing. A vast body of empirical research shows that offers below 40% are often rejected (Fehr and Schmidt, 1999; Nowak et al, 2000; Henrich et al, 2001; Sanfey et al, 2003). The decisions to reject are commonly attributed to the player’s desire to punish the unfairness of inequitable outcomes. By the same reasoning, the players who accept inequitable outcomes are assumed to have
International Journal of n. 1, pp. 3
lower preference for fairness. Our experiment shows that some of the players who accept (do not punish) unequal outcomes may in fact consider the unequal outcomes perfectly fair. If a player is able to put herself
money in her favor AND consider this division fair, then it is possible that she views the proposer’s unequal division as fair as well.
Situations where concerns for fairness and equality play
ubiquitous in human society. Below I discuss several cliché situations where fairness and equality may come in conflict.
3.3.1. Immigrant Employee versus Local Employee
In an increasingly globalized and unequal world, the iss
remain acute. Is it fair for the immigrant employees to have equal rights and benefits as the local employees? One of the criteria for dividing money in our experiment is being born locally (Table 2). Despite having very low
chose this criterion consider it fair, while some non
given the opportunity. It is also interesting that it was a very infrequent decision. The four players who chose being local as a criterion for money division did not have a better strategy to play. Any other division (according to height, average grade, or problem solving accuracy) led to a worse outcome for these players.
3.3.2. Capitalism versus Socialism
Arguably, the most hotly debated issue in politics is what is fairer: capitalism or socialism. Logically, this debate exists because populations are divided on the issue. Socialists advocate more equal division of outcomes and opportunities
least outcomes is not fair at all. Our experiment shows that fairness is hardly an argument in debates for equality. Equal outcome was chosen only in 15 out of 72 observations, was considered unfair approximate
was punished 80% of the time (Table 2). Perhaps, if this experiment were conducted in one of the communist states, the results would differ dramatically.
3.3.3. Large Territory versus Large G
In geopolitics, countries divide various resources, spheres of influence, and many other benefits. These benefits can be divided equally, like voting rights in the United Nations General Assembly, or proportionally to one of the criteria, like spheres o
between superpowers. Consider two hypothetical superpowers, one geographically larger but poorer state, and the other is a smaller state with much higher GDP. Both states are looking to divide spheres of political influence and have t
to the geographical size of the countries, or proportionally to their GDPs.
One should be cautious extrapolating results of a small experiment with individual subjects onto large states, but there are plenty
leader is in a position to individually make geopolitical decisions. The results of our experiment suggest that dividing the powers equally would be the worst possible decision. Such decision will not lead to
the other decisions, and may still be followed by a punishment. It is also naïve to assume that the other side will perceive any one state’s decision as fair. For example, dividing the power according to GDP may seem like a fair choice to one state, but the other state’s leadership should not be expected to share the same fairness conceptions.
International Journal of n. 1, pp. 3-14, 201
lower preference for fairness. Our experiment shows that some of the players who accept (do not punish) unequal outcomes may in fact consider the unequal outcomes perfectly fair. If a player is able to put herself in the proposer’s shoes and realize that she would divide the money in her favor AND consider this division fair, then it is possible that she views the proposer’s unequal division as fair as well.
Situations where concerns for fairness and equality play a role in decision making are ubiquitous in human society. Below I discuss several cliché situations where fairness and equality may come in conflict.
3.3.1. Immigrant Employee versus Local Employee
n an increasingly globalized and unequal world, the issues of migration and employment remain acute. Is it fair for the immigrant employees to have equal rights and benefits as the local employees? One of the criteria for dividing money in our experiment is being born locally (Table 2). Despite having very low number of observations, it is clear that those who chose this criterion consider it fair, while some non-locals consider it unfair and punish locals given the opportunity. It is also interesting that it was a very infrequent decision. The four chose being local as a criterion for money division did not have a better strategy to play. Any other division (according to height, average grade, or problem solving accuracy) led to a worse outcome for these players.
3.3.2. Capitalism versus Socialism (or Communism)
Arguably, the most hotly debated issue in politics is what is fairer: capitalism or socialism. Logically, this debate exists because populations are divided on the issue. Socialists advocate more equal division of outcomes and opportunities, while capitalists argue that equality of at least outcomes is not fair at all. Our experiment shows that fairness is hardly an argument in debates for equality. Equal outcome was chosen only in 15 out of 72 observations, was considered unfair approximately by a quarter of subjects on either side of the division, and was punished 80% of the time (Table 2). Perhaps, if this experiment were conducted in one of the communist states, the results would differ dramatically.
3.3.3. Large Territory versus Large GDP
In geopolitics, countries divide various resources, spheres of influence, and many other benefits. These benefits can be divided equally, like voting rights in the United Nations General Assembly, or proportionally to one of the criteria, like spheres of political influence between superpowers. Consider two hypothetical superpowers, one geographically larger but poorer state, and the other is a smaller state with much higher GDP. Both states are looking to divide spheres of political influence and have three choices: to divide equally, proportionally to the geographical size of the countries, or proportionally to their GDPs.
One should be cautious extrapolating results of a small experiment with individual subjects onto large states, but there are plenty of countries in the world where one autocratic leader is in a position to individually make geopolitical decisions. The results of our experiment suggest that dividing the powers equally would be the worst possible decision. Such decision will not lead to the highest outcome, about as likely to be perceived unfair as the other decisions, and may still be followed by a punishment. It is also naïve to assume that the other side will perceive any one state’s decision as fair. For example, dividing the power ccording to GDP may seem like a fair choice to one state, but the other state’s leadership should not be expected to share the same fairness conceptions.
lower preference for fairness. Our experiment shows that some of the players who accept (do not punish) unequal outcomes may in fact consider the unequal outcomes perfectly fair. If a in the proposer’s shoes and realize that she would divide the money in her favor AND consider this division fair, then it is possible that she views the a role in decision making are ubiquitous in human society. Below I discuss several cliché situations where fairness and
ues of migration and employment remain acute. Is it fair for the immigrant employees to have equal rights and benefits as the local employees? One of the criteria for dividing money in our experiment is being born number of observations, it is clear that those who locals consider it unfair and punish locals given the opportunity. It is also interesting that it was a very infrequent decision. The four chose being local as a criterion for money division did not have a better strategy to play. Any other division (according to height, average grade, or problem solving accuracy)
Arguably, the most hotly debated issue in politics is what is fairer: capitalism or socialism. Logically, this debate exists because populations are divided on the issue. Socialists advocate , while capitalists argue that equality of at least outcomes is not fair at all. Our experiment shows that fairness is hardly an argument in debates for equality. Equal outcome was chosen only in 15 out of 72 observations, was ly by a quarter of subjects on either side of the division, and was punished 80% of the time (Table 2). Perhaps, if this experiment were conducted in one of
In geopolitics, countries divide various resources, spheres of influence, and many other benefits. These benefits can be divided equally, like voting rights in the United Nations f political influence between superpowers. Consider two hypothetical superpowers, one geographically larger but poorer state, and the other is a smaller state with much higher GDP. Both states are looking to hree choices: to divide equally, proportionally One should be cautious extrapolating results of a small experiment with individual of countries in the world where one autocratic leader is in a position to individually make geopolitical decisions. The results of our experiment suggest that dividing the powers equally would be the worst possible decision. the highest outcome, about as likely to be perceived unfair as the other decisions, and may still be followed by a punishment. It is also naïve to assume that the other side will perceive any one state’s decision as fair. For example, dividing the power ccording to GDP may seem like a fair choice to one state, but the other state’s leadership
3.3.4. Thief versus Rich Person
There is a very common situation where equal outcomes are often punished. Consider a decision by a poor person to steal from a rich person. The motivation of a poor person is to take enough from a rich person to enjoy equal lifestyle with the rich person. Assuming both players had equal chance of being born rich or poor and put the same amount of effort throughout their lives, the resulting outcomes of such theft can be perceived as equal. Most societies throughout human history considered such “equal outcome” to be unfair and punished a person, a thief, whose decision led to this equal outcome. Yet some thieves and even social groups consider the inequality-reducing outcome resulting from theft to be fair and deserving of praise rather than punishment. A testament to this paradox is the popularity of the tale of Robin Hood, who notoriously steals from the rich and gives to the poor.
4. Conclusions
The concept of fairness revolves around the notion of equality. The difference between outcomes is easy to measure mathematically and it is often used as a measure of fairness in different theories and experiments. However, not everyone may consider equal outcomes fair. I conduct an experiment using a two-player game where players have to divide two equal pools of money. Then players are given an opportunity to impose a costly punishment upon each other. In the experiment the subjects are also asked whether they consider own decision and the decision of the other player fair.
The results show that subjects do not always consider equal outcomes fair. In addition, equal divisions of money in the experiment are followed by punishment 80% of the time. Due to a low sample size, we cannot definitively conclude that equal outcomes are punished with a specific frequency, but we certainly observe that such punishments occur.
Given a symmetric game structure where players have equal opportunities, the maximization of profit appears to be just as fair of a strategy as splitting money equally. The players who played the dominant (profit maximizing) strategy did not face the punishment more often than those who decided to divide the money equally. Such punishment pattern may influence the decisions of players in the simpler ultimatum and dictator games, although it cannot be directly observed in these games.
Results of my research are generally consistent with empirical observations (Baumard et al (2012); Houser et al (2012); Castelli et al (2014); Durante et al (2014); Figueiredo and Netto (2014)) and theories (Roemer (1998); Devooght (2008); Fudenberg and Levine (2012)) that take into account multiple factors and circumstances when defining fairness. Studies that assume fair outcomes to be equal or the most equal of all available options are shown to have a drawback. A participant in such study may actually have strong aversion to unfairness, but still choose an inequitable outcome because she perceives it to be perfectly fair.
Conducting a similar experiment with a larger sample using other criteria for division, such as race, gender, religion, and various performance and contribution measures, can be an interesting avenue for future research. Also, a more in-depth study of each trait and circumstance as a criterion for fair division of rewards between individuals, at a workplace, or within a society can provide useful insights into economic behavior.
Acknowledgements
I gratefully acknowledge support and funding of this research by the Faculty of Economics of Maria Curie-Sklodowska University. I would like to thank Anna Rakowska, Zbigniew Pastuszak, Taras Bondarenko, Pawel Pasierbiak, and Magdalena Kondas for their assistance in organizing the experiment.
International Journal of n. 1, pp. 3
Appendix A
There are two players in the game, player 1 and player 2. Both players divide their respective money pools granted to them: player 1 divides
money are of equal size: Π
The strategy set of player 1 is
, , , , . Descriptions o
The outcome of each strategy for player 1 consists of two parts: money from player 1’s division of her money pool and money from player 2’s division of his money pool allocated to player 1. The set of outcomes for p
that are added together: ,
is a share of player 1’s money pool strategies from her strategy set
is a share of player 2’s money pool of the strategies from his strategy set
Note that the superscript indicates the player who receives the share of the money pool, not the power. For example, if player 1 chooses the strategy
divided proportionally to each players’ height between player 1 and player 2 according to equation (A.4).
Each element of sets
equations are followed by comments 0 Π Π 2⁄ !"# $ !"# % is player 1’s height, %
player who may take part in the experiment. I set
The purpose of the minimum parameters is to increase the dispersion of outcomes when the players have similar height or another trait. Special cases for
% % are to avoid division by zero. 0 Π Π 2⁄ !"# $ !"# International Journal of n. 1, pp. 3-14, 201
There are two players in the game, player 1 and player 2. Both players divide their respective money pools granted to them: player 1 divides Π and player 2 divides
Π .
The strategy set of player 1 is , , , , and the strategy set of player 2 is Descriptions of each strategy can be found in Table 1.
The outcome of each strategy for player 1 consists of two parts: money from player 1’s division of her money pool and money from player 2’s division of his money pool allocated to player 1. The set of outcomes for player 1 is , & and it consists of subsets
& ' layer 1’s money pool Π that she receives for choosing one of her strategies from her strategy set :
, ( , ) , * , + ,
is a share of player 2’s money pool Π that player 2 gives to player 1 by playing one of the strategies from his strategy set :
, ( , ) , * , + ,
Note that the superscript indicates the player who receives the share of the money pool, For example, if player 1 chooses the strategy H, her money pool will be ionally to each players’ height between player 1 and player 2 according to
and are defined by equations below (A.4 equations are followed by comments for easier interpretation.
-. % %/01 234 % 5 %/01 -. % %/01 234 % 5 %/01
-. % %
!"#6 Π -. % 7 % , % 7 %/01, % 7 %/01
8
is player 2’s height, and %/01 the lowest possible height of any player who may take part in the experiment. I set %/01 arbitrarily at %/01
The purpose of the minimum parameters is to increase the dispersion of outcomes when the players have similar height or another trait. Special cases for % %/01
are to avoid division by zero.
-. % %/01 234 % 5 %/01
-. % %/01 234 % 5 %/01
-. % %
!"#6 Π -. % 7 % , % 7 %/01, % 7 %/01
8 There are two players in the game, player 1 and player 2. Both players divide their respective
and player 2 divides Π . The pools of and the strategy set of player 2 is f each strategy can be found in Table 1.
The outcome of each strategy for player 1 consists of two parts: money from player 1’s division of her money pool and money from player 2’s division of his money pool allocated
and it consists of subsets and
(A.1) that she receives for choosing one of her
(A.2) that player 2 gives to player 1 by playing one
(A.3) Note that the superscript indicates the player who receives the share of the money pool, , her money pool will be ionally to each players’ height between player 1 and player 2 according to are defined by equations below (A.4-A.13). Some
8 (A.4)
the lowest possible height of any 100 centimeters. The purpose of the minimum parameters is to increase the dispersion of outcomes when the
/01, % %/01, and
( :
0.25Π -. = = 0 234 = = 1 0.75Π -. = = 1 234 = = 0
? -. = = = 8 (A.6) = and = are discrete variables. = , = ∈ 0,1 . If player 1 possesses a certain social trait (born local in this case), then = = 1, if not then = = 0. The same pattern applies to = for player 2. ( = : 0.25Π -. = = 0 234 = = 1 0.75Π -. = = 1 234 = = 0 Π 2⁄ -. = = = 8 (A.7) ) = 0 -. A = A/01 234 A > A/01 Π -. A = A/01 234 A > A/01 Π 2⁄ -. A = A B B!"# B $B B!"#6 Π -. A ≠ A , A ≠ A/01, A ≠ A/01 8 (A.8) A and A are average grades of player 1 and player 2 respectively on the scale from 60 to 100. They represent efforts put in by the players in the past. The minimum average grade is A/01= 60. It is the minimum passing grade for the subjects.
) = 0 -. A = A/01 234 A > A/01 Π -. A = A/01 234 A > A/01 Π 2⁄ -. A = A B B!"# B $B B!"#6 Π -. A ≠ A , A ≠ A/01, A ≠ A/01 8 (A.9) * = 0 -. D = D/01 234 D > D/01 Π -. D = D/01 234 D > D/01 Π 2⁄ -. D = D E E!"# E $E E!"#6 Π -. D ≠ D , D ≠ D/01, D ≠ D/01 8 (A.10) D and D show the accuracy of solutions to the mathematical problem presented to the students during the experiment. It represents the immediate effort put in by the students. D/01 is the minimum possible accuracy and it equals to zero. D , D ∈ F0,1G.
* = 0 -. D = D/01 234 D > D/01 Π -. D = D/01 234 D > D/01 Π 2⁄ -. D = D E E!"# E $E E!"#6 Π -. D ≠ D , D ≠ D/01, D ≠ D/01 8 (A.11) + = Π 2⁄ (A.12) + = Π 2⁄ (A.13)
International Journal of n. 1, pp. 3
+ and + are parts of the player 1’s outcome of the eq player 1 and player 2 respectively.
The game is symmetrical so the outcomes for player 2 are given by the same functions where players are reversed.
Appendix B
Stage 2 of the game is a subgame that takes place right after s
two players in the game: player 1 and player 2. Player 1 chooses to reduce both players’ outcomes by any amount from 0 to 100%. Player 2 makes the same decision simultaneously. Payoffs in the entire game for player 1 and player
respectively:
H I , I
H I , I
where:
, & is the outcome of the first stage of the game for player 1, who plays a strategy from strategy set against player 2’s strategy from her strategy set
I and I are punishments
HJ is utility of fairness of player 1,
HJ and HK are non-monetary terms, which we cannot directly observe but I as exist. Players are also assumed to be rational and maximizing their payoffs
Appendix C
Appendix C logically stems out of Appendix A and Appendix B and shares the same variables.
Utility of fairness (HJ ) is a function of outcomes of average of their outcomes ( L
Schmidt (1999), Bolton and Ockenfels (2000), and Falk and Fischbacher HJ , , L&, where
The utility of punishment (
preference for spiteful punishment (Falk et al, 2005) when it reduces the di the smaller outcome of player 1 and bigger outcome of player 2:
the preference for spiteful punishment of player 1. I also include preference for
In our experiment, both players have an opportunity to punish, but they have to do it simultaneously. In case when players’ conceptions of fairness differ and player 1 perceives the punishment by the player 2 as unfair, wh
perfectly fair, player 1 may enjoy reciprocating with the punishment of her own. The preference for reciprocal punishment is:
International Journal of n. 1, pp. 3-14, 201
are parts of the player 1’s outcome of the equal division of money pools by player 1 and player 2 respectively.
The game is symmetrical so the outcomes for player 2 are given by the same functions
Stage 2 of the game is a subgame that takes place right after stage one. There are the same two players in the game: player 1 and player 2. Player 1 chooses to reduce both players’ outcomes by any amount from 0 to 100%. Player 2 makes the same decision simultaneously. Payoffs in the entire game for player 1 and player 2 are H I , I &
I & , & 1 M I & 1 M I & ' HJ ' HK
I & , & 1 M I & 1 M I & ' HJ ' HK
is the outcome of the first stage of the game for player 1, who plays a strategy against player 2’s strategy from her strategy set ;
are punishments of player 1 and player 2 respectively and I , is utility of fairness of player 1, HK is utility of punishment of player 1.
monetary terms, which we cannot directly observe but I as exist. Players are also assumed to be rational and maximizing their payoffs
Appendix C logically stems out of Appendix A and Appendix B and shares the same ) is a function of outcomes of both players (
L) in line with theories of fairness and reciprocity by Fehr and Schmidt (1999), Bolton and Ockenfels (2000), and Falk and Fischbacher
, & and , & as defined in (A.1).
The utility of punishment (HK ) is positively influenced by unfairness (negative preference for spiteful punishment (Falk et al, 2005) when it reduces the di
the smaller outcome of player 1 and bigger outcome of player 2: N the preference for spiteful punishment of player 1.
I also include preference for reciprocal punishment (O ) in HK : HK HJ , N , O &
In our experiment, both players have an opportunity to punish, but they have to do it simultaneously. In case when players’ conceptions of fairness differ and player 1 perceives the punishment by the player 2 as unfair, while the player 2 perceives this punishment as perfectly fair, player 1 may enjoy reciprocating with the punishment of her own. The preference for reciprocal punishment is:
ual division of money pools by The game is symmetrical so the outcomes for player 2 are given by the same functions
tage one. There are the same two players in the game: player 1 and player 2. Player 1 chooses to reduce both players’ outcomes by any amount from 0 to 100%. Player 2 makes the same decision simultaneously. & and H I , I &
K K
is the outcome of the first stage of the game for player 1, who plays a strategy , I ∈ F1,0G; is utility of punishment of player 1.
monetary terms, which we cannot directly observe but I assume they
Appendix C logically stems out of Appendix A and Appendix B and shares the same and ) and the ) in line with theories of fairness and reciprocity by Fehr and Schmidt (1999), Bolton and Ockenfels (2000), and Falk and Fischbacher (2006):
as defined in (A.1).
) is positively influenced by unfairness (negative HJ ) and preference for spiteful punishment (Falk et al, 2005) when it reduces the difference between M , where N is
In our experiment, both players have an opportunity to punish, but they have to do it simultaneously. In case when players’ conceptions of fairness differ and player 1 perceives ile the player 2 perceives this punishment as perfectly fair, player 1 may enjoy reciprocating with the punishment of her own. The
O P 0 -. . + . = 0> 0 -. . + . ≠ 08
where . , . ∈ F−1,1G are fairness terms for player 1 and player 2 respectively.
If . < 0, then the outcome of player 1 is perceived as unfairly small by player 1; if . = 0, then the outcomes of both players are perceived as fair by player 1; if . > 0, then the outcome of player 2 is perceived as unfairly small by player 1.
Although the punishments are simultaneous, it is enough for player 1 to believe that player 2 will consider player 1’s “fair” strategy as unfair to have a positive preference for reciprocal punishment, assuming player 1 does not like being unfairly punished.
References
1. Baumard, N., Mascaro, O., & Chevallier, C. (2012). Preschoolers are able to take merit into account when distributing goods. Developmental psychology, 48(2), 492-498
2. Bolton, G. E., & Ockenfels, A. (2000). ERC: A theory of equity, reciprocity, and competition. American Economic Review, 90(1), 166-193.
3. Charness, G., & Rabin, M. (2002). Understanding social preferences with simple tests. Quarterly Journal of Economics, 117(3), 817-869.
4. Camerer, C. (2003). Behavioral game theory: Experiments in strategic interaction. Princeton University Press.
5. Castelli, I., Massaro, D., Sanfey, A. G., & Marchetti, A. (2014). “What is fair for you?” Judgments and decisions about fairness and Theory of Mind. European Journal of Developmental Psychology, 11(1), 49-62.
6. Castilla, E. J. (2008). Gender, race, and meritocracy in organizational careers. American Journal of Sociology, 113(6), 1479-1526.
7. Devooght, K. (2008). To Each the Same and to Each his Own: A Proposal to Measure Responsibility Sensitive Income Inequality. Economica, 75(298), 280-295.
8. Durante, R., Putterman, L., & Weele, J. (2014). Preferences for redistribution and perception of fairness: An experimental study. Journal of the European Economic Association, 12(4), 1059-1086.
9. Falk, A., & Fischbacher, U. (2006). A theory of reciprocity. Games and Economic Behavior, 54(2), 293-315.
10. Falk, A., Fehr E., & Fischbacher, U. (2005). Driving forces behind informal sanctions. Econometrica, 73(6): 2017-2030.
11. Falk, A., Fehr, E., & Fischbacher, U. (2008). Testing theories of fairness — Intentions matter. Games and Economic Behavior, 62(1), 287-303.