Smart Readiness Indicator and
Indoor Environmental Quality:
two case studies in Italy and Portugal
MARIA FEJR POLITECNICO DI TORINO 2019Relatore:
Prof. Stefano Paolo Corgnati
Co-relatore:
Prof. Cristina Becchio
Smart Readiness Indicator and Indoor Environmental Quality: two case studies in Italy and Portugal
POLITECNICO DI TORINO
Corso di Laurea Magistrale
In Architettura Costruzione e Città A.A. 2018-2019
UNIVERSITY OF COIMBRA
A.A. 2018-2019
Relatore esterno:
Prof. Manuel Carlos Gameiro da Silva
Candidata:
Abstract
The use and integration of smart technologies inside buildings in planned renovations is a point addressed in the Directive (EU) 2018/844 that also introduces the Smart Readiness Indicator (SRI), a new indicator to assess the readiness of buildings to adapt itself to users and grid needs. With this new indicator, the Directive aims to communicate more directly to more people (users, owners, etc.) the added value of having ICT technologies in a building. If users understand the value of this transformation, they are more motivated to invest time and money in it.
The indicator is then defined as a tool that provides information about the readiness of buildings to interact with external energy networks and occupants of the buildings themselves to ensure more efficient operation and better energy performance through ICT technologies. The evaluation of the indicator, through the verification of the services present, allows potential investors to understand what to target their resources in a hypothetical retrofit.
To better understand the functioning of this indicator, it was decided to apply it to two case studies, an Italian and a Portuguese one. This experiment allowed in the first case to use a critical approach going not only to assess the level of readiness of the building, but also to identify the shortcomings and difficulties in applying the methodology proposed by the European project.
In the second case, the evaluation of the SRI allowed a comparison of two different approaches in defining the comfort of an indoor environment: one more scientific based on the use of recorded data and indices obtained by them and the other obtained through the calculation of the indicator. In the second application the aim was also to find a hypothetical univocal definition of the weighting coefficients to be applied in the methodology.
Keywords:
Abstract
Nella Direttiva (UE) 2018/844 viene affrontato il tema dell'uso e dell'integrazione di tecnologie intelligenti all'interno degli edifici nelle ristrutturazioni programmate con anche l’introduzione di un nuovo indicatore per valutare la prontezza degli edifici ad adattarsi alle esigenze degli utenti e della rete: lo Smart Readiness Indicator. Con questo nuovo indicatore, la direttiva mira a comunicare in maniera più diretta ad un maggior numero di persone (utenti, proprietari, ecc. ) il valore aggiunto di avere tecnologie ITC in un edificio. Se gli utenti comprenderanno il valore di questa trasformazione, saranno più motivati a investirci tempo e denaro.
L'indicatore viene quindi definito come uno strumento che fornisce informazioni sulla disponibilità degli edifici ad interagire con le reti energetiche esterne e con gli occupanti degli edifici stessi per garantire un funzionamento più efficiente e una migliore prestazione energetica grazie alle tecnologie ITC. La valutazione dell'indicatore, attraverso la verifica dei servizi presenti, permette ai potenziali investitori di capire come investire le proprie risorse in un ipotetico retrofit dell’edificio.
Per comprendere meglio il funzionamento di questo indicatore, si è deciso di applicarlo a due studi di caso, uno italiano e uno straniero. Questo esperimento ha permesso nel primo caso di utilizzare un approccio critico non solo per valutare il livello di prontezza dell'edificio, ma anche per identificare le carenze e le difficoltà di applicazione della metodologia proposta dal progetto europeo.
Nel secondo caso, la valutazione dell'SRI ha permesso di confrontare due diversi approcci nella definizione del comfort di un ambiente interno: uno più scientifico basato sull'uso di dati registrati e indici ottenuti in seguito e l'altro ottenuto attraverso il calcolo dell'indicatore. Nella seconda applicazione l'obiettivo era anche quello di trovare un'ipotetica definizione univoca dei coefficienti di ponderazione da applicare nella metodologia.
Keywords:
Index
Acronyms
Introduction
Analysis of the contents of the new Energy Performance of Buildings Directive - Directive (EU) 2018/844
2.1 Subjects and instruments
2.2 The innovations introduced by Art. 8: the SRI and the attention to the mobility
2.3 The improvements desidered by the the Directive (UE) 2018/844 and the comparison with the Directive 2010/31/ EU
2.4 Critics and gaps of the document
Review of the current definitions and interpretations of the concept of Smartness in building sector
3.1 Smart building role
3.2 Methodologies to evaluate the smartness
The Smart Readiness Indicator
4.1 Smart technologies 4.2 The definition
4.3 Why it is introduced?
4.4 Calculation methodology of the SRI launched by the European project 4.4.1 STEP 1 -Which services should be asset?
4.4.2 STEP 2 and 3 - Functionality level and related impact scores
4.4.3 STEP 4 -Weighting coefficient
4.4.4 STEP 5 - Calculation of the SRI percentage
4.5 A previous application method to rate the smartness: comparison with the SRI
Case study 1- Orologio Living Apartments (Torino)
5.1 Description of the building 5.2 The system
5.3 Adhesion to Mobistyle project 5.4 The building controlled parameters
5.5 Application of the SRI evaluation 5.6 Sensitivity analysis
SRI weighting coefficient table definition: a solution based on the research on IEQ factors and weighting coefficient theories used to combine them
6.1 IEQ and its importance
6.2 The relation between the SRI and the EPBD (EU) 2018/844
6.3 The definition of Indoor Environmental Comfort
6.4 Weighting coefficient definition 6.5 A survey to solve the weighting coefficient definition
Case study 2 - Departamento de Engenharia Mecânica(Coimbra)
7.1 Description of the building 7.2 Application of the SRI evaluation 7.2.1 Assessment of the building services
7.2.2 Weighting factors: SRI score before and after the survey answers
A monitoring campaign to evaluate IEQ parameters
8.1 The work instruments
8.2 The characteristic of the monitored room
8.3 The collected data
8.3.1 Indoor vs outdoor 8.3.2 Clothing insulation – CLO 8.3.3 PMV and PPD 8.3.4 VOCs 8.3.5 Illuminance Conclusions References
p. 11
p. 15
p. 17
p. 28
p. 38
p. 51
p. 86
p. 74
p. 100
p. 104
p. 65
1
2
3
4
5
6
8
9
7
10 11
Acronyms
BACS - Building & Automation Control System
BREEAM - Building Research Establishment Environmental Assessment Method EPBD - Energy Performance of Buildings Directive
IAQ – Indoor Air Quality
ICC – Combined Comfort Index IEQ – Indoor Environmental Quality
LEED - Leadership in Energy and Environmental Design PMV - Predicted Mean Vote
PPD - Percentage of People Dissatisfied SRI – Smart Readiness Indicator
TBS – Technical Building System TC – Thermal Comfort
When we say things like "People don't change" it drives scientists crazy. Because change is literally the only constant in all of science. Energy, matter, it's always changing. Morphing. Merging. Growing. Dying. It's the way people try not to change that's unnatural. The way we cling to what things were instead of letting them be what they are. The way we cling to old memories instead of forming new ones. The way we insist on believing, despite every scientific indication, that anything in this lifetime is permanent. Change is constant. How we experience change, that's up to us.
"
15 14
Introduction
The European Union attributes 36% of CO2 emissions and the 40% of the energy consumption to the building stock. The members of the European Union are constantly researching on this topic and part of the results of this work are partly expressed in the Directive (EU) 2018/844 in which buildings are the main subject of all the proposals made. The main objective to be achieved is to reduce greenhouse gases by at least 40% compared to 1990 levels. The functioning of buildings requires a significant use of energy and reducing the demand for it would have a strong impact on the achievement of the goal by 2030 [1]. The final goal is to transform all the building in nZEB decreasing the energy bill costs and improving the users daily life.
However, the last directive introduces another major challenge: the achievement of the objectives described above, also through the introduction of building automation. The inclusion of technological devices capable of monitoring the daily actions that occur inside the building would be able to provide useful information to complete the building characteristics figure. Knowing the building well would allow the action on its technological deficits and consequently a better response to the needs of those who occupy or manage it. [3]
The objective of this research is in fact to understand, study and subsequently explain one of the major innovations introduced by the Directive (EU) 2018/844: the Smart Readiness Indicator. This work aims to analyse it theoretically and then define its gaps by applying it to real case studies. The result of this path would allow a more targeted search that would lead to the resolution of all the criticisms found. [9]
The main subject of this thesis is the Smart Readiness Indicator, an indicator that measures the smartness of the building. In order to better understand this indicator,
16 17 initial research work was carried out on the
document in which it was introduced for the first time, explaining its objectives and innovations in chapter 2. Subsequently, in chapter 3, the different conetions of smartness present to date, the indicators that measure it and the methodologies to define these indicators were defined. Chapter 4 critically illustrates the methodology for calculating the indicator proposed by the European project as the final result of work produced by a group of technical experts. Chapter 5 describes the application of the indicator to an Italian case study and the relative criticalities found. Among these, the major one refers to the definition of a weighting coefficient table to be used during the calculation. In order to find a solution, in chapter 6, the SRI is related to another aggregate indicator, thus understanding how experts currently behave in defining the weight percentages to be associated with the
different quantities that could influence the IEQ. Chapter 7 shows the application of the calculation to the second case study in Portugal and comments the results obtained in terms of comfort, well-being and health, two categories which would be largely affected if the result of the calculation were high. In chapter 8 the quantities influencing the two categories commented on in the previous chapter are measured and verified in the traditional way to demonstrate the absence of a relationship between the results obtained by using the indicator and those measured with a sensor instrument.
In the end, chapter 9 deals with the conclusions and the awareness reached at the end of this research both through the in-depth bibliographic research that has addressed several points and through the application of the indicator on two real case studies.
Analysis of the contents of
the new Energy Performance
Directive (EU) 2018/844
The European Union attributes 36% of CO2 emissions to the building stock. The members of the European Union are constantly researching on this topic and part of the results of this work are partly expressed in the Directive (EU) 2018/844 in which buildings are the main subject of all the proposals made. The main objective to be achieved is to reduce greenhouse gases by at least 40% compared to 1990 levels. The functioning of buildings requires a significant use of energy and reducing the demand for it would have a strong impact on the achievement of the goal by 2030 [1].
2.1 Directive (EU) 2018/844
objectives
At the end of June, the new EPBD (Energy Performance of Buildings Directive), which amends the previous one - Directive 2010/31/EU - is published in the Official Journal of the European Union. The aim is to transform most of the building stock into nZEB (nearly Zero Energy Building) by
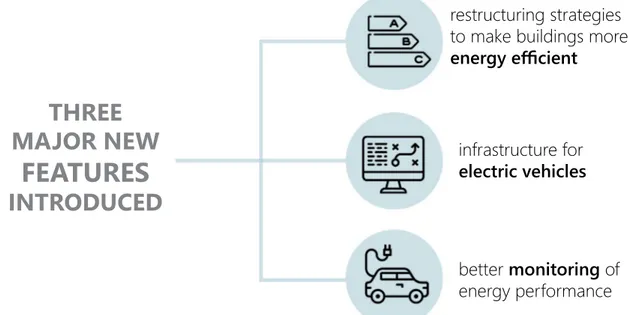
2050. The three main points introduced in this document are the implementation of strategies to make buildings more energy efficient, the introduction of infrastructure for electric vehicles and the implementation of energy performance monitoring.
The current European scenario contains 75% of Europe’s building stock that is energy inefficient and needs to speed up renovation times with a focus on smart building technologies [2].
The new Directive focuses on the building, identifying it as the key to achieving the new objectives for the future. The innovations that the new directive presents are:
• long-term renewal strategies to achieve the decarbonisation target by 2050;
• the smart readiness indicator for buildings to assess the smartness of a building called SRI (Smart Readiness Indicator);
18 19 • support for the development of
e-mobility infrastructures in building car parks;
• greater transparency in the procedures for calculating energy efficiency;
• an advancement in building automation through the insertion of devices in everyday life that, for example, are able to control the temperature inside a room.
By introducing long-term strategies, the Directive try to ensure that public funds are actually used and to encourage an active action it creates some requests to Member States. They must aim to have
a heritage of buildings decarbonized by 2050, to prepare for an effective transformation of existing buildings into nearly zero energy buildings, but above all they must set indicative milestones to be verified in 2030, 2040 and 2050 [16]. The issue of electro mobility is addressed through the submission of information on the number of car parks according to the type of building: a minimum number of charging points must be placed in all non-residential buildings that have more than 20 car parks by 2025, at least one for every 10 car parks in both new and renovated. Another indication concerns
THREE
MAJOR NEW
FEATURES
INTRODUCED
restructuring strategies to make buildings more
energy efficient
infrastructure for
electric vehicles
better monitoring of energy performance
Figure 1. Schematic representation of the major innovations introduced in the Directive (EU) 2018/844.
the simplification of charging points and the provision of economic exemptions for those who will embrace these innovations. A further recommendation of the Directive is the adoption of building control and automation systems as well as the use of self-regulating devices. This is because, if it is economically feasible in large non-residential buildings, automation and control systems should be in place by 2025 when the effective rated power of 290 kW for combined heating or heating and ventilation systems is exceeded. Another case for which the directive recommends the inclusion of self-regulating devices, to independently control the temperature in a room, is that in which the cost of introducing the device is less than 10% of the total costs incurred for the inclusion of all heat generators replaced.
A “building automation and control system” is defined as “a system comprising all products, software and engineering services that can support energy efficient, economical and safe operation of technical building systems through automatic controls and by facilitating the manual management of those technical building systems” [3].
This means that automation and control
systems are a set of elements both concrete (real physical products) and abstract (engineering software) that through their presence are able to contribute to a better success of actions related to energy, economic or security. Based on how it is defined and explained in the document of the new Directive, a building control and automation system is able to:
• constantly monitor the system allowing the saving and comparison of data to improve the use of energy; • compare the energy efficiency of
multiple buildings, identifying any leaks or system failures and alerting a technician responsible for improving the situation;
• allow communication between the connected technical systems and other devices present in the buildings, but also with technical systems of different membership.
So, these tools help the building’s plant system to get closer to having an automatic control and easy monitoring of the system itself. The monitoring and control system must be able to continuously monitor energy consumption data and then analyse it at a later stage. Through
20 21 this data it should also be able to detect
faults and make comparisons with other systems belonging to the building itself, but also to different buildings.
The EPBD directive does not give many concrete examples of what can be the control and automation systems of a building, in fact it only talks about possible devices that are able to regulate the indoor air temperature and sensors for monitoring the indoor air quality. [3]
2.2 Subjects and
instruments
The protagonists of this revolution are the Member States. Each of them will have to find its own retrofit strategy to achieve greater energy efficiency, but also to decarbonize the building stock by 2050. The same retrofit strategy could also be used to improve the security in case of fire or earthquake.
The Member States therefore have a role to play in better defining the guidelines laid down in the Directive. In order to facilitate the implementation of certain necessary retrofit strategies, they will need to draw up a work plan and financing programmes for both new and existing buildings. In order to carry out these programs in the
most efficient way, it is necessary to have the technical and theoretical preparation of experienced personnel in the field of construction and energy [1].
However, three instruments are introduced into the Directive, which can help the Member States in their work, which are: • the trigger point;
• the one – stop – shop;
• the building renovation passport.
Figure 2. Graphical represantion of the 3 main instrument to achieve Member States objectives.
Trigger points can be defined as glimmers of opportunity, certain periods in the life of the building in which it is most appropriate to make interventions. It would therefore be useful to be able to understand the right time to make a deep transformation and the type of intervention to be taken. The aim is to transform reftrofit measures into investments for life. The interventions, in fact, will not deal with the resolution of a single specific problem, but with the identification and resolution of other common problems. All these measures are also aimed at improving energy performance.
The second instrument introduced is the one – stop – shop defined as a sort of information center where people can better understand how retrofit measures and financial tools run. [3]
The attempt to digitise the energy system through the integration of, for example, renewable energies or smart grids allows a transformation at the energy level. This notion has direct connections and consequences on the building landscape that tries to digitize through the attempt to transform buildings into intelligent and connected structures.
These transformations would allow
significant energy savings for users by giving them precise information on the trend of their consumption and also allowing technicians to better manage the system by having more data about it. It is therefore necessary to make users aware of the concrete benefits that can be obtained with smart-ready systems and digital solutions, but above all to encourage them by means of economic facilitations in order to obtain greater feedback from them.
The introduction of these techniques can also be of great help in order to better monitor large systems by avoiding continuous on-site inspections. The reflections of these new technologies would affect both consumers and owners through considerable energy savings. [4] Returning to the tools introduced in the directive mentioned above, the third, the building renovation passport, is defined as a personalized document dedicated to the building that allows the definition of some information about an hypothetical retrofit. In this document it is possible to find details on how can be made a deep retrofit and the stages in which it can be done, but also the duration in years that it may take (for example 15-20 years) [3].
22 23
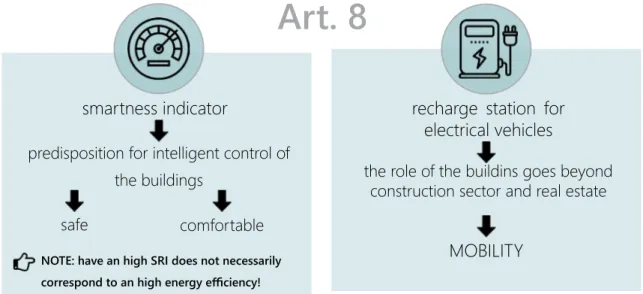
2.3 Art. 8 of the new Directive
The great innovation of this directive, however, is found in Article 8, which talks about a new indicator that can describe the smart readiness of a building, but also about the inclusion of charging points for electric vehicles.
Figure 3. Schematic representation of the major innovations introduced in Art. 8 of the Directive (EU) 2018/844.
The proposed indicator is a real innovation as it not only concerns energy efficiency, but it also touches on aspects related to comfort and safety inside a building. A good indicator result is not directly proportional to the energy performance of the systems and therefore does not ensure high energy efficiency. The indicator will be synonymous with the intelligence of the building, but if, for example, it is poorly insulated it cannot be, however intelligent, energy efficient and comfortable.
The Directive’s intention to extend the subject of energy efficiency beyond the building sector is also interesting, introducing also in the mobility area, which still has a strong impact on the global energy aspects.
“The smart readiness indicator should be used to measure the capacity of buildings to use information and communication technologies and electronic systems to adapt the operation of buildings to the needs of the occupants and the grid and to improve the energy efficiency and overall performance of buildings.
Art. 8
smartness indicator recharge station for
electrical vehicles predisposition for intelligent control of
the buildings
safe comfortable
NOTE: have an high SRI does not necessarily correspond to an high energy efficiency!
the role of the buildins goes beyond construction sector and real estate
MOBILITY
The smart readiness indicator should raise awareness amongst building owners and occupants of the value behind building automation and electronic monitoring of technical building systems and should give confidence to occupants about the actual savings of those new enhanced-functionalities.”
The indicator introduced by the Directive is called Smart Readiness Indicator (SRI) and it is defined as a way to measure how well a building can adapt to the needs of its occupants and the grid while improving its energy efficiency and performance. However, it is also specified that deciding to adopt this indicator is an optional procedure for Member States.
The Directive also refers to the hypothetical calculation methodology that should be followed to obtain the indicator. The procedures to be followed are not directly specified, but directives to be used in the definition of the calculation are explained. The methodology must in fact include a whole series of parameters both individually and allowing communication between them. Some features that must be included are related to building automation and the control of the system:
devices able to allow the regulation of the indoor temperature, smart meters, infrastructures for the electrical vehicle charging and the possibility to store the renewable energies produced. All this without, of course, losing sight of the objectives regarding energy efficiency, the improvement of indoor climatic conditions and the performance of the system.
The methodology should refer in particular to three key features present in the building. The first refers to his ability to use renewable energy sources to support energy consumption. The second point is the ability that the building should have to adapt to the needs of the user by creating ideal conditions of internal comfort and allowing him to monitor consumption. Finally, the flexibility that the building can have in the need for electricity by participating both actively and passively in the demand.
As specified in the ANNEX IA of the Directive (UE) 2018/844, the calculation methodology should result in a clear and easy-to-read value for all stakeholders involved in the construction landscape. The important thing is that there is a common agreement of the European
24 25 Union to evaluate how much a building
is ready through a well-defined indicator and a shared methodology for calculating this. [3]
2.4 Improvements
The revision of this document (EPBD) has been essential in order to improve on some of the aspects and topics already discussed, but also to introduce new ones.
“The EPBD review represents an opportunity to better define the smartness concept, reinforce conditions applicable to BEMS, further promote building automation and use of website platforms and apps, and foresee the introduction of standards to ensure interoperability.”
From the previous quotation it can be deduced that this new Directive focuses more attention on aspects related to building automation and the use of technological-informatics systems, recognizing them as a valuable aid in achieving greater energy efficiency of buildings. Paragraph 15 specifies indeed that the building’s energy consumption and performance do not depend only on its envelope. It is clear that over the years the envelope aspect has been extended
and there has been considerable progress on it. For this reason it is now necessary to focus all the energies on another area in order to try to achieve the various objectives set. The topic of automation would be one of the areas to be explored through the installation of devices that can provide useful information about the building and facilitate its control. The installation of intelligent devices, sensors and control devices would help to carry out different actions on the internal spaces, from the control of the internal air temperature to the connection of these with the external networks. This could provide more specific data on energy consumption and in general on the working of the system. [1]
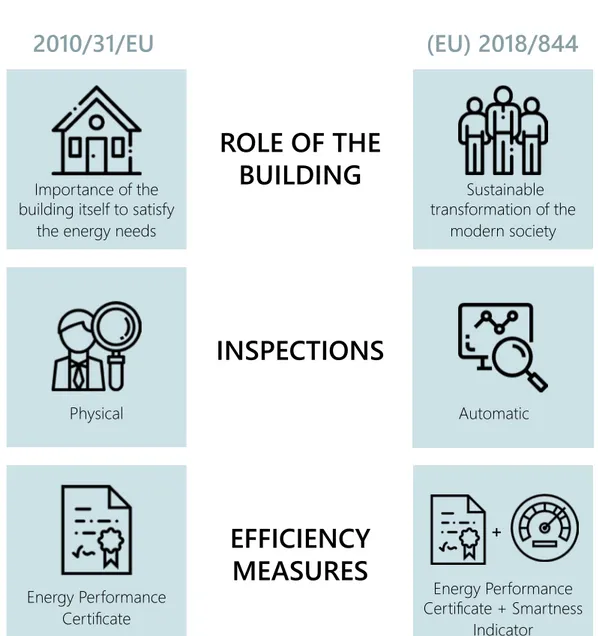
2.5 Comparison between
the two Directives: 2010/31/
EU and (UE) 2018/844
The new Directive amends and implements the previous one issued, some years ago, in 2010. The most recent considers the building as an element capable of being part of a process that aims to meet the needs of consumers and the environment. In the past, however, the only objective was to create an entity that would have certain characteristics necessary to satisfy
the energy needs.
2010/31/EU
(EU) 2018/844
ROLE OF THE
BUILDING
INSPECTIONS
EFFICIENCY
MEASURES
Importance of the building itself to satisfythe energy needs
Sustainable transformation of the modern society Physical Automatic Energy Performance Certificate Energy Performance Certificate + Smartness Indicator +
Controlling a building has always been a practical operation to be carried out physically. Through physical inspections carried out by expert technicians, it was possible to become aware of faults and, if necessary, resolve them, trace consumption and, in general, have an overview of the values relating to the energy performance of a building. All these features can now be at the fingertips of operators who manage the
26 27 operation and maintenance of a system,
but also of the user who lives directly with it. The insistence in the new Directive on the desire to increase the level of building automation by allowing automatic inspections of its operation in real time, which also bring significant time savings, is therefore fundamental.
Focusing on energy performance, as we know until now, all the information related have always been declared and explained in the certified energy performance (EPC). These documents are intended to provide certain information to users and consumers when a building is to be rented or sold, such as, for example, current legal standards that allow comparisons to be made and the energy performance of the building to be assessed. Within this sheet there are also recommendations on possible actions to be taken to improve energy performance. In fact, some information that is not mandatory but can be added is specific to consumptions, how to reduce them, the cost of any intervention and the hypotetically payback periods.
Today, however, the revision of the directive introduces the Smart Readiness Indicator, previously mentioned, which proves to
be a valuable complementary element to the EPC. In fact, this innovation should make stakeholders aware of the power of automation and smart devices on a future improvement in energy performance. This result would be achieved by the ability of the building, through the help of these technological introductions to adapt responding in the most immediate way to the needs of those who live there and the network. Users should gain more confidence in the real power that these innovations can have in achieving real future savings. [5] [6] [7]
2.6 Final critics
Until now, various information regarding the new Directive has been addressed: objectives, innovations, definitions and hopes for the future, and it seems that this document has touched most of the research areas that are fundamental to achieving the goals set by the European community in terms of energy efficiency and reduction of consumption and emissions of harmful gases. But is it actually so complete and specific? Can it give an unequivocal definition of the topics covered?
With a deep reading we can say that there are some gaps in the definition of some
aspects or in the development of others. The most frequently encountered criticisms relate to:
• the role of the occupant, which is not well defined within this strategy of transformation designed for buildings. Will it play an active or passive role? • the definition of the automation
grades at which the building can aspire, perhaps divided according to the characteristics it may or may not have;
• the illustration of a number of examples of what is defined a self-regulation device;
• an unequivocal definition of smartness, a concept that has been cited many times, but never explicitly described; • a definition of a smart building and
the characteristics it should have in order to be smart;
• the lack of a calculation methodology for obtaining the value of SRI, in fact there are only guidelines and requirements to be complied with. •
In the next chapters the aim is to remedy these shortcomings found in the new directive through a deep bibliographic research. In fact, the goal will be to define the missing aspects by finding answers in
other documents to ensure that we can have a complete picture of the energy, economic and innovation landscape in the building sector.
28 29
Review of the current
definitions and interpretations
of the concept of smartness
Nowadays, the concept of smartness is beginning to be part of the everyday language of most of the actors in the construction world. It is also addressed in the revision of the EPBD 2018. However, in this content, no univocal definition of the concept is given. In fact, the text could be freely red and interpreted by the readers obtaining hypothetical misunderstandings and different opinions.
The word smart changes its meaning over time and is attributed to different contexts and elements such as “city”. In 2006 and 2008, respectively, according to Shapiro and Hollands “Smarter cities start from
the human capital side, rather than blindly believing that ICT can automatically create a smart city”. A year later Giffinger, Fertner,
Kramar Meijers, & Pichler-Milanović define the smart city as “…a well performing
city built on the “smart” combination of endowments and activities of self-decisive, independent and aware citizens”. In both
definitions, the man or the citizen, in the
second case, is placed at the centre of this revolution or is considered the principle of transformation when it is aware of the possible advantages and improvements. A few years later, in 2011, the human figure was merged with new technologies to achieve this innovative vision: “City
tends to be smart when investments in human and social capital and traditional (transport) and modern (ICT) infrastructure fuel sustainable economic growth and a high quality of life, with a wise management of natural resources, through participatory governance.”
Subsequently, this definition is integrated with new interesting references for the development of cities and in general for all the things that can become smart over time such as sustainability and security and about this Sansaverino, Vaccaro and Zizzo express themselves as “The word “smart”
includes various features as technological and inter-connected, but also sustainable, comfortable, attractive, safe”. In the same
3
year for Angelidou “Smart cities representa conceptual urban development model based on the utilization of human, collective, and technological capital for the enhancement of development and prosperity in urban agglomerations”.
This definition therefore confirms the importance of collaboration between human and technological resources, which becomes the key combination for the success of this evolution. As Anttiroiko states, having a smarter city could also intervene in the improvement of the local economic and political field. This it would lead to the creation of additional services for citizens thanks to the support of new technologies influencing the whole society [8].
Nowadays, talking about smartness in an architectural context and therefore referring to buildings is defined as “…the
ability of a building or its systems to sense, interpret, communicate and actively respond in an efficient manner to changing conditions in relation to the operation of technical building systems or the external environment (including energy grids) and to demands from building occupants”. [9]
The meaning of smartness can belong to two different interpretations. The first
relates the concept only and exclusively to mobile devices without taking into account the environment and its consequences, while the second introduces the concept of community, giving importance to the improvement of well-being and quality of life within it. At this rate, the word smart begins to incorporate inside more aspects no longer related only to innovative technologies, but, for example, also to sustainability, safety and comfort.
SMARTNESS
dissemination of mobile applications
enhancement of people’s well-being and
quality of life presence of a scenario
that reflects the users' expectations
presence of a scenario that reflects the environment's
expectations
Figure 5. Scheme of the 4 main interpretations of smartness.
30 31 The user perceives smartness as something that is easy to use and sustain during the
time, healthy and accessible for everyone, that brings improvements both for the environment and for an economic return over time, but above all that is useful. The perception of the environment instead considers this concept with a view to obtaining a phenomenon that adapts to the local climate and does not create harmful gas emissions, that is sustainable, renewable and respects the local characteristics. The thing that accumulates these two points of view is the “green” part of the concept of smartness, the idea that a smart city or building is healthy for both the environment and man. [10]
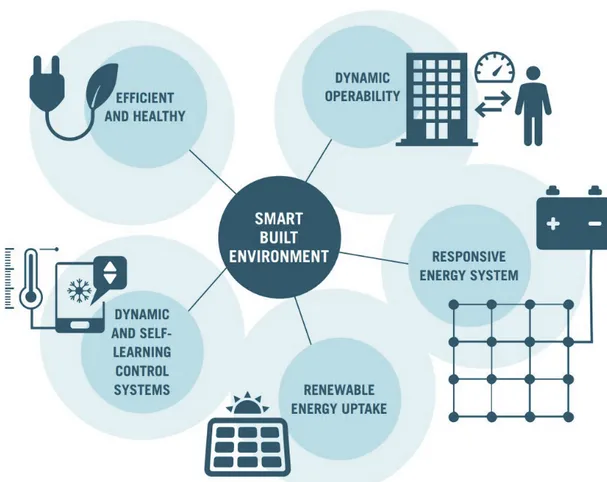
2.6 Smart building role
Figure 6. Buildings importance in the definition of a smart built environment. [11]
Nowadays the energy market needs a major transformation in which the role of the building could be relevant and active. Transforming a building into a smart building would enable Europe to create an energy sector that uses renewable, decentralised and interconnected resources and achieve greater efficiency by abandoning an old centralised system based on fossil fuel consumption. This process of improvement would also upgrade the indoor living conditions and working environment of users,
factors that, for example, influence absenteeism and productivity in the workplace. Ensuring a reasonable IEQ is essential to be able to fulfil the initial function established for the building. [22] Making some improvements to buildings can become the key to a marked increase in energy efficiency. The strategy is to enclose:
• energy storage systems;
• in-situ renewable electricity production;
• and ensure the building’s ability to regulate itself according to demand and response from outside.
All these innovations go against the previous conception where the building was seen only as an energy consumer. [11]
Empowerer and users Maximise energy efficiency ENERGY EFFICIENCY RENEWABLE ELECTRICITY PRODUCTION DEMANDE RESPONSE ENERGY RESPONSE Dynamic price signals RES Encourage new business model Energy storage
Build smart and interconnetted district Demand response capacity Infrastrcuture for electrical vehicle Decarbonize heating and cooling BUILDINGS
Figure 7. Up: relation between energy efficiency and building flexibility. Down: 10 principles of buildings that work as micro energy-hubs. [4]
32 33 A smart building allows his constant
monitoring, obtaining essential information to ensure that it best meets the needs of those who occupy it and increasing its energy performance. It is also important his readiness to interfere with electric vehicles. [12]
It is well known that 40% of total energy consumption is due to low energy efficiency buildings. That is also why the 2010 EPBD Directive introduced a requirement for all new buildings to be nZEB at least, so that their energy consumption was very close to zero. The future outlook is for the entire building sector to be transformed into nZEB, which would have a major impact on the entire energy sector. This type of building would allow a reduction in GHG (Greenhouse Gases), a decrease in the value of energy bills as well as a marked improvement in the living conditions of different types of users.
ENERGY
• saved • stored • usedIN BUILDINGS
The goal is therefore to make buildings connected to the energy structure, making sure that they are able to produce, store and use energy efficiently. The effect of this action is amplified when as many buildings as possible are involved.
The BPIE (European Institute for Building Performance) has created a document listing 10 useful principles to be followed, individually or in their entirety, to maintain a more effective result, to enable a building to play a key role in the transformation described above. The principles are: increasing the energy efficiency of buildings, increasing the production of renewable energy, ensuring that the building can store the energy produced, improving the response to demand and response, decarbonizing the heating and cooling system, giving greater prominence to end users, having a real update of the variation in prices, encourage investment, build interconnected neighbourhoods and create useful infrastructure for electric vehicles (Figure 7). Once the analysis has been completed in relation to the innovations expected and introduced by the new Directive, it is important for this thesis to examine in depth the role played by the building in the broader definition of this concept and, secondly, the role played by the occupant of the Figure 8. How to treat energy in buldings.
building itself. The building is beginning to be seen as a necessary element to be able to have an upgrade in all areas involved. Firstly, it contributes to the creation of various benefits for the citizens of the European Union, which can be the reduction of energy bills, the formation of new jobs and the construction of more comfortable homes. At the same time, the new building will also be able to make more balanced use of energy flows.
As previously mentioned, the user also enjoys a new role in this progressive transformation of the building through the introduction of technological controls and smart applications. The inclusion of smart meters inside a building allows the user to have a greater awareness and greater control of their energy system and through these devices it can also have a constant measurement of energy consumption that improves the interaction between demand and response. The introduction of these devices aims at reducing energy consumption and creating intelligent links between the different buildings involved, the users and the relevant energy sphere. In fact, the user is able to control his energy consumption according to his preferences and the signals transmitted from outside. The combination and collaboration
between constant monitoring and the presence of new technologies allows to obtain relevant results for different figures, professional and not. The collected data allow to know the behaviour of the user who lives inside the building and therefore to have a constant monitoring on its consumption, but also reports about technical defects, failures or elements that need maintenance. Allowing the user to have this technical information in a clear and transparent way will also increase his awareness.
• provide information on the actual
performance of end-user building
• notifying the user on consumption patterns, technical defects and needed
maintenance
These services will increase users confidence
CONTINUOUS MONITORING NEW
TECHNOLOGIES
Figure 9. Concequences of the introduction of new technologies and continuos monitoring in the buildings.
34 35 Entrusting users with this responsibility
and possibility to control the energy consumption of their buildings, will bring them to long-term invest in intelligent and cost-effective solutions. To affirm the idea of buildings that become key elements for an energy transformation they should create great improvements also at the social level. A conscious occupier can simultaneously, thanks to an intellectual maturity, control the production of energy in situ, but also domestic consumption, significantly reduces bills and contributes to the development of a culture in which electric vehicles are the most advanced means of transport . Informing inhabitants about their building and the improvements that can be achieved through constant monitoring and data collection, allows them to enlarge their view of the energy system, under transformation, up to the scale of interconnected neighbourhoods and then smart cities. [4]
2.6 Methodologies to
evaluate the smartness
Having intelligent buildings will bring many benefits. Users will be able to know in real time information on the use of energy and explain their needs towards the building for a comfortable lifestyle. This will allow a conscious use of energy,
increasingly produced through renewable sources, which follows the requests issued by the building without having waste. Having an intelligent control of the building also allows a better supervision of the aspects related to the maintenance and repair of this. In order to evaluate all these characteristics that a building can have, it is necessary to introduce an indicator that meets the requirements summarised in the following quotation.
“A smartness indicator will reflect the ability of buildings to:
• adjust to the needs of the user and empower building occupants providing information on operational energy consumption
• ensure efficient and comfortable building operation, signal when systems need maintenance or repair • readiness of the building to participate
charge electric vehicles and host energy storage systems.” [13]
Being able to define the level of smartness by means of an indicator is not only a priority at the scale of the building. As we find explained in the study conducted by Dall’O, Bruni, Panza, Sarto and Khayatian also at the scale of the city (small or medium sized), is necessary to be able to
assess the index of achievable smartness. Even in cities, by improving smartness, we can obtain progress in the field of energy and environmental sustainability, as well as necessary progress in the technological range.
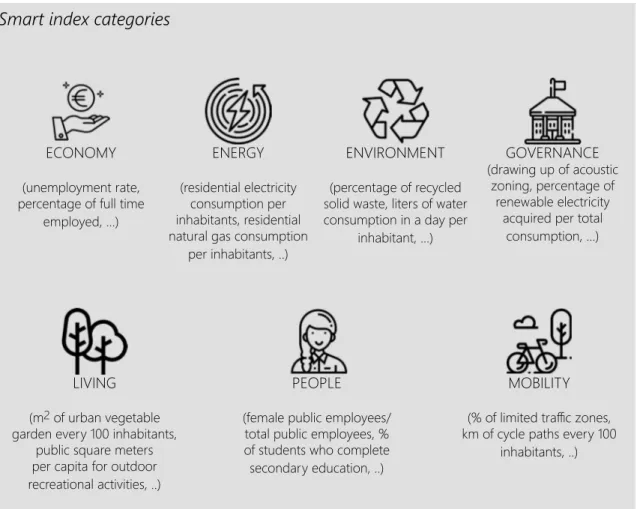
The methodology considered in this case wants to define the level of smartness of each category and then put them together to realize a single final value. Seven categories are considered in all: smart economy, smart energy, smart environment, smart governance, smart living, smart people and smart mobility (Figure 10). Being able to consider them individually, in an initial analysis, allows to go and act on the lacking areas.
ECONOMY
(unemployment rate, percentage of full time
employed, ...)
ENERGY
(residential electricity consumption per inhabitants, residential natural gas consumption
per inhabitants, ..)
PEOPLE
(female public employees/ total public employees, % of students who complete secondary education, ..)
LIVING
(m2 of urban vegetable
garden every 100 inhabitants, public square meters per capita for outdoor recreational activities, ..)
MOBILITY
(% of limited traffic zones, km of cycle paths every 100
inhabitants, ..)
ENVIRONMENT
(percentage of recycled solid waste, liters of water consumption in a day per
inhabitant, ...)
GOVERNANCE
(drawing up of acoustic zoning, percentage of
renewable electricity acquired per total
consumption, ...)
Smart index categories
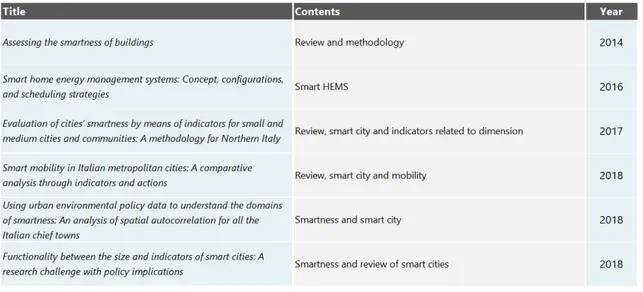
36 37 After reading and studying different articles dealing with smartness and smartness
indicators (Tables 1 and 2), it was possible to identify different types of indicators present until now and methods for calculating them.
The main smartness indicators identified are: • energy class;
• SRI;
• related to the n’ of gadgets;
• related to the n’ of systems that contribute to the internal comfort;
• related to the n’ of technical items controlled by BEMS (building energy management system).
Table 1. Scientific article related to smartness indicators
Table 2. Scientific article related to definition of smartness
These kinds of indicators can be calculated with different methodologies: 4 have been identified.
• Survey for professionals: collections of questions to be answered by experienced technicians and professionals. The average of the responses obtained leads to a final value.
• Check list approach: list of elements, systems and functions whose presence must be verified. The more points there are, the better the result will be.
• Indicators to be calculated: this category provides obtaining a numerical or percentage value through mathematical processes and formulas.
• Score assessment: selected people will have to assign scores to certain items or categories in a document or list. Imagine A
In these first two chapters the research dealt with the new EPBD, the objectives it imposes, but also the innovative concepts that it introduces. One of these is the “Smart Readiness Indicator” mentioned in the article 8, which is inserted in order to measure the intelligence of a building
in the future. Subsequently it was defined what was meant by smartness and which are now the indicators or systems on the market able to indicate the level of smartness. The next chapter will treats the indicator proposed by the directive, in particular will analyse the first calculation methodology proposed by the European Union to define the value of this indicator for a building.
38 39
The Smart Readiness Indicator
4
4.1 Smart technologies
The construction sector in Europe should invest in building renovations to achieve energy improvements, but it should also integrate ICT solutions that make the building smart and allow it the possibility to check the recorded data about the different performance. With the introduction of these devices and these technologies, the building recovers points in terms of energy, but also becomes more comfortable and healthier allowing a better use of space by the occupants. The inclusion of intelligent technologies will allow the building to relate both to its inhabitants and to the external network. Today, the role of the building becomes crucial for this transformation, which should reduce the energy consumption, reduce the carbon production and should increase the availability of renewable energy.
Figure 11. Expected advantages after the introduction of smart technologies in buildings. [9]
The EPBD underlines the need to introduce smart technologies into the buildings but also to try to define the readiness of a building in being smart through the Smart Readiness Indicator (SRI). With this indicator it should be made more explicit the importance of having smart devices inside a building to a greater number of stakeholders (occupants, technicians, owners, etc.). It is appropriate that those who will invest in the introduction of these innovations is aware and well informed [15].
4.2 The definition
“A Smart Readiness Indicator (SRI) for buildings shall thus provide information on the technological readiness of buildings to interact with their occupants and the energy grids, and their capabilities for more efficient operation and better performance through ICT technologies.”
This indicator allows to find a common language between different buildings to evaluate and compare them within the construction market considering both intelligent and low-performing services. These multiple motivations can contribute to the affirmation of technologies and smart devices inside buildings. The aggregation of VITO, Waide Strategic Efficiency, Ecofys and OFFIS was responsible for the study completed in August 2018. Online it is possible to find the final report in which they are summarized and illustrated the main points achieved by the project. The outcome of the study is a methodology that meets a number of requirements and touches on several points. In fact, the result of the indicator must be a clear method of communication for all actors in the building sector of
some features of the building. It should be relevant in achieving the objectives proposed by the EPBD 2018, because it is related to several important issues such as energy resources, health or consumer safety, and it should provide information in order to encourage investments with positive consequences. In addition, the assessment of the indicator must strike a balance between being detailed and having limited costs and duration. The calculation can be carried out by different figures, both specialized technicians and simply the owners of the building in question thanks to the flexibility of the methodology that the study is committed to ensure. [9]
4.2 Why it is introduced?
The introduction of this indicator through the new EPBD Directive born
Figure 12. Summary of the three main readinesses that the buildings could achieve through the introduction of ICT technologies. [9]
40 41 from the desire to assess how much
buildings are able to use recorded data and technological systems to transform themselves and meet the needs of the occupants and the network. In this way they could achieve a marked improvement in their performance, in particular in energy efficiency field. This number should have a great responsibility, which is to increase the transparency of the value of the automated and automatically monitored building in the eyes of both the owner and the occupant. The occupants will be able, through the introduction of advanced devices that monitor the performance of the building and record the data, to check daily savings achieved. However, the choice to adopt this type of indicator to get more information from the building remains, for now, an optional choice for Member States that can assess to implement it or not.
In general, the new EPBD Directive often deal with the concept of Building Automation and Controls (BACS), which plays an important role in achieving the smart building concept. These systems are therefore expected to create healthier spaces by reducing harmful gas emissions and energy consumption, which it will be mostly renewable, and above all to
help in responding effectively to user demands. The challenge of the Directive is to align the fixed guidelines with those of the indicator in order to achieve the common objectives: the energy efficiency, the quality of the indoor environment and the regulation of demand and response. These are the final results expected for the future buildings and this indicator should be able to represent an added value in this transformation, by showing in a clear and transparent way the potential of the building, to both owners and users. [16]
4.2 Calculation methodology
of the SRI launched by the
European project
The first steps to be taken in the calculation methodology are:
1. the definition of the smart present services within a building. A series of services goes to compose a domain (e.g. cooling, heating, lighting, etc.) 2. the choice of the level of functionality
for each service selected based on the functionalities that it offers
In the following page there is an example of a service present in the lighting domain, the "lighting control", and the different levels of functionality attributable to it.
The next steps to follow are instead:
3. the evaluation of impact criteria (energy savings, comfort, information to occupants, etc.) with the assignment of scores relating to the levels of functionality chosen
4. the definition of the weighting coefficient table related to the impacts
5. the obtaining, through a mathematical operation, of a smart readiness value that brings together domains and impacts. The final result can be presented either in percentage or in energy class. It is also possible to define and read the sub-scores that indicate the percentage of smart readiness for each impact (e.g. 54% on convenience and 78% on wellbeing & health).
lighting control
LIGHTING lightining based on availabilityautomatic on/off switching of automatic dimming of lightning based
on daylight availibility manual on/off control of lightining
Figure 13. Example of a domain, one of its services and the relative functionality levels.
42 43
Figure 15. Domains categories considered in the calculation of SRI. [9]
If we want to resume brefly the steps needed in the calculation we can define 5 ones.
• STEP 1: choose which services are relevant for the building • STEP 2: assess the functionality level of each relevant service • STEP 3: count impact scores related to the impact criteria • STEP 4: definition and application of weightings coefficient • STEP 5: calculate SRI score
4.4.1 STEP 1 -Which services should be asset?
The total of the services that it can be found in the annex are totally 112 (99 if we not consider the “various”).
Each one of these services belong to one of the 10 domains and also can have different functionality levels related to how much the element analysed are smart.
The domains presented in the European project for this methodology are ten.
DOMAINS
Heating
This domain covers all the services that contribute to improving the performance of systems related to heating, from generation to storage and finally to use. Most of the services present refer to technical automation systems related to the heating of indoor environments.
Cooling
The domain deals with everything related to the energy used to create cooling and the devices to control it. The importance of some services depends on the final use of the space examined, the location, the climate and the occupants who use it.
Domestic Hot Water
This domain contains services that deal with the life cycle of domestic hot water within a building from generation to distribution.
Controlled Ventilation
The domain of controlled ventilation deals with services that relate to the internal temperature of an environment and the flow of air within it. The introduction of automatic systems can be very useful to detect parameters in real time and use them to improve indoor comfort and
indoor air quality.
Lighting
In this domain, the services deal with automated lighting according to timetables or detection of people.
Dynamic Building Envelope
This domain deals with the control systems related to the mobile part of the envelope, that is the systems related to the shading and opening of the glass parts. An improvement of these aspects would lead to a real saving on the energy used for heating or cooling, but would also have a positive impact on the comfort of users, both visual and thermal.
Renewable Energy Generation on site
In this domain it is possible to find the services that regulate the mechanism of power generation on site. The steps to be managed are related not only to production, but also to storage and then distribution to the connected grid.
Demand Side Management
The domain has services related to the control of energy demand as a response to requests from the network. It therefore deals with demand management by
44 45 electricity networks and how they are
managed in a more or less smart way.
Electric Vehicle Charging
This domain assesses services related to electric vehicles such as charging points and their functionalities. Storage and consumption capacities are also analysed.
Monitoring and Control
The last domain has services that focus on the characteristics of any sensors
present such as the one that detects the occupation. This can have a number of consequences for heating and ventilation, for example.
Various
In this domain there are services that are not directly related to any of the previous domains, but instead are related to themes, such as security, that do not depend on the technical building system. [9,15,17]
The number of the services that would be considered for the evaluation depends from the type of building that we choose for the application of the indicator.
The process in wich it selected the maximum number of services is called “triage”. If it considered, for example, a single family house the maximum number of services that must be examined is 49, because maybe some domains and their relative services are not relevant. Obviously, if a less number of services it considered the inspection will need less time to be done but also the value of “maximum obtainable score” will be lower even if one of the factors most highlighted in the methodology is the time needed for the procedure, which in the calculation phase differs very much from the expectation of the document. Anyone intends to perform this calculation, will need to analyze well the installations and the present systems in the building because the descriptions supplied to choose the functionality levels are very specific and to answer
Figure 16. Scheme of some domains and an example of the services included. [9]
EV Charging Capacity SERVICES DOMAINS EV Charging Grid balancing ELECTRIC VEHICLES COOLING LIGHTING
HEATING WATERHOT ...
EV Charging information and
connectivity
4.4.2 STEP 2 and 3 - Functionality
level and related impact scores
After choosing the services to be used in the evaluation and understanding which level of functionality to assign to each one of them, based on the systems present in the building in question, we can compare the scores assigned to each level of functionality. These scores can be found in the excel file attached to the
methodology proposed by the European project. In this file it is possible to find all the scores assigned to each service and for each level of functionality in relation with the impact criteria.
The total number of impact criteria shown in the document is 8 and they are related to different subjects: building, users and energy grid.
correctly it is needed to know well the system that is valued in the specific service or to read the relative technical card.
46 47
Energy savings on site
Describes the influence that the chosen services can have on energy savings. Not all the energy used is considered, but the one which can be managed by smart devices.
Flexibility for the grid and storage
It refers to the impact that the services could have on a potential flexibility of the building.
Self-generation
It is related to the services that are related with renewable energy production and
storage on site.
Comfort
It describes the effect that the services can have on the occupant comfort (thermal, visual and acoustic).
Convenience
It refers to the services that make the occupants life “easier” by asking for less control of the system.
Well-being and health
It is related to some positive impact that some services could provide to the
well-IMPACTS
Figure 17. Impact categories of the SRI calculation. [9]
being and health of the users.
Maintenance and fault prediction
It is referred to the positive influence that smart services which allow an automatic fault detection and diagnosis of TBS (Technical Building System) could have.
Information to occupants
It describes the impact of the services that are related to the communication of some information about the building to
the users.
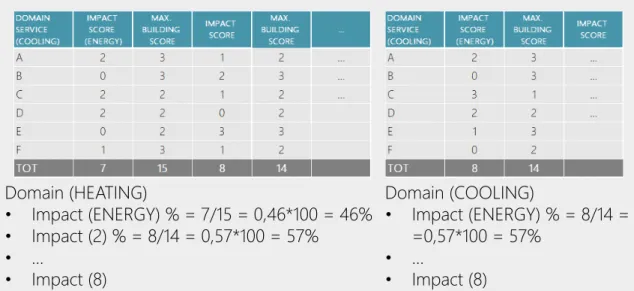
Each service has a functionality level that generate an impact scores that can goes from - 4 to +4.
Figure 18. Up: example of the functionality levels and the relative score assigned. Down: example of the relation between the impact score and the maximum score obtainable by the building. [9]
Domain (HEATING) • Impact (ENERGY) % = 7/15 = 0,46*100 = 46% • Impact (2) % = 8/14 = 0,57*100 = 57% • … • Impact (8) Domain (COOLING) • Impact (ENERGY) % = 8/14 = =0,57*100 = 57% • … • Impact (8)
48 49
4.4.3 STEP 4 - Weighting coefficient
There are no references in the European project document to the levels of
importance to be assigned to the different domains in relation to the impact criteria. If a domain has little or no influence on an impact, it will have a percentage equal to or close to 0% and then the remaining percentage will be distributed among the various domains until it reaches 100%.
The allocation of the different percentages can depend on many factors such as the end use of the building, its location or the preferences of the user who lives there.
Table 7. Example of the relation between the case study building impact scores, the maximum scores obtainable and the relative scores in percentage. [9]
Percentage= ordinal impact score case study building
maximum obtainable score for the case study building
Table 8. Example of one of the weighting coefficient table presented in the calculation methodology. [9]
4.4.4 STEP 5 - Calculation of the
SRI percentage
To calculate the final value of SRI it is necessary to find the percentage related to each impact criteria and then merge them in a weighted final result.
Another way to present the value of SRI, different than the result in percentage, is according to Table 9 in which at each
range of SRI values correspond a class. [9, 15,]
4.5 A previous application method to rate the smartness:
comparison with the SRI
In 2015, Arditi, Mangano and De Marco published the result of a research conducted to define an indicator that could evaluate the smartness of a building. Unlike the existing assessment methods for buildings (for example LEED and BREEAM), this index introduced in their study aims to be in relation not only with energy efficiency, but also with building living costs and user comfort.
Table 9. Relation between SRI result and energy classes. [9]
50 51 The index is given by the combination of a first assignment of values to a list of services
made by a technician and weighting coefficient that are the result of a survey. This index allow the knowledge of the building smartness but also the benchmarking with the values obtained from other buildings.
As it was described before, this indicator is in many ways similar to the Smart Readiness Indicator proposed by the new EPBD, but it is possible to see in detail, in the diagram below, the two indicators compared to better understand the differences. [9,18]
SMARTNESS INDEX (2015)
• Variables defined • Score range 1; 5
• Score range decided by a group of professionals
• Result based on average score
SMART READINESS INDICATOR (2018)
• 112 services • Score range -4; 4
• Score range defined according to functionality level
• Result based on average percentage
Case study
1-Orologio Living Apartments
(Torino)
5
5.1 Description of the building
The case study in which the calculation methodology is applied is the hotel Orologio Living Apartments located in Turin near the city centre. The building was built in the early 1900's and between 2004 and 2005 it was renovated to be used as an accommodation facility by the owner.
The building has six floors above ground of which the first 5 are intended for the hotel. On the different floors there are 20 apartments in total with about 78 beds. On the ground floor there is the reception, the office of the director and a green outdoor area for users. Each apartment has a small kitchen and various appliances such as
To understand if the methodology described in chapter four works to map the building and to know its characteristics, the following step was the application of it in a critical manner on a case study. After an analysis of the building characteristics it was possible to choose the services present and start the calculation of the indicator.
Figure 19 and 20. On the left: photo of the external facade of the hotel. On the right: an example of the interior of a room. [19, 38]
52 53 refrigerator, dishwasher, oven, washing machine, etc. The dimension of each one is
about 35-45 m2.
Figure 21. Plan of one of the room of the Orologio Living Apartments.
5.2 The system
The building is equipped with a heating system consisting of two condensing boilers fired with natural gas. Domestic hot water is produced by one of these two boilers. In addition, there is a 300-litre storage tank that keeps the water at a temperature of 46°. The cooling system consists of a refrigerating unit placed outside the building. The terminals in the distribution network are fan coils, installed in the false ceiling or on the floor, for all rooms except bathrooms where there are decorative radiators.
Figure 22. Photo of the case study building boiler room. [19]
5.3 Adhesion to Mobistyle
project
The building is also part of a European project called Mobistyle: Motivating
end-users Behavioural change by combined ICT based tools and modular Information services on energy use, indoor environment, health and lifestyle which aims to increase
users' knowledge, in order to decrease energy consumption, and improve IEQ and consequently their health. These results should be achieved through the administration of feedback sent to the occupant daily containing advice to take good behavioural habits. The advice sent to the users would be derived from the
analysis of monitoring data of the indoor spaces, subsequently transformed into messages of easy understanding and transmitted through electronic devices such as apps, smart-devices, etc.
In building in which a lot of people are hosted, like for example the hotel, it is necessary to employ experts from different scientific disciplines to develop better the way for giving information to the occupant on their electricity consumption in real time or on the indoor environmental quality through simple messages maybe on the phone. This system could encourage them in having a more reasonable behaviour.

![Figure 16. Scheme of some domains and an example of the services included. [9]](https://thumb-eu.123doks.com/thumbv2/123dokorg/2831681.4324/23.1785.1019.1659.170.640/figure-scheme-domains-example-services-included.webp)
![Table 9. Relation between SRI result and energy classes. [9]](https://thumb-eu.123doks.com/thumbv2/123dokorg/2831681.4324/25.1785.132.765.611.935/table-relation-sri-result-energy-classes.webp)
