1
Submitted to: JEK 2
3 4 5
ROBUST ESTIMATION OF AVERAGE TWITCH CONTRACTION FORCES OF 6
POPULATIONS OF MOTOR UNITS IN HUMANS 7
8
Francesco Negro* & Claudio Orizio 9
10
Department of Clinical and Experimental Sciences, University of Brescia, 25123 Brescia, 11
Italy 12
13 14
Running title: Robust estimation of motor unit twitch 15
Keywords: motor unit, twitch, iEMG, deconvolution, force 16
Total number of words: 17 18 19 20 21 Corresponding author: 22 * Francesco Negro, PhD 23
Department of Clinical and Experimental Sciences 24
Università degli Studi di Brescia 25 Viale Europa 11 26 25123 Brescia 27 Italy 28 Tel: +39 0303717452 29 Fax: +39 0303717443 30 Email: [email protected] 31 32
ABSTRACT 1
The characteristics of motor unit force twitch profiles provide important information for 2
the understanding of the muscle force generation. The twitch force is commonly estimated 3
with the spike-triggered averaging technique, which, despite the many limitations, has been 4
important for clarifying central issues in force generation. In this study, we propose a new 5
technique for the estimation of the average twitch profile of populations of motor units 6
with uniform contractile properties. The method encompasses a model-based 7
deconvolution of the force signal using the identified discharge times of a population of 8
motor units. The proposed technique was validated using simulations and tested on signals 9
recorded during voluntary activation. The results of the simulations showed that the 10
proposed method provides accurate estimates (relative error <25%) of the main parameters 11
of the average twitch force when the number of identified motor units is between 5% and 12
15% of the total number of active motor units. It is discussed that current detection and 13
decomposition methods of multi-channel surface EMG signals allow decoding this relative 14
sample of the active motor unit pool. However, even when this condition is not met, our 15
results show that the estimates provided by the new method are anyway always superior to 16
those obtained by the spike triggered average approach, especially for high motor unit 17
synchronization levels and when a relatively small number of triggers is available. In 18
conclusion, we present a new method that overcome the main limitations of the spike-19
triggered average for the study of contractile properties of individual motor units. The 20
method provides a new reliable tool for the investigation of the determinants of muscle 21
force. 22
INTRODUCTION 1
The contraction of a muscle is the result of the summation of sequences of twitch 2
forces of the muscle units. The superimposition of all motor unit (MU) twitches is the total 3
force generated by the muscle (Heckman and Enoka, 2004). In general, the identification 4
of the twitch temporal profiles at the motor unit level provides important information on 5
the characteristics of the investigated motor units (Bagust et al., 1973; Burke et al., 1974; 6
Heckman and Enoka, 2004; Macefield et al., 1996; McNulty and Macefield, 2005; Thomas, 7
1995). Unfortunately, due to the fusion and summation of hundreds of motor unit forces, 8
the extraction of the motor unit twitch characteristics is a complex problem. Currently, 9
there are no robust methods for estimating the contractile properties of individual muscle 10
units, therefore our understanding of acute and chronic adaptations of muscular and neural 11
mechanisms of movement is limited (Enoka and Fuglevand, 2001). For example, during 12
sustained contractions, muscle fatigue determines changes in both the discharge rate of the 13
motor neurons (Carpentier et al., 2001; Gandevia, 2001) and the contractile properties of 14
the muscle fibers (Nordstrom and Miles, 1990), although the links between these two 15
effects are debated (Fuglevand, 1996). 16
The only available method for the estimation of the motor unit temporal twitch 17
profiles in vivo during voluntary contractions is the spike-triggered averaging (STA) 18
(Gossen, 2003; Milner-Brown et al., 1973; Thomas, 1995) technique. Under the 19
assumptions of uncorrelated activity of the motor units, the STA performs an average of 20
the force signal triggered by the discharge times of one motor unit, usually identified by 21
decomposition of intramuscular EMG (Farina et al., 2008, 2005; Milner-Brown et al., 22
1973; Roatta et al., 2008). The averaging process increases the signal-to-noise ratio (SNR) 23
for the force generated by the triggered unit with respect to the summation of the forces 1
produced by the other active motor units. One of the main problems in this approach is that 2
the average inter-spike interval of MU during voluntary contraction is smaller than their 3
twitch duration. On this basis, the STA estimation is always biased (Gossen et al., 2003; 4
Negro et al., 2014). This effect alters the STA estimates substantially, especially during the 5
relaxation time (Kossev et al., 1994). Another limitation of the STA for twitch estimation 6
is the need for relatively long signal recordings (usually >2 min) to obtain stable estimates 7
(Nordstrom and Miles, 1990). This impedes the use of STA for assessing changes of twitch 8
force over short time intervals, for example during fast fatigue development. Finally, the 9
synchronization between motor unit spike trains also negatively influences the STA 10
estimates of motor unit twitch forces (Keen, 2004; Kutch et al., 2007). Because of these 11
important limitations, a few alternative methods and models have been proposed to extract 12
the contributions of individual MU to the force profile in human (Andreassen and Bar-On, 13
1983; Kutch et al., 2010; Lim et al., 1995) and animal recordings (Drzymała-Celichowska 14
et al., 2016), but without an extensive validation and with very limited use. 15
In this study, we approach the problem of estimating twitch forces in motor units 16
by deconvolution. To overcome the problem of low SNR for individual motor unit 17
twitches, our approach will aim at the estimation of the average twitch in populations of 18
motor units having similar recruitment thresholds and hence presumably similar force 19
twitches. We extensively validate the method on simulated and experimental signals and 20
prove that its application is feasible in a variety of conditions. The method provides for the 21
first time the possibility of accurately estimate the twitch contractile properties of motor 22
units in voluntary contractions. 23
1
MATERIALS & METHODS 2
Theory 3
The generation of the muscle force signal can be modelled as a spatial and temporal 4
summation of motor unit twitch forces, as: 5
𝑌(𝑡) = ∑𝑁𝑖=1𝑋𝑖(𝑡) ∗ 𝑔𝑖(𝑡) (1)
6
where 𝑋𝑖(𝑡) and 𝑔𝑖(𝑡) are respectively the spike train and the twitch force of the i-th motor 7
unit and N is the total number of active motor units (Negro et al., 2014). In general, it is 8
not possible to identify all motor units that are active during a voluntary contraction, even 9
at very low contraction levels (Farina et al., 2010). However, recent advances in the 10
detection and decomposition of intramuscular (iEMG) and surface EMG (sEMG) allow to 11
the reliable identification of several (>10) concurrently active motor units (Farina et al., 12
2016; Holobar et al., 2010; Nawab et al., 2008; Negro et al., 2016a, 2009; Francesco Negro 13
and Farina, 2011). 14
We can rewrite Eq. (1) as 15
𝑌(𝑡) = ∑𝑀𝑖=1𝑋𝑖(𝑡) ∗ 𝑔𝑖(𝑡) + 𝑊(𝑡) (2)
16
where M<<N is the number of spike trains identified reliably from EMG decomposition 17
and W(t) is the activity of the remaining motor units that can be seen as additive noise. In 18
general, we are interested in the estimation of the twitch force waveforms gi(t). From this
19
equation, we can define a signal-to-noise (SNR) measure as 20
𝑆𝑁𝑅 = 10𝑙𝑜𝑔10(𝑃𝑀
𝑃𝑤) (3)
21
where PM is the power of the force signal generated by the M detected units and Pw the
1
Description of the method 2
In order to solve this underestimated problem, we implemented a time-domain 3
deconvolution technique. The optimization technique estimates a model with a set of 4
parameters θ (the parameters describe the average twitch of the M motor units, see below) 5
in order to solve the least-mean-square (LMS) problem 6 min 𝜃 ‖[∑ 𝑋𝑖(𝑡) ∗ 𝑔𝜃(𝑡) 𝑀−1 𝑖=0 ] − 𝑌̂(𝑡)‖2 2 (4) 7
where M is the number of known motor unit spike trains. In general, the problem 8
of estimation the twitch parameters has an unbiased solution only if the activation of all 9
sources is known and a correct parameterization of the sources is available. However, only 10
in the case of electrically stimulated twitches, the full activation pattern is known. 11
Additionally, the frequency and variability in the discharge timing of individual motor units 12
in physiological conditions does not allow the correct estimation of the twitch waveform, 13
as previously demonstrated (Negro et al., 2014). Finally, the estimation of each individual 14
motor unit twitch waveform is not feasible due to the low SNR (see Results section). For 15
this reason, we focused this study on the estimation of the properties of the average twitch 16
of the motor units identified. Therefore the estimation provided is related to an averaged 17
twitch extracted using the composite spike train (CST) (Castronovo et al., 2015; Farina et 18
al., 2014; Farina and Negro, 2015; Negro et al., 2016b; Francesco Negro and Farina, 2011; 19
Negro and Farina, 2012) of the M identified motor units. This is not a limiting factor since, 20
for low contraction forces, the motor units have similar recruitment threshold and therefore 21
similar parameters. The set of parameters θ in Eq. (4) includes three variables to 22
characterize the average twitch profile and one to provide a better estimation in case of 23
underdetermined systems. The twitch response was modeled using a modified version of 1
the impulse response described by Fuglevand et al. (Fuglevand et al., 1993) that has been 2
proposed by Roatta and Farina (Roatta and Farina, 2011) in a previous study: 3
1 1 1 2 2 1 1 1 2 2 1 1)
(
i i T T T t i i i i T t i i iT
t
T
t
e
T
T
T
t
P
e
T
t
P
t
g
i i i i 4 (5) 5 where P , i T and i1 2 3 5 iT are the peak amplitude, the rising time and the half 6
relaxation time (HR) for the motor unit i. Figure 1 shows two examples of twitch 7
waveforms described by this model. 8
FIGURE 1 HERE 9
An additional parameter was added for the estimation of the bias of the unidentified 10
motor units. This model was used since it allowed having a direct measure of the three 11
parameters independently. The optimization problem of Eq. (4) was performed using an 12
iterative algorithm for time-domain deconvolution (trust-region-reflective, (Absil et al., 13
2007)). The Levenberg–Marquardt algorithm (Levenberg, 1944) provided similar results. 14
In order to limit the number of iterations, upper and lower ranges for each parameter should 15
be set. In the simulations, the upper and lower limits for P, T1, T2 and the Bias were 16
respectively: 0.1-100 AU, 30-120 ms, 30-120 ms, 0-Max_Force. For the experimental 17
signals, they were: 0 Nm – 0.03 Nm, 30-120 ms, 30-120 ms and 0-Max_Force. The starting 1
point was chosen as a random variable uniformly distributed between the range values. 2
Simulations 3
The simulations performed on this study were based on a model of integrate-and-4
fire motor neurons with discharge characteristics similar to a previous model by Fuglevand 5
et al. (Fuglevand et al., 1993). Each motor neuron received a synaptic input current that 6
was a linear combination of shared and independent Gaussian stochastic processes (0-50 7
Hz). The shared synaptic input simulates the summation of all inputs that project 8
commonly to the motor neuron pool (Farina and Negro, 2015). On the other hand, the 9
independent noise resembles the fluctuation of the membrane potential generated by the 10
summation of synaptic inputs that are individual for each motor neuron. The motor neuron 11
pool include a number of motor neurons equal to 300, similar to histological findings in 12
the abductor digiti minimi (ADM) muscle (Santo Neto et al., 1985), which was the muscle 13
used for the experimental analyses (see “experimental recordings” section below). The 14
model described the motor units with an exponential variation of the recruitment threshold, 15
peak-to-peak and twitch forces. The range of discharge rate was set between 8 and 35 pps. 16
The level of force at which all the motor units were recruited corresponded to 50 % (Burke 17
et al., 1974; Milner-Brown et al., 1973) of maximal synaptic input. The rising time of the 18
smallest motor unit was set to 90 ms. The range of twitch tensions was set to 100 and the 19
range of contraction times was set to 3 (Fuglevand et al., 1993). 20
The proposed technique was applied on simulated forces corresponding to 5% of synaptic 21
input (equivalent to approximately 3% MVC). This level was chosen to be similar to the 22
typical experimentally recorded level of force used for the estimation of the twitch 1
properties with the STA technique (Roatta et al., 2008). 2
To study the influence of motor unit synchronization on the twitch estimation, we 3
performed simulations with a moderate level of synchronization among the spike trains. 4
The synchronization was imposed injecting correlated synaptic noise into the motor 5
neurons (Negro et al., 2016b; F. Negro and Farina, 2011; Negro and Farina, 2012). Motor 6
unit synchronization was quantified with the common input strength (CIS) index as the 7
frequency of extra synchronous discharges (Nordstrom et al., 1992) between all pairs of 8
active motor units. The proportion of shared synaptic noise was selected in order to obtain 9
physiological levels of synchronization (Keen et al., 2012). 10
Simulation analysis 11
For assessing the performance of the proposed technique, the composite spike train of 5, 12
15, 25, 50, 75 and 100 % of the active motor units was estimated by the proposed algorithm. 13
The duration of the analyzed segment was set to 5, 10 and 30 s. For each case, 100 14
simulations were performed with a random selection (normal distribution) of the motor 15
units in each simulation. The results were compared with the parameters extracted from 16
the average twitch force of all motor units selected for the calculation. For each simulation, 17
the STA twitch force was extracted for the motor unit with the lowest discharge rate (~ 8 18
pps) and compared with the estimated parameters calculated by the algorithm. The duration 19
of the segment used for the calculation of the twitch parameters using the STA technique 20
was 120 s, much longer than the interval used for the deconvolution methods. The STA 21
twitch was measured 50 ms prior to and 150 ms after the reference action potential. The 22
intervals preceding and succeeding the reference action potential were required to have 1
durations of ≥110 ms (Nordstrom et al., 1989; Taylor et al., 2002). 2
Experiments 3
Subjects. 5 healthy men participated in the main experiment (mean ± SD, age: 26.1 4
± 2.5 yrs; range, 25-31 yrs). 5
The experiments were conducted in accordance with the Declaration of Helsinki 6
and approved by the ethics committee (approval number N-20090019 and 01/10/12). All 7
participants self reported to be right handed and signed a written informed consent form 8
before inclusion. 9
Recordings. Individual motor unit action potentials were recorded from the 10
abductor digiti minimi muscle with Teflon-coated stainlesssteel wires (diameter 0.1 mm; 11
A-M Systems, Carlsborg, WA) inserted into the muscle with 25-gauge hypodermic 12
needles. Each wire was cut to expose the cross section of the tip without insulation. In order 13
to increase the number of identified motor units, two pairs of wires were placed 14
approximately 1 cm apart in the transverse direction in the proximalportion of the muscle. 15
The needles were inserted and removed after the insertion, leaving the wires inside the 16
muscle. The two bipolar intramuscular EMG signals were amplified (Counterpoint EMG, 17
Dantec Medical, Skovlunde, Denmark), band-pass filtered (1000 Hz to 5 kHz), and 18
sampledat 10 kHz. 19
Procedures. The subject was seated on an adjustable chair with the right arm 20
extended in a force brace (Aalborg University). The fifth finger was fixed in the isometric 21
device for the measurement of finger-abduction forces. The forearm and the four digits 22
were secured with Velcro straps. The force produced by the fifth finger was measured using 23
two force transducers (Interface, Arizona USA), one in the transverse plane (abduction 1
force) and the other in the sagittal plane (flexion force). The force signal was sampled at 2
10 kHz. Visual feedback on the finger abduction force was provided on an oscilloscope. 3
The subjects performed three maximal voluntarycontractions (MVCs) of finger 4
abduction with a rest of 3 min in between. The force generated during the maximal 5
contractions was considered as the reference MVC. Afterward, the subject performed one 6
contraction of 60–s duration at 5% MVC with visual feedback. During each contraction, 7
the flexion force was also monitored and contractions with not significant flexion force 8
were repeated. 9
Experimental signal analysis. 10
Individual motor units were identified from the intramuscular EMG signals 11
recorded from the two locations in the muscle by the use of a decomposition algorithm 12
(McGill et al., 2005). Each motor unit spike train was manually edited by an experienced 13
operator and any unusually long (>250 ms) or short (<20 ms) inter-spike intervals (ISIs) 14
were manually inspected for checking potential discrimination errors. From the results of 15
the decomposition, spike trains of individual motor units were calculated with a sampling 16
rate of 1000 Hz. The CST (composite spike train) was defined as the sum of the individual 17
spike trains, as for the simulated signals. The calculation of the STA twitch was performed, 18
for each contraction, on the motor units with the lowest discharge rate using a duration of 19
60s. 20
Statistical analysis. All variables were tested for normality prior statistical analysis. 21
The experimental results are reported as mean ± SD. Comparison of the estimates 22
performed with the proposed algorithm, the simulated values, and the STA technique were 23
analyzed using ANOVA. Statistical analyses were performed using Matlab® (Mathworks, 1
Natick, Massachusetts, United States) and statistical significance was set at P < 0.05. 2
RESULTS 3
Simulations 4
In general, the greater the number of motor units, the higher was the probability of 5
convergence of the algorithm. This was due to the increase in the SNR defined in Eq. 3, as 6 shown in Figure 2. 7 8 FIGURE 2 HERE 9 10
The proposed method was tested on simulated segments of 5, 10 and 30 s duration. At the 11
end of the iterations, if anyone of the parameters had the value set for upper or lower bound, 12
it was assumed that the algorithm did not converge. Figure 3 shows the percent of times in 13
which the algorithm converged as a function of the number M of motor units used in the 14 estimation. 15 16 FIGURE 3 HERE 17 18
The deconvolution method outperformed standard STA estimation in simulated 19
contractions. Figure 4 shows the comparison between the simulated (correct) values for P, 20
T and HR, the estimated ones using the proposed method and those obtained using the 21
traditional STA technique. The values for all variables estimated with the proposed method 22
were not statistically different (P>0.05) from the simulated ones when at least 15 % of the 23
motor units were used for the estimate (18 motor units in these simulations). Conversely, 1
the estimates obtained with the STA were biased in all cases. 2
3
FIGURE 4 HERE 4
5
The error in the estimation was always lower with the proposed algorithm compared 6
with standard STA estimation. Figure 5 shows the relative error in the estimation for the 7
proposed algorithm and the STA technique compared with the simulated one. In this case, 8
all three variables were statistically different (P<0.05) from the ones estimated with the 9
STA technique when more that 15 % of available motor units were included in the analysis. 10
In this case, the STA technique had an error approximately double than the one provided 11
by the proposed method. 12
13
FIGURE 5 HERE 14
15
If the assumption of uncorrelated discharge timings is violated, the estimation of 16
STA technique is always biased. Figure 6 shows the influence of the different levels of 17
synchronization on the estimation performed with the proposed algorithm and the STA 18
technique. The total amount of motor units used was fixed to 15 % and the duration of the 19
segment was set to 30 s. The relative error of all parameters was found to be considerably 20
lower than the estimation performed with the STA technique. The parameter that was most 21
affected by the synchronization level was the peak amplitude. 22
1 FIGURE 6 HERE 2 3 Experimental results 4
The experimental results confirm the conclusions derived from the simulated 5
signals. Figure 7 shows the estimated twitch using the STA and the proposed technique in 6
three representative subjects. Ten segments of 5 s and 10, 12, 19 motor unit spike trains 7
were used respectively. The STA estimations were calculated using motor units with an 8
averaged inter-spike interval higher than 90 ms. 9
10
FIGURE 7 HERE 11
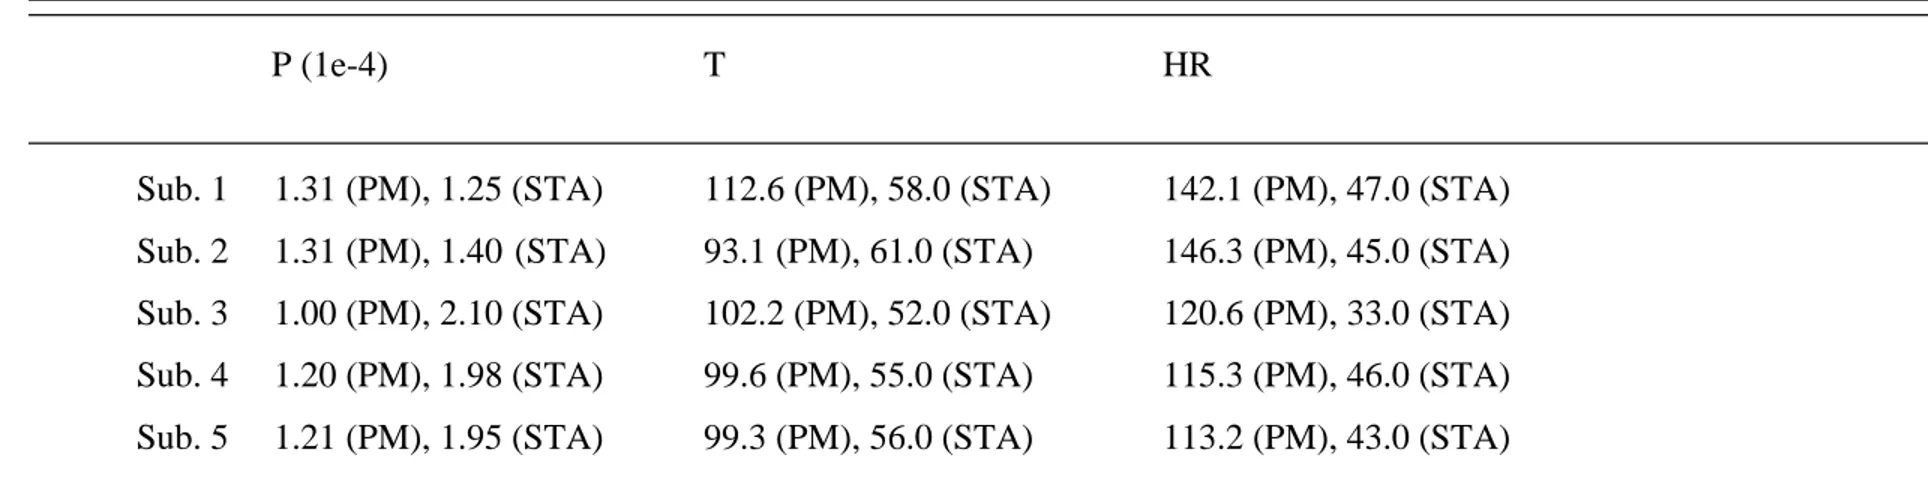
The direct comparison of the twitch estimated with the proposed and STA 12
techniques is shown in Figure 7A in one representative subject. The results for all subjects 13
are reported individually in Table 1 and averaged in Figure 7B. 14 15 FIGURE 8 HERE 16 17 DISCUSSION 18
In this study, we proposed a new method for the estimation of the twitch forces of 19
groups of motor units in vivo during voluntary isometric contractions. The STA technique 20
has been proposed several decades ago for estimating the twitch force of individual motor 21
units (Goldberg and Derfler, 1977; Stein et al., 1972), and it is still the only available 22
method to estimate the contractile properties of the muscle units (Enoka and Duchateau, 1
2016) from voluntary contractions. Several studies have underlined the limitations of this 2
technique that are mostly related with the fusion of the twitch forces (Negro et al., 2014; C 3
K Thomas et al., 1990) and motor unit synchronization (Taylor et al., 2002). Both effects 4
produce a bias in the estimation of the peak force, time to peak and, especially, half 5
relaxation time of the motor units (Gossen et al., 2003; Nordstrom et al., 1989; Thomas, 6
1995). These limitations are so severe that the results of the STA approach are often 7
considered qualitative rather than quantitative. 8
The convolution between the neural drive to the muscle and an average force twitch profile 9
can be seen, in the frequency domain, as a sampling process. For example, a periodic spike 10
train generates, in the Fourier domain, a line spectrum with equally spaced lines. Therefore, 11
when the discharge rate is very high, the only frequency line with non-negligible amplitude 12
may be the DC. In this case, the trains of twitches do only contain the information on the 13
average force level. Practically, this means that the fusion of twitches is complete to 14
generate a constant force value, from which there is not sufficient information to extract 15
the individual components. However, if some ISI variability is introduced, an additional 16
component (continuous spectrum) will be present and this component has values for any 17
frequency since it is not a line spectrum (Dideriksen et al., 2012). Therefore, even in the 18
case of a spike train with a relatively high discharge rates and a slow twitches, the 19
reconstruction is still possible with a proper amount of variability (Negro et al., 2014). 20
During voluntary contractions, the minimal discharge rate of the motor units ranges from 21
~7 to ~20 pps (first dorsal interosseous) (Moritz, 2005) with a CoV of 15-20 %. In general, 22
(Negro et al., 2014). However, the concurrent activation of many motor units would 1
improve the estimation since the continuous spectra will linearly sum. In this case, the 2
result will be the average twitch of the decoded motor units. For these reasons, the method 3
that we propose focuses on the estimation of the average twitch of a population of motor 4
units, instead of the single motor unit twitch estimation. The underlying assumption is that 5
the population of motor units selected is sufficiently homogeneous so that the differences 6
between the individual twitches and the average twitch over this sub-population are 7
negligible (at least with respect to the estimation errors). This practically implies to 8
consider an average twitch of at least 10-15 motor units (see simulation results). Although 9
the estimation of the average twitch in small populations of motor units may seem a very 10
important drawback with respect to the scope of the STA approach to estimate the twitch 11
properties of individual motor units, the estimated twitch with the current approach is much 12
more representative of the individual twitches than any estimates provided by the STA 13
method. Indeed, the estimation errors in the STA approach are so large (as also evidenced 14
in previous literature, e.g. (C. K. Thomas et al., 1990; Thomas, 1995) that the result is only 15
a crude approximation of the twitch properties of the active units (Figure 7 and 8). 16
An additional reason for the population estimation has to be found in the low signal-to-17
noise ratio of the force produced by the single motor unit when other motor units are active. 18
Even at relatively low force levels, tens of motor units are concurrently active, resulting in 19
a SNR for the single motor unit force of ~ -25 dB (Figure 2). There is no denoising 20
technique that can work in these conditions unless the observation window is extremely 21
long. For example, the STA technique needs at least a thousand triggers to have a correct 22
estimation of the single motor unit twitch (Roatta et al., 2008). Assuming a low discharge 23
rate, required by the STA, this implies hundreds of seconds of recording with no changes 1
in the contractile properties of the motor unit, a condition presumably not met in practice. 2
Again, the high demands of the STA technique of estimating individual motor unit twitch 3
properties implies strong limitations in applicability, e.g. too long estimation intervals. The 4
proposed method, on the other hand, has good convergence properties as long as a 5
relatively small population of motor units is used for the calculation, even for short 6
segments of signals (Figure 3). In the simulations, the proposed algorithm demonstrated 7
robustness in the estimation of the commonly used parameters P, T, and HR, even for 8
intervals of 5-s duration (Figure 4). 9
In comparison with the STA technique, the average error of the estimations provided by 10
the proposed method was lower in most conditions (Figure 5). For example, in the case 11
where the 15 % of the active motor units was used, the average error was approximately 12
half of the one given by the STA technique for the P and T parameters. For this simulated 13
contraction level, the average firing rate of the motor unit was 9.1 pps. However, if the 14
discharge rates are forced to higher values (~ 30 pps) the estimation dramatically improves 15
(0.5 % of error for 100 % MUs). The reason is that the continuous spectrum of the motor 16
unit spike train is weighted by the average discharge rate frequency, therefore higher values 17
implies better estimation of the twitch waveforms in the case of the same ISI variability. 18
The presence of synchronization introduces a bias in the estimation of the different 19
parameters for both techniques. However, the proposed method maintained a lower error 20
for HR compared with the classic method (Figure 6). 21
The experimental results calculated during voluntary contractions provided 22
(Figure 7). In these conditions, it is not possible to know the real values, but the comparison 1
with the simulation results gives us confidence that the estimations with the proposed 2
method are reasonable (Figure 8). 3
The main requirement of the method described in this study is the need of decoding the 4
activity of a relatively large number of motor units (10-15). However, recently, many 5
techniques have been proposed to increase the number of motor unit spike trains that is 6
possible to extract from iEMG (Farina et al., 2016; Florestal et al., 2009; Ge et al., 2011, 7
2008; Marateb et al., 2011; McGill et al., 2005; Muceli et al., 2015; Negro et al., 2016a, 8
2009) and sEMG (Castronovo et al., 2015; Holobar et al., 2009; Negro et al., 2016a, 2009; 9
Yavuz et al., 2015) during voluntary contractions. Moreover, the combination of the 10
proposed technique with high-density sEMG recordings can provide the possibility to track 11
the twitch properties of the same motor units across several recording sessions (E. 12
Martinez-Valdes et al., 2017; Eduardo Martinez-Valdes et al., 2017) and/or compare them 13
with other peripheral characteristics (Del Vecchio et al., 2017a, 2017b). Finally, the 14
proposed methodology can be usefully applied together with the maximal twitch scan 15
suggested by Orizio et al (Orizio et al., 2016) to evaluate the prevalence of fast or slow 16
contribution to the mechanical output of a specific muscle during stimulated contraction 17
and the interpolated twitch technique (Maffiuletti et al., 2016; Zarkou et al., 2017). 18
In conclusion, we showed that the proposed method could provide reliable average motor 19
unit twitch estimations of the muscle in vivo during voluntary isometric contractions at 20
moderate force levels. The combination of recent multi-unit EMG recordings and the 21
optimization technique described in the present study offer the possibility to quantify motor 22
unit twitch parameters reliably, even in relatively short segments. Therefore, the proposed 1
method opens a new opportunity for neuromuscular assessments in clinical applications. 2
ACKNOWLEDGEMENTS 3
Francesco Negro has received funding from the European Union’s Horizon 2020 research 4
and innovation programme under the Marie Skłodowska-Curie grant agreement No 702491 5
(NeuralCon). 6
7 8
REFERENCES 1
Absil, P.A., Baker, C.G., Gallivan, K.A., 2007. Trust-region methods on Riemannian 2
manifolds, Foundations of Computational Mathematics. doi:10.1007/s10208-005-3
0179-9 4
Andreassen, S., Bar-On, E., 1983. Estimation of Motor Unit Twitches. IEEE Trans. 5
Biomed. Eng. BME-30. doi:10.1109/TBME.1983.325189 6
Bagust, J., Knott, S., Lewis, D.M., Luck, J.C., Westerman, R.A., 1973. Isometric 7
contractions of motor units in a fast twitch muscle of the cat. J. Physiol. 231, 87–104. 8
doi:10.1113/jphysiol.1973.sp010221 9
Burke, D., Skuse, N.F., Lethlean, A.K., 1974. Isometric contraction of the abductor digiti 10
minimi muscle in man. J. Neurol. Neurosurg. Psychiatry 37, 825–34. 11
doi:10.1136/JNNP.37.7.825 12
Carpentier, A., Duchateau, J., Hainaut, K., 2001. Motor unit behaviour and contractile 13
changes during fatigue in the human first dorsal interosseus. J. Physiol. 534, 903–912. 14
doi:10.1111/j.1469-7793.2001.00903.x 15
Castronovo, A.M., Negro, F., Conforto, S., Farina, D., 2015. the Proportion of Common 16
Synaptic Input To Motor Neurons Increases With an Increase in Net Excitatory Input. 17
J. Appl. Physiol. 119, jap.00255.2015. doi:10.1152/japplphysiol.00255.2015 18
Del Vecchio, A., Negro, F., Felici, F., Farina, D., 2017a. Associations between Motor Unit 19
Action Potential Parameters and Surface EMG Features. J. Appl. Physiol. 20
jap.00482.2017. doi:10.1152/japplphysiol.00482.2017 21
Del Vecchio, A., Negro, F., Felici, F., Farina, D., 2017b. Distribution of muscle fiber 22
conduction velocity for representative samples of motor units in the full recruitment 1
range of the tibialis anterior muscle. Acta Physiol. doi:10.1111/apha.12930 2
Dideriksen, J.L., Negro, F., Enoka, R.M., Farina, D., 2012. Motor unit recruitment 3
strategies and muscle properties determine the influence of synaptic noise on force 4
steadiness. J. Neurophysiol. 107, 3357–3369. doi:10.1152/jn.00938.2011 5
Drzymała-Celichowska, H., Kaczmarek, P., Krutki, P., Celichowski, J., 2016. Summation 6
of slow motor unit forces at constant and variable interpulse intervals in rat soleus 7
muscle. J. Electromyogr. Kinesiol. 30, 1–8. doi:10.1016/j.jelekin.2016.05.001 8
Enoka, R.M., Duchateau, J., 2016. Chapter 1 Physiology of Muscle Activation and Force 9
Generation. Surf. Electromyogr. Physiol. 10
Enoka, R.M., Fuglevand, A.J., 2001. Motor unit physiology: Some unresolved issues. 11
Muscle and Nerve 24, 4–17. doi:10.1002/1097-4598(200101)24:1<4::AID-12
MUS13>3.0.CO;2-F 13
Farina, D., Arendt-Nielsen, L., Graven-Nielsen, T., 2005. Spike-triggered average torque 14
and muscle fiber conduction velocity of low-threshold motor units following 15
submaximal endurance contractions. J. Appl. Physiol. 98, 1495–1502. 16
doi:10.1152/japplphysiol.01127.2004 17
Farina, D., Arendt-Nielsen, L., Roatta, S., Graven-Nielsen, T., 2008. The pain-induced 18
decrease in low-threshold motor unit discharge rate is not associated with the amount 19
of increase in spike-triggered average torque. Clin. Neurophysiol. 119, 43–51. 20
doi:10.1016/j.clinph.2007.10.003 21
Farina, D., Holobar, A., Merletti, R., Enoka, R.M., 2010. Decoding the neural drive to 22
muscles from the surface electromyogram. Clin. Neurophysiol. 121, 1616–1623. 1
doi:10.1016/j.clinph.2009.10.040 2
Farina, D., Negro, F., 2015. Common synaptic input to motor neurons, motor unit 3
synchronization, and force control. Exerc. Sport Sci. Rev. 43, 23–33. 4
doi:10.1249/JES.0000000000000032 5
Farina, D., Negro, F., Dideriksen, J.L., 2014. The effective neural drive to muscles is the 6
common synaptic input to motor neurons. J. Physiol. 592, 3427–3441. 7
doi:10.1113/jphysiol.2014.273581 8
Farina, D., Negro, F., Muceli, S., Enoka, R.M., 2016. Principles of Motor Unit Physiology 9
Evolve With Advances in Technology. Physiology 31, 83–94. 10
doi:10.1152/physiol.00040.2015 11
Florestal, J.R., Mathieu, P.A., McGill, K.C., 2009. Automatic decomposition of 12
multichannel intramuscular EMG signals. J. Electromyogr. Kinesiol. 19, 1–9. 13
doi:10.1016/j.jelekin.2007.04.001 14
Fuglevand, A.J., 1996. Neural Aspects of Fatigue. Neurosci. 2, 203–206. 15
doi:10.1177/107385849600200407 16
Fuglevand, a J., Winter, D. a, Patla, a E., 1993. Models of recruitment and rate coding 17
organization in motor-unit pools. J. Neurophysiol. 70, 2470–2488. 18
Gandevia, S.C., 2001. Spinal and supraspinal factors in human muscle fatigue. Physiol. 19
Rev. 81, 1725–89. doi:citeulike-article-id:1572911 20
Ge, D., Le Carpentier, E., Farina, D., Idier, J., 2008. Unsupervised Bayesian EMG 21
decomposition algorithm using tabu search. IEEE - Biomed. Commun. Technol. 57, 22
1–5. doi:10.1109/ISABEL.2008.4712579 1
Ge, D., Le Carpentier, E., Idier, J., Farina, D., 2011. Spike sorting by stochastic simulation. 2
IEEE Trans. Neural Syst. Rehabil. Eng. 19, 249–259. 3
doi:10.1109/TNSRE.2011.2112780 4
Goldberg, L.J., Derfler, B., 1977. Relationship among recruitment order, spike amplitude, 5
and twitch tension of single motor units in human masseter muscle. J. Neurophysiol. 6
40, 879–890. 7
Gossen, E.R., 2003. The time course of the motoneurone afterhyperpolarization is related 8
to motor unit twitch speed in human skeletal muscle. J. Physiol. 552, 657–664. 9
doi:10.1113/jphysiol.2003.048132 10
Gossen, E.R., Ivanova, T.D., Garland, S.J., 2003. Factors affecting the stability of the 11
spike-triggered averaged force in the human first dorsal interosseus muscle. J. 12
Neurosci. Methods 126, 155–164. doi:10.1016/S0165-0270(03)00077-3 13
Heckman, C.J., Enoka, R.M., 2004. Physiology of the motor neuron and the motor unit, 14
Handbook of Clinical Neurophysiology. Elsevier B.V. doi:10.1016/S1567-15
4231(04)04006-7 16
Holobar, A., Farina, D., Gazzoni, M., Merletti, R., Zazula, D., 2009. Estimating motor unit 17
discharge patterns from high-density surface electromyogram. Clin. Neurophysiol. 18
120, 551–562. doi:10.1016/j.clinph.2008.10.160 19
Holobar, A., Minetto, M.A., Botter, A., Negro, F., Farina, D., 2010. Experimental analysis 20
of accuracy in the identification of motor unit spike trains from high-density surface 21
EMG. IEEE Trans. Neural Syst. Rehabil. Eng. 18, 221–229. 22
doi:10.1109/TNSRE.2010.2041593 1
Keen, D.A., 2004. Distribution of Motor Unit Force in Human Extensor Digitorum 2
Assessed By Spike-Triggered Averaging and Intraneural Microstimulation. J. 3
Neurophysiol. 91, 2515–2523. doi:10.1152/jn.01178.2003 4
Keen, D.A., Chou, L.-W., Nordstrom, M.A., Fuglevand, A.J., 2012. Short-term synchrony 5
in diverse motor nuclei presumed to receive different extents of direct cortical input. 6
J. Neurophysiol. 108, 3264–3275. doi:10.1152/jn.01154.2011 7
Kossev, A., Elek, J.M., Wohlfarth, K., Schubert, M., Dengler, R., Wolf, W., 1994. 8
Assessment of human motor unit twitches--a comparison of spike- triggered 9
averaging and intramuscular microstimulation. Electroencephalogr. Clin. 10
Neurophysiol. 93, 100–105. 11
Kutch, J.J., Kuo, A.D., Rymer, W.Z., 2010. Extraction of individual muscle mechanical 12
action from endpoint force. J. Neurophysiol. 103, 3535–46. 13
doi:10.1152/jn.00956.2009 14
Kutch, J.J., Suresh, N.L., Bloch, A.M., Rymer, W.Z., 2007. Analysis of the effects of firing 15
rate and synchronization on spike-triggered averaging of multidirectional motor unit 16
torque. J. Comput. Neurosci. 22, 347–361. doi:10.1007/s10827-007-0023-0 17
Levenberg, K., 1944. A method for the solution of certain non-linear problems in least 18
squares. Q. Appl. Math. 19
Lim, K.Y., Thomas, C.K., Rymer, W.Z., 1995. Computational methods for improving 20
estimates of motor unit twitch contractions properties. Muscle Nerve 18, 165–174. 21
Macefield, V.G., Fuglevand, a J., Bigland-Ritchie, B., 1996. Contractile properties of 22
single motor units in human toe extensors assessed by intraneural motor axon 1
stimulation. J Neurophysiol 75, 2509–2519. 2
Maffiuletti, N.A., Barbero, M., Cescon, C., Clijsen, R., Beretta-Piccoli, M., Schneebeli, A., 3
Preiss, S., Togninalli, D., 2016. Validity of the twitch interpolation technique for the 4
assessment of quadriceps neuromuscular asymmetries. J. Electromyogr. Kinesiol. 28, 5
31–36. doi:10.1016/j.jelekin.2016.03.002 6
Marateb, H.R., Muceli, S., McGill, K.C., Merletti, R., Farina, D., 2011. Robust 7
decomposition of single-channel intramuscular EMG signals at low force levels. J. 8
Neural Eng. 8, 66015. doi:10.1088/1741-2560/8/6/066015 9
Martinez-Valdes, E., Falla, D., Negro, F., Mayer, F., Farina, D., 2017. Differential Motor 10
Unit Changes after Endurance or High-Intensity Interval Training. Med. Sci. Sports 11
Exerc. 49, 1126–1136. doi:10.1249/MSS.0000000000001209 12
Martinez-Valdes, E., Negro, F., Laine, C.M., Falla, D., Mayer, F., Farina, D., 2017. 13
Tracking motor units longitudinally across experimental sessions with high-density 14
surface electromyography. J. Physiol. 595, 1479–1496. doi:10.1113/JP273662 15
McGill, K.C., Lateva, Z.C., Marateb, H.R., 2005. EMGLAB: An interactive EMG 16
decomposition program. J. Neurosci. Methods 149, 121–133. 17
doi:10.1016/j.jneumeth.2005.05.015 18
McNulty, P.A., Macefield, V.G., 2005. Intraneural microstimulation of motor axons in the 19
study of human single motor units. Muscle and Nerve 32, 119–139. 20
doi:10.1002/mus.20324 21
Milner-Brown, H.S., Stein, R.B., Yemm, R., 1973. The contractile properties of human 22
motor units during voluntary isometric contractions. J. Physiol. 228, 285–306. 1
doi:10.1113/jphysiol.1973.sp010087 2
Moritz, C.T., 2005. Discharge Rate Variability Influences the Variation in Force 3
Fluctuations Across the Working Range of a Hand Muscle. J. Neurophysiol. 93, 4
2449–2459. doi:10.1152/jn.01122.2004 5
Muceli, S., Poppendieck, W., Negro, F., Yoshida, K., Hoffmann, K.P., Butler, J.E., 6
Gandevia, S.C., Farina, D., 2015. Accurate and representative decoding of the neural 7
drive to muscles in humans with multi-channel intramuscular thin-film electrodes. J. 8
Physiol. 593, 3789–3804. doi:10.1113/JP270902 9
Nawab, S.H., Wotiz, R.P., De Luca, C.J., 2008. Decomposition of indwelling EMG signals. 10
J. Appl. Physiol. 105, 700–10. doi:10.1152/japplphysiol.00170.2007 11
Negro, F., Farina, D., 2012. Factors Influencing the Estimates of Correlation between 12
Motor Unit Activities in Humans. PLoS One 7, 44894. 13
doi:10.1371/journal.pone.0044894 14
Negro, F., Farina, D., 2011. Linear transmission of cortical oscillations to the neural drive 15
to muscles is mediated by common projections to populations of motoneurons in 16
humans. J. Physiol. 589, 629–637. doi:10.1113/jphysiol.2010.202473 17
Negro, F., Farina, D., 2011. Decorrelation of cortical inputs and motoneuron output. J. 18
Neurophysiol. 106, 2688–2697. doi:10.1152/jn.00336.2011 19
Negro, F., Holobar, A., Farina, D., 2009. Fluctuations in isometric muscle force can be 20
described by one linear projection of low-frequency components of motor unit 21
discharge rates. J. Physiol. 587, 5925–5938. doi:10.1113/jphysiol.2009.178509 22
Negro, F., Muceli, S., Castronovo, A.M., Holobar, A., Farina, D., 2016a. Multi-channel 1
intramuscular and surface EMG decomposition by convolutive blind source 2
separation. J. Neural Eng. 13, 26027. doi:10.1088/1741-2560/13/2/026027 3
Negro, F., Yavuz, U.Ş., Farina, D., 2016b. The human motor neuron pools receive a 4
dominant slow-varying common synaptic input. J. Physiol. 594, 5491–5505. 5
doi:10.1113/JP271748 6
Negro, F., Yavuz, U.Ş., Farina, D., 2014. Limitations of the spike-triggered averaging for 7
estimating motor unit twitch force: A theoretical analysis. PLoS One 9, e101614. 8
doi:10.1371/journal.pone.0092390 9
Nordstrom, M.A., Fuglevand, A.J., Enoka, R.M., 1992. Estimating the strength of common 10
input to human motoneurons from the cross-correlogram. J. Physiol. 453, 547–574. 11
doi:10.1113/jphysiol.1992.sp019244 12
Nordstrom, M.A., Miles, T.S., Veale, J.L., 1989. Effect of motor unit firing pattern on 13
twitches obtained by spike???triggered averaging. Muscle Nerve 12, 556–567. 14
doi:10.1002/mus.880120706 15
Nordstrom, M. a, Miles, T.S., 1990. Fatigue of single motor units in human masseter. J. 16
Appl. Physiol. 68, 26–34. 17
Orizio, C., Cogliati, M., Bissolotti, L., Diemont, B., Gobbo, M., Celichowski, J., 2016. The 18
age related slow and fast contributions to the overall changes in tibialis anterior 19
contractile features disclosed by maximal single twitch scan. Arch. Gerontol. Geriatr. 20
66, 1–6. doi:10.1016/j.archger.2016.05.003 21
Roatta, S., Arendt-Nielsen, L., Farina, D., 2008. Sympathetic-induced changes in discharge 22
rate and spike-triggered average twitch torque of low-threshold motor units in 1
humans. J. Physiol. 586, 5561–5574. doi:10.1113/jphysiol.2008.160770 2
Roatta, S., Farina, D., 2011. Sympathetic activation by the cold pressor test does not 3
increase the muscle force generation capacity. J. Appl. Physiol. 110, 1526–1533. 4
doi:10.1152/japplphysiol.00039.2011 5
Santo Neto, H., de Carvalho, V., Penteado, C., 1985. Motor units of the human abductor 6
digiti minimi. Arch Ital Anat Embriol. 7
Stein, R.B., French, A.S., Mannard, A., Yemm, R., 1972. New methods for analysing 8
motor function in man and animals. Brain Res. 40, 187–192. doi:10.1016/0006-9
8993(72)90126-6 10
Taylor, A.M., Steege, J.W., Enoka, R.M., 2002. Motor-unit synchronization alters spike-11
triggered average force in simulated contractions. J. Neurophysiol. 88, 265–276. 12
Thomas, C.K., 1995. Human motor units studied by spike-triggered averaging and 13
intraneural motor axon stimulation. Adv. Exp. Med. Biol. 384, 147–160. 14
Thomas, C.K., Bigland-Ritchie, B., Westling, G., Johansson, R.S., 1990. A comparison of 15
human thenar motor-unit properties studied by intraneural motor-axon stimulation 16
and spike-triggered averaging. J. Neurophysiol. 64, 1347–51. 17
Thomas, C.K., Johansson, R.S., Westling, G., Bigland-Ritchie, B., 1990. Twitch properties 18
of human thenar motor units measured in response to intraneural motor-axon 19
stimulation. J. Neurophysiol. 64, 1339–1346. 20
Yavuz, U.Ş., Negro, F., Sebik, O., Holobar, A., Frömmel, C., Türker, K.S., Farina, D., 21
2015. Estimating reflex responses in large populations of motor units by 22
decomposition of the high-density surface electromyogram. J. Physiol. 593, 4305– 1
4318. doi:10.1113/JP270635 2
Zarkou, A., Stackhouse, S., Binder-Macleod, S.A., Lee, S.C.K., 2017. Comparison of 3
techniques to determine human skeletal muscle voluntary activation. J. Electromyogr. 4 Kinesiol. 36, 8–15. doi:10.1016/j.jelekin.2017.05.011 5 6 7 8 9 10
FIGURE CAPTIONS 1
Figure 1. Twitch model used for validating the proposed technique. 2
3
Figure 2. Signal-to-noise ratio for different percentages of motor units (the 0 % value shows 4
the SNR calculated for one motor unit only). 5
6
Figure 3. Convergence rate for the algorithm applied to simulated contractions of 5 (dark 7
blue), 10 (blue) and 30 s (light blue) duration. 8
9
Figure 4. P, T and HR for the simulated motor units when 5, 15 etc. % of the active motor 10
units was used in the calculation. The values are reported for the average of the simulated 11
twitch (red), estimated twitch with 5 (dark blue), 10 (blue), 30 s (light blue) segments and 12
STA technique (black). 13
14
Figure 5. Percent of error estimated for the variables P, T and HR in simulated conditions. 15
Colors represent the variables extracted as described before. 16
17
Figure 6. Influence of synchronization on the estimation of the twitch force provided by 18
the proposed algorithm. The estimated parameters using a segment of 30 s and 15 % of the 19
active motor units (dark blue) and the estimated values using STA technique (light blue). 20
21
Figure 7. Estimation of twitch parameters using the STA and the proposed technique during 22
sustained contractions at 5 % MVC in three representative subjects. Upper panels show the 23
recorded (black) and estimated force (blue) signals. Middle panels show the twitches 24
estimated with the proposed technique in several segments of 5 s duration and the averaged 25
twitch (blue). Bottom panels show the STA estimations of the motor units with averaged 26
inter-spike interval higher than 90 ms. 27
28
Figure 8. Comparison of the STA and the proposed technique during sustained contractions 29
at 5 % MVC. A. Twitch estimations calculated using the proposed method (blue), average 30
value (red) and the STA twitch estimation (black) for one representative subject. B. 1
Averaged values of P, T, and HR for all subjects. 2 3 4 5 6 7 8 9 10 11 12 13 14 15
TABLE 1. Parameters estimated for the five subjects during voluntary contractions.
P (1e-4) T HR
Sub. 1 1.31 (PM), 1.25 (STA) 112.6 (PM), 58.0 (STA) 142.1 (PM), 47.0 (STA) Sub. 2 1.31 (PM), 1.40 (STA) 93.1 (PM), 61.0 (STA) 146.3 (PM), 45.0 (STA) Sub. 3 1.00 (PM), 2.10 (STA) 102.2 (PM), 52.0 (STA) 120.6 (PM), 33.0 (STA) Sub. 4 1.20 (PM), 1.98 (STA) 99.6 (PM), 55.0 (STA) 115.3 (PM), 46.0 (STA) Sub. 5 1.21 (PM), 1.95 (STA) 99.3 (PM), 56.0 (STA) 113.2 (PM), 43.0 (STA)
P: Peak amplitude (Nm). T: Time peak (ms); HR: Half relaxation time (ms); PM: Proposed method; STA: Spike triggered averaging technique.
200 400 600 800 1000 1200 0 20 40 60 80 100 HR 150 ms HR 116 ms P T HR Time (ms) To rq u e (A U)
0 5 15 25 50 75 100 -30 -25 -20 -15 -10 -5 0 5 % of MUs S NR ( d B)
5 15 25 50 75 100 10 20 30 40 50 60 70 80 90 100 % of MUs C o n v er g en ce R at e (% ) 5 s 10 s 30 s
5 15 25 50 75 100 0 2 4 6 % of MUs P ( A U) 5 15 25 50 75 100 0 50 100 % of MUs T ( m s ) 5 15 25 50 75 100 0 100 200 % of MUs HF ( ms )
5 15 25 50 75 100 0 50 100 % of MUs P ( % o f S im u la te d ) 5 15 25 50 75 100 0 20 40 60 % of MUs T ( % o f S im u la te d ) 5 15 25 50 75 100 0 20 40 60 80 % of MUs H R ( % o f S im u la te d )
Fig 5. Influence of synchronization on the estimated twitch force parameters with the proposed method (dark blue) and the STA technique (light blue) (for the deconvolution, segments of 30 s and 15 % of the active motor units were used).
0.05 0.4 0.9 0 200 400 600 800 1000 P (% ERR OR) CIS (pps) 0.05 0.4 0.9 0 20 40 60 80 100 T (% ER ROR ) CIS (pps) 0.05 0.4 0.9 0 20 40 60 80 100 HR (% ERR OR) CIS (pps)
SUBJECT I 10 MUs SUBJECT II 12 MUs SUBJECT III 19 MUs Measured / Estimated Torque (5 s) Average Twitch Torque (deconv.) STA Twitch Torques 0 200 400 600 800 1000 1 2 3 4 N ·m x 1 0 -4 40 80 120 160 0 2 4 6 8 N ·m x 1 0 -4 200 400 600 800 1000 0 0.4 0.8 1.2 1.6 N ·m x 1 0 -4 40 80 120 160 0 0.2 0.4 0.6 0.8 N ·m x 1 0 -4 Time (ms) Time (ms) N ·m x 1 0 -4 200 400 600 800 1000 0 0.4 0.8 1.2 1.6 40 80 120 160 0 0.4 0.8 1.2 1.6 N ·m x 1 0 -4 Time (ms)
Time (ms) Time (ms) Time (ms)
30s 10s 5s STA 0 1 2 x10⁻⁴ P ( Nm ) 30s 10s 5s STA 0 20 40 60 80 100 120 T ( m s ) 30s 10s 5s STA 0 40 80 120 160 HR ( m s ) 0 100 200 300 400 500 600 700 800 900 1000 -2 0 2 4 6 8 10 12 14x10-5 A m p li tu d e ( Nm ) Time (ms)