High Performance Computing on CRESCO Infrastructures: research activities and results 2012 Contributions provided by a selection of users of the CRESCO infrastructure
Edited by: Filippo Palombi, Delinda Piccinelli
2014 ENEA
Agenzia per le Nuove tecnologie
l’Energia e lo sviluppo economico sostenibile Lungotevere Thaon di Revel, 76
00196 Rome ISBN 978-88-8286-302-9
INDEX Pages
Foreword 7
Peptide-TiO2 Surface Interaction in Solution by Molecular Dynamics Simulation.
C. Arcangeli, M. Celino. 9
Characterizing the energy landscape of biomolecules
L. Bongini. 13
Validation of the MINNI Atmospheric Model System (AMS) with the Trisaia Field Campaign Data.
G. Briganti, A. Cappelletti, M. D’Isidoro, M. Mircea, L. Vitali. 17 Thermo-Acoustic Instabilities in a Lab-Scale Burner.
A. Di Nardo, G. Calchetti, S. Chiocchini, E. Giacomazzi, E. Giulietti. 25 OXY-COAL Combustion Simulations in an Experimental Furnace.
A. Di Nardo, G. Calchetti. 31
Temperature Effect on the Electronic Properties of small Cadmium Sulfide Nanocluster.
E. Burresi, M. Celino. 35
High-resolution regional Climate Modeling for Impact Studies in Africa.
S. Calmanti, E. Lombardi, G. Pisacane, M. V. Struglia. 39
Simulation of chemical Reactions Catalyzed by transition Metals Complexes -I.
L. Falivene, L. Cavallo. 45
Simulation of chemical Reactions Catalyzed by transition Metals Complexes -II.
A. Poater, L. Cavallo. 49
A Hybrid Particle-Field Coarse-Grained Molecular Model for Pluronics Water Mixtures.
A. De Nicola, G. Milano. 51
Mg atomic Diffusion in MgO Grain Boundary.
F. Landuzzi,M. Celino, F. Cleri, L. Pasquini. 55
The Effects of Vacancies in the mechanical Properties of Tungsten: an ab-initio Study.
S. Giusepponi, M. Celino. 61
Adhesion Chemistry and Work Function of (111) Silicon Surface Functionalized with Self-Assembled Alkylsilane Coatings: an ab-initio Study
Les Investigation of Turbo-machinery Flows.
D. Borello, L. Cardillo, A. Corsini, F. Delibera, F. Rispoli and A. Salvagni. 79 Effect of superficial Water on the Structure of a spherical Cluster of ZrO2.
R. Grena. 83
Ab-initio Study of amorphous Germanium.
G. Mancini, M. Celino and A. Di Cicco. 87
AMD 6234 Interlagos vs. Intel E5-2680 Sandy Bridge. Benchmark of different computational Codes.
S. Giusepponi, A. Funel, F. Ambrosino, G. Guarnieri, G. Bracco. 93 Atmospheric Dispersion of Iodine-131 released after the Fukushima Event
G. A. Marzo. 107
A. Marabotti. 113
Corrosion Inhibition of Iron in high Temperature molten liquid Lead by using Oxygen Injection.
A. Arkundato, Z. Su’ud, M. Abdullah, W. Sutrisnoand M. Celino. 119 Shutdown dose Rate Assessment with the Advanced D1S Method:
Development and Applications to ITER TBM Port Plug Studies.
R. Villari, F. Moro, S. Podda. 123
Computational Analysis of media Effects on Model Compound MBET-306.
C. Guardiani,P. Procacci. 129
A high-resolution 46-year atmospheric hindcast for the Mediterranean Basin.
G. Sannino, A. Carillo, M. Palma. 139
Excitonic Effects in low dimensional Systems.
V. Garbuio, C. Violante, A. Mosca Conte, I. Kupchak, M. Marsili, P. Gori
and O. Pulci. 145
Shear-band Formation in Cu64Zr36 metallic Glass under uniaxial Compression.
J. Zemp, M. Celino, J. F. Löffler, B. Schönfeld. 149
Combustion Activities and Performance Analysis of the HeaRT Code
F. R. Picchia, E. Giacomazzi, D. Cecere, N. Arcidiacono. 153 Particle Simulation of Alfven Mode Dynamics in Nuclear Fusion Devices
S. Briguglio, G. Fogaccia, G. Vlad and X. Wang. 159 Ab-initio Calculation of Nb3Sn Superconducting Properties Under
Applied Mechanical Strain
G. De Marzi, L. Morici. 165
Molecular Dynamics Simulations to Study the Structural Features of a Thermophilic Protein
Use of Monte Carlo in State-of-the-Art PWR Design: Continuing Analysis of the Impact of the Heavy Reflector of a Typical Large Size GEN III+ Reactor Design on some Safety Featurse: Completion of the Ex-Core Detector Calculations and Examination of the Impact on Flux Tilt. Development and Testing of New Algorithms within Monte Carlo Eigenvalue Calculations employing the Source-Iteration Method.
K. W. Burn. 173
LES Simulation of a Devolatilization Experiment on the IPFR Facility. F. Donato, G. Rossi, B. Favini, E. Giacomazzi, D. Cecere, F.R. Picchia,
N.M.S. Arcidiacono. 179
Usage Statistics of CRESCO in 2012.
F. Palombi, F. Ambrosino, G. Aprea, T. Bastianelli, F. Beone, G. Bracco, M. Caporicci, M. Chinnici, A. Colavincenzo, A. Cucurullo, P. Dangelo, A. Dellacasa, M. Derosa, A. Funel, G. Furini, D. Giammattei, G. Giannini, S. Giusepponi, R. Guadagni, G. Guarnieri, A. Italiano, A. Mariano, G. Mencuccini, C. Mercuri, S. Migliori, P. Ornelli, S. Pecoraro, A.
Perozziello, A. Petricca, D. Piccinelli, S. Pierattini, S. Podda, F. Poggi,
Foreword
During the year 2012 CRESCO high performance computing clusters have provided about 20 million hours of computing time, at a high availability rate, to more than one hundred users, supporting ENEA research and development activities in many relevant scientific and technological domains. In the framework of joint programs with ENEA researchers and technologists, computational services have been provided also to academic and industrial communities.
This report, the fourth of a series started in 2008, is a collection of papers illustrating the main results obtained during 2012 using CRESCO HPC facilities in the fields of material science, computational fluid dynamics, climate research, nuclear physics and biophysics. The report shows the variety of the applications of high performance computing, which has become an enabling technology for science and engineering.
ENEA Portici Research Centre near Naples is the location hosting the main ENEA computational resources. This is a result of the Project CRESCO (Computational Centre for Research on Complex Systems), co-funded, in the framework of the 2001-2006 European Regional Development Funds Program by the Italian Ministry of Education, University and Research (MIUR).
The CRESCO Project provided the resources to set up the first large HPC x86_64 Linux cluster in ENEA, achieving a computing power relevant on Italian national scale (it ranked 126 in the HPC Top 500 June 2008 world list, with 17.1 TFlops and 2504 cpu cores). It was later decided to keep CRESCO as the signature name for all the clusters in the ENEAGRID infrastructure which integrates all ENEA scientific computing systems, and is currently distributed in six Italian sites.
In 2012 the ENEAGRID computational resources consisted of 3500 computing cores and about 300 TB of raw data storage.During the year a number of new projects - namely LAMRECOR, ITACHA, TEDAT and VIS4FACTORY - funded by MIUR in the framework of the 2007-2013 European Regional Development Funds Program, made it possible to carry out a substantial upgrading. In 2013 two new x86_64 clusters (named CRESCO3, 2016 AMD cores, and CRESCO4, 4864 Intel cores, ~120 TFlops peak) and new storage (600 TB raw) have been acquired and will enter in operation by the end of year.
The success and the quality of the results produced by CRESCO stress the role that HPC facilities can play in supporting science and technology for all ENEA activities, national and international collaborations, and the ongoing renewal of the infrastructure provides the basis for a similar role in the forthcoming years.
9
Peptide-TiO
2surface interaction in solution by molecular dynamics simulation
Caterina Arcangeli*,Massimo Celino ENEA, UTTMAT-DIAG, C. R. Casaccia
Keywords: Molecular dynamics, adhesion, titanium dioxide, surface, amino acids
*Corresponding Author: E-mail: [email protected], Tel: +39-0630486898, Fax: +39-0630483176
Classical Molecular Dynamics (MD) simulations were carried out to investigate both the structure and the stability of a full peptide on the (101) surface of TiO2 in the anatase crystalline structure. The
strength of the adhesion was estimated by pulling the peptide away from the surface. Our results shed light on the role played by some amino acids that are known to be essential in selective adsorption on TiO2, as well as on the peptide structural conformation upon the surface. The
simulations were carried on CRESCO HPC cluster by using the highly optimized parallel version of GROMACS (version 4.5.4).
Introduction
Investigation of the structure and properties of the interface between biological matter and titania surfaces have attracted a great deal of attention. Indeed titania-biomolecule interfaces are of fundamental importance not only for the development of biocompatible materials for surgical implants, but also for the bioinspired fabrication of nanostructured materials [1]. Experimental characterization of the peptide-titania interface [2] has revealed that electrostatic interactions play a key role and that peptide flexibility may also be important [3]. Moreover experiments point out that some aminoacids among the others, like for example Arg and Asp, have a peculiar role in the adhesion mechanism [2, 3]. In order to shed some light on this interaction, we investigated computationally the binding of a peptide on the (101) surface of TiO2 anatase with the aim to define
a model of interaction between selective-binding peptides and titania oxides. Even if a number of modeling and simulation studies have recently appeared for peptide-titania adsorption [4-11], these are limited to systems composed by only dipeptide, tripeptide or hexapeptide. In this study, MD simulations of the entire peptide composed of 13 amino acids and titania surface in the presence of the solvent is performed to investigate the role of the peptide flexibility and of the solvent on the interactions with the titania oxides.
Computational details
The MD simulation of the system (ca. 4400 atoms), composed by the folded peptide, the TiO2
anatase (101) surface and the water solvent, was performed following the simulation protocol of Kang et al. [12]. The OPLSAA force field [13] was used to describe the protein and the TiO2
parameters were supplemented. The Lennard-Jones parameters of Ti and O atoms were obtained from the literature [12, 14, 15]. For the water molecule the SPC water model was used [30]. During the simulation the inorganic surface was kept frozen. The simulation, for a total duration of 15 ns, was carried out in the canonical (NVT) ensemble. The peptide was placed close (at an average distance of 1 nm) to the TiO2 surface oriented with the lateral chains of the arginine (Arg) and
aspartic acid (Asp) perpendicular to the surface. The system was immersed in a rectangular box of 3.14 • 3.03 • z nm3
, where z is the box length along the direction perpendicular to the TiO2 surface.
In this study z is set to 5.0 nm to fit the starting orientation of the peptide. The box lengths, in the x and y directions, fit the crystal parameters of the surface, creating infinite slabs in the x-y plane.
10 Results and Discussions
MD simulations of the adsorption of the full peptide on the surface were performed by placing the peptide at about 1.0 nm distant from the TiO2 surface. The peptide was oriented with the lateral
chains of the Arg and Asp residues perpendicular to the surface. In Fig. 1 the configuration of the adsorbed folded peptide on the surface and the surrounding water molecules, after 5 ns of simulation is shown. The interfacial water molecules are quite stable and oriented on the TiO2 surface to form a
Fig 1: Snapshots of side view (left) and top view (right) of the adsorbed peptide onto TiO2 (101) anatase surface taken at 5 ns. The peptide backbone is shown as a green ribbon while Arg3 and Asp7 are represented through CPK model. Only the interfacial water molecules are shown for clarity. The hydrogen bonding network among them is displayed as white dashed lines. The hydrogen bonding network among the atoms of the peptide and those of the surface is also shown, in yellow dashed lines. Movies of the simulation are at http://www.afs.enea.it/project/cmast.
hydrogen bond network induced by the surface. The side chain of the Asp7 residue adsorbs on the surface mediated by the interfacial water layer whereas the side chain of the Arg3 residue forms H-bonds with the oxygen atoms of the surface. Fig. 2 shows the effect of the adsorbed peptide on the structure of the interfacial water. The density profiles for both exposed surfaces have distinct peaks corresponding to different hydratation layers (Fig. 2a).
Fig 2: Density profile as function of the z axis for water (a) and peptide atoms (b). The plane containing the TiO2 (101) anatase surface ranges from 1.9 to 2.5 nm and defines two interfaces. The left water-surface interface is free from the peptide; the right water-surface interface is affected from the presence of the peptide.
The presence of the peptide causes a decrease of the local water density. Similar results are observed for the adsorbed tripeptide (KEK) on negatively charged partially hydroxylated rutile (110) TiO2
surface [6], in which the tripeptide affects only the first water layer that corresponds to molecularly adsorbed water molecules. The atoms of the lateral chains of the Arg3 and Asp7 are located in the first and second adsorbed water layer (Fig 2b). As shown in Fig. 3, in which the trend of the residue-surface minimum distance as a function of the simulation time is plotted, the acidic and basic residues show great affinity to the surface and, as extensively reported in previous simulations [7, 8,
11
10-12], the carboxyilic and guanidine groups ofthe residues are the main adsorbed groups that interact with the surface. In addition to the electrostatic interactions that seem to play the dominant role, Van der Waals interactions are also observed to occur between the peptide and the surface.
Fig 3: Residue-surface minimum distance as a function of the simulation time.
The non-polar Ala8 and Pro6 close to the surface (< 0.6 nm) due to the Van der Waals attractions, even if their interaction with the surface due to their connection with the adsorbed Asp7 can not be excluded. To better investigate the force of the interaction between the peptide and the surface, the peptide was pulled away from the surface along the z-direction, i.e. the direction perpendicular to the surface, over 10 ns of simulation using a spring constant of 5000 kJ/mol/nm2 and a pull rate of 0.0005 nm/ps.
Fig 4: Snapshots of the dissociation pathway (from top left to bottom right) of the peptide from the surface. The peptide backbone is shown as a cyan ribbon while the Arg3, Asp 7 and Cys13, relevant for the adhesion mechanism, are represented though CPK model. The plot shows the pulling force applied as a function of the simulation time. Movie of the pulling simulation is at http://www.afs.enea.it/project/cmast.
Such a method can be used to bias the behaviour of a system toward a particular phenomenon that might otherwise be inaccessible on the time scale of a conventional MD simulation [17] and has been successfully applied to the study of many process, such as protein-protein and protein-ligand interactions [18]. The dissociation pathway of the peptide from the surface with the corresponding
12
plot of the force as a function of the time is shown in Fig. 4. By pulling on the center of mass of the peptide, force builds up until three breaking points are reached, at which the interactions between the Cys13, Asp7 and Arg3 with the surface are disrupted, allowing the peptide to dissociate from the surface. A similar behaviour has been observed for the desorption of the hexapeptide RKLPDA from a natively oxidized TiO2 surface [10].
Conclusions
Atomic scale modeling is able to provide interesting insights in the design of novel materials. In the case of organic molecules interacting with inorganic surfaces, modeling can compute the adhesion properties and how these influence the physical and chemical properties. MD simulations of the peptide-surface interface enlight the cooperative behavior of amino acids.
Acknowledgment
This work was supported by META- Materials Enhancement for Technological Application- Project (FP7-PEOPLE-2010-IRSES-Marie Curie Actions, PIRSES-GA-2010-269182). We acknowledge the technical support of the ENEA-ICT team who provided the access to the ENEA-CRESCO high-performance computing facility (www.cresco.enea.it). We thank Drs. G. Aprea and S. Giusepponi for helpful discussions and suggestions.
References
1. M. B. Dickerson, K. H. Sandhage, R. R. Naik, Chem. Rev. 108, 4935-4978 (2008). 2. K. I. Sano, K. Shiba, J. Am. Chem. Soc. 125, 14234-14235 (2003).
3. H. B. Chen, X. D. Su, K. G. Neoh, W. S. Choe, Langmuir 25, 1588-1593 (2009). 4. V. Carravetta, S. Monti. J. Phys. Chem. B 110(12), 6160–9 (2006).
5. S. Monti, V. Carravetta, C. Battocchio, G. Iucci, G. Polzonetti. Langmuir, 24(7), 3205–14 (2008). 6. S. Monti, M. Alderighi, C. Duce, R. Solaro, M. R. Tine. J Phys Chem C 113, 2433–2442 (2009). 7. A. A. Skelton, T. Liang, T. R. Walsh, ACS Applied Materials & Interfaces 1(7), 1482–91 (2009). 8. C. Wu, A. A. Skelton, M. Chen, L. Vlček, P. T. Cummings. J Phys Chem C 115, 22375–22386 (2011). 9. S. Monti, A. C. T. Van Duin, S. Kim, V. Barone. J Phys Chem C 116, 5141–5150 (2012).
10. J. Schneider, L. Colombi Ciacchi. J Am Chem Soc 134(4), 2407–13 (2012).
11. C. Wu, A.A. Skelton, M. Chen, L. Vlček, and P.T. Cummings. Langmuir 28(5): 2799–811 (2012). 12. Y. Kang, X. Li, Y. Tu, Q. Wang, J. Phys. Chem. C 114 14496-14502 (2010).
13. W. Jorgensen, D. Maxwell, J. TiradoRives, J. Am. Chem. Soc. 118 11225-11236 (1996). 14. A. V. Bandura, J. D. Kubicki, J. Phys. Chem. B 107, 11072-11081 (2003).
15. M. Predota, A. V. Bandura, P. T. Cummings, J. D. Kubicki, D. J. Wesolowski, A. A. Chialvo, M. L.Machesky, J. Phys. Chem. B 108, 12049-12060 (2004).
16. J.A. Lemkul, D.R. Bevan, J. Phys. Chem. B. 114, 1652-1660 (2010).
17. S. Izrailev, S. Stepaniants, B. Isralewitz, .D Kosztin, H. Lu, F. Molnar, W. Wriggers, K. Shulten, Steered Molecular Dynamics, Vol. 4, Springer-Verlag, Berlin (1998).
13
Characterizing the energy landscape of biomolecules
Lorenzo Bongini
Abstract
The issue of characterizing the energy landscape is of great importance in the field of molecular dynamics simulation of bimolecules. Simulated trajectories often only provide a few examples of the many possible pathways of conformational change that characterize such large molecules and it is often difficult to assess how representative they are of the transition under study. Moreover, not infrequently the corresponding energetic information correlates with the kinetic features of the real system only qualitatively. An extensive of the energy landscape is, therefore, often necessary to understand at a reasonable level of detail conformational transition in biomolecules. Parallel computing is, therefore, necessary in tackling such a computationally expensive task.
DNA overstretching
The overstretching free energy landscape of a random DNA 23-mer containing 9 AT and 14 CG pairs was sampled via atomistic molecular dynamics simulations coupled with umbrella sampling. The conformational space of the chosen oligomer was investigated by simulating the effect of a heat bath trough a Langevin dynamics on 24 different copies of the system. Each copy was subjected to a restraining harmonic potential on its end-to-end distance in order to fix the average rise between consecutive base pairs during a simulation. The explored interval of base pair rise ranges from 0.34 to 0.58 nm. Simulations were performed with AMBER with the FF99SB force field. The different system copies were first heated at 400 K for 3 ns and then thermalized at 300 k for other 6 ns, until stabilization of the average enthalpy over a 1 ns window. After a preliminary analysis using an implicit solvent -employing the generalized Born solvation model and a rescaled Born radius (igb=5)- the simulation was repeated in explicit solvent, first with TIP3P and then with the SPC polarizable water model. In the implicit solvent simulation the ionic strength was set to 100 mM and the number of Na+ and Cl- ions in the explicit solvent simulations was chosen accordingly. In fig. 1 the radial distribution of the ionic cloud is investigated after 1 ns equilibration.
Fig. 1. Radial distribution function of the counter-ion cloud after 1 ns equilibration in SPC solvent.
14
Fig. 2 reports the free energy profile versus the average base pair rise. Free energy was computed by analyzing the end-to-end fluctuations of each constrained trajectory with the weighted histogram method, in the implementation of the freely available WHAM program by Alan Grossfield. Free energy grows monotonically with the base pair rise and no barrier is evident. The free energy difference between the maximally extended and compact conformations (0.58 and 0.34 nm rise) amounts to 4.8
T
kB per base pair, in reasonable agreement with the value of 3.7 kBT per base pair coming from experiments [1].
Fig. 2. Free energy profile for the overstretching of a DNA 23-mer. Free energy is computed by means of an umbrella sampling analysis over 2 ns trajectories. In the inset: free energy profile at the coexistence force between the compact and the extended state.
The knowledge of the free energy profile allows to compute the force of coexistence as the force that best “flattens” the profile following the transformation ( ) ( ) . The result of this graphical procedure is illustrated in the inset of Fig. 2 were we report the free energy profile at the coexistence force F = 102 pN, which is high but reasonably near to the experimental value. Moreover C at the coexistence force the free energy displays a nonzero barrier, 0.1 kBTper base pair, separating the compact and extended state at the plateau. The compact state at the coexistence force corresponds the left most minimum in the curve reported in the inset of fig. 2 and it is now significantly shifted with respect to its zero force collocation (0.34 nm rise), now being characterized by an average base pair rise slightly higher than 0.43 nm. This shift corresponds to a stretch modulus of 600 pN, which is in resonable agreement with the values reported in literature (see the introduction of Gore et al for a short review on the subject).
However, Fig. 2 also marks a difference from experimental data. The extended state is shorter than expected, measuring just 0.52 nm in rise instead than 0.58 nm. It is difficult to speculate on the origin of these differences and a more extensive analysis with different force fields is in order.
The lack of a free energy barrier at 0 force and its presence at a given tension is a hallmark of enthalpy stabilized structures which, under tension, might undergo bond breaking events leading to higher energy, entropy stabilized structures. In this case, however, (see Fig. 3 where we report both the enthalpic and entropic profile of the transition) no clear signature of abrupt transitions can be seen in either the enthalpy of the process or in the vibrational entropy, which was estimated for each constrained trajectory by diagonalizing the mass weighted covariance matrix trough the PTRAJ tool of AMBER.
Only the Van der Waals contribution to the system enthalpy (inset of Fig. 3) shows a small discontinuity of approximately 2 kBT per base pair above 0.46 nm base pair rise. The most significant conformational change taking place at that molecular extension is the unstacking of the AT base pairs. The observed energetic increase is however significantly smaller than expected for full unstacking (approximately 6
15 T
kB per base pair), suggesting that unstacking is readily compensated by the appearance of non-native stacking contributions.
Fig. 3. Enthalpic and entropic contributions to the free energy. In the inset the Van der Waals contribution to free energy.
The lack of an enthalpy barrier observable in Fig. 3, is in full agreement with the findings recently reported in [1] and also the actual numerical vale for the E -the enthalpy difference between the ‡ transition and the compact state- is approximately 10 kBT per base pair, not too far off from the expected 8.2 kBT per base pair [1].
The values here reported correspond to the SPC simulations. The TIP3P results are qualitatively very similar but the coexistence force turns out significantly higher (160 pN) suggesting that the choice of the correct water model is of paramount importance when performing simulations of systems which undergo significant changes in their hydration properties.
A multiscale approach to the study of a molecular motor
Molecular motors are biomolecules that transform chemical energy in mechanical work. In the cell they are responsible not only for motility but also for trafficking between the various cellular compartments and they constitute a large part of the DNA repair and replication machinery.
Fig. 5. Temporal evolution of the B-factors of a kinesin head after impulsive stimulation of the ENM with highest overlap with the ATP binding site.
16
The ratchet paradigm appears insufficient in explaining the behavior of biological molecular motors when the physiological data are taken in to account. Their typical force-velocity relation of a molecular motor (see [2] for the force velocity relation of the actin-myosin motor) is more immediately explained by a barrier limited diffusion between consecutive metastable states on a tilted landscape. The amount of time needed to sample with reasonable detail the huge configuration space accessible by such a large molecule is, nonetheless, too large. In order to devise strategies for the efficient sampling of the energy landscape we chose to compare the full atomistic landscape with that of a simplified model. We choose the Elastic Network Model because of its ability to capture with reasonable precision the low frequency eigenmodes of the system which are dictated solely by topology. Since ATP release is the force generating step in kinesin we are interested in detailing the propagation of information along the protein. In figure 4 we show that an impulsive stimulation along the ENM eigenmode with greater overlap with the ATP binding site is preserved for a significantly long time also when simulating the system with AMBER (in vacuo). The microtublule binding residues were held fixed with stiff harmonic constraints.
Bibliography
[1] Bongini L., Melli L, Lombardi V., Bianco P., “Transient kinetics measured with force steps discriminate between double stranded DNA elongation and melting and define the reaction energetics”, submitted to NAR
[2] Piazzesi G., Reconditi M., Linari M., Lucii L., Bianco P., Brunello E., Decostre V., Stewart A., Gore D. B., Irving T. C., Irving M., Lombardi V., “Skeletal Muscle Performance Determined by Modulation of Number of Myosin Motors Rather Than Motor Force or Stroke Size”, Cell 131, (2007) pp.784–795.
17
VALIDATION OF THE MINNI ATMOSPHERIC MODEL SYSTEM (AMS) WITH THE TRISAIA FIELD CAMPAIGN DATA
Gino Briganti1*, Andrea Cappelletti1, Massimo D’Isidoro2, Mihaela Mircea2, Lina Vitali2
1
ENEA-UTVALAMB-AIR. Territorial Office of Pisa
2
ENEA-UTVALAMB-AIR. Bologna Research Centre * e-mail: [email protected]
Introduction
MINNI [1] is the Italian Integrated Assessment Modelling System for supporting the International Negotiation Process on Air Pollution and assessing Air Quality Policies at national/local level sponsored by the Italian Ministry of the Environment. The MINNI system is composed of an Atmospheric Modelling System (AMS) and the Greenhouse Gas and Air Pollution Interactions and Synergies model over Italy (GAINS-Italy), connected to one another through the Atmospheric Transfer Matrices and RAINS Atmospheric Inventory Link. The main components of AMS are the meteorological model (RAMS [2]) and the air quality model (FARM [3], [4]), for simulating the atmospheric chemistry.
The standard air quality simulations of the reference scenarios have been carried out over the whole Italy with horizontal 20 km spatial resolution and over five sub-domains, including respectively north, centre and south of Italy, Sardinia and Sicily islands, with 4 km horizontal spatial resolution. During the course of the Project, the whole AMS has been deeply upgraded to the present state of the art of the research, by introducing a new chemical mechanism SAPRC99 [5], a specific model for simulating biogenic emissions from vegetation (MEGAN [6]), the TUV (Tropospheric Ultraviolet and Visible Radiation Model) module [7]; moreover, the simulations have been performed for the first time at 1 km resolution. An ad hoc field campaign, supported by the Italian Ministry of the Environment and carried out at the ENEA Trisaia Research Center of Rotondella (Matera – Basilicata, May-June 2010), allowed us to test the performances of the AMS. This report shows some preliminary results of the application of AMS to the Trisaia campaign. The availability of ENEA-GRID computational resources has been crucial for achieving our purposes, because of the higher computational demand associated with the model upgrades such as the SAPRC99 mechanism, TUV module and, specially, the spatial resolution increase.
Air Quality fields production and evaluation
COMPUTATIONAL DOMAINS AND SPATIAL RESOLUTION
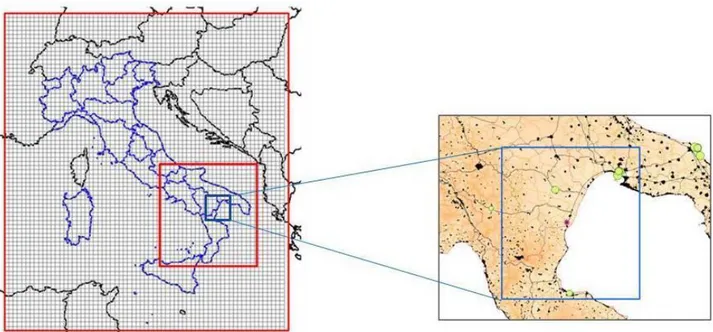
In the frame of this validation exercise, AMS has been applied to simulate the state of the atmosphere for all the period of the Trisaia field campaign (May – June 2010). As it is usually done for AMS-MINNI simulations, meteorological and concentration fields have been both produced with hourly time step and a spatial resolution of both 20 km, at national scale, and 4 km over a sub-domain covering the south of Italy (Fig. 1, on the left). Vertically, the computing sub-domain consists of 16 terrain following vertical levels from 20 m to 10000 m above the ground. The availability of a comprehensive database to be used for model validation provided an opportunity for a first test of the MINNI modelling system downscaled at an higher resolution (1 km). The domain used for the high resolution simulations is illustrated on the right in Fig. 1, where the star identifies the site of Trisaia.
18
This domain was chosen to include Taranto urban area and the main industrial point sources of the area (green circles in the Figure).
Figure 1. National domain and south of Italy sub-domain commonly used for AMS-MINNI simulations (left) and high resolution domain for Trisaia simulation (right).
The number of grid points needed for each of the three simulations at different spatial resolution is shown in Tab.1.
Table 1. Grid points number for simulations at different spatial resolution.
METEOROLOGICAL FIELDS INPUT
The meteorological fields have been reconstructed by means of the prognostic non-hydrostatic Regional Atmospheric Modeling System (RAMS) Version 6.0, developed at Colorado State University [2]. With regard to run settings, the same approach commonly used in the frame of the MINNI project has been largely retained. Initial, boundary conditions and data assimilation have been based on mesoscale analyses produced by means of a RAMS pre-processor which implements an optimal interpolation method. European Centre For Medium-Range Weather Forecast (ECMWF) analyses have been used as background fields and World Meteorological Organisation (WMO) surface observations as measured data. A nudging technique has been employed by RAMS to assimilate data analyses during the whole model simulation. In order to remove any possible drift of the calculated fields with respect to the large-scale analysis and local observations, the simulations have been re-initialized every ten days. RAMS implements a multilayer soil model [8] coupled to the atmospheric model to allow the evaluation of heat and moisture fluxes. For each decadal run, soil temperature and moisture profiles have been initialized using the data relating to the previous run,
20 km 4 km 1 km
Nx 67 116 119
Ny 75 121 131
Nz 16 16 16
19
allowing continuity of soil status during the whole 2 months simulation. To get a good initialization of the first ten days of May 2010, model simulation has been extended to the whole April 2010. As an example of how the increasing resolution allows to describe more accurately atmospheric phenomena, Fig. 2 presents the monthly mean temperature for June 2010, modelled at the three different resolutions. To allow a qualitative comparison of the fields, the results, even at the resolution of 20 km and 4 km, are presented on the smaller domain for which high resolution fields are available too. In order to evaluate model performances, available observations from the ISPRA-SCIA database [9] are superimposed on each map (coloured symbols, provided in the same colour scale).
Figure 2. Monthly mean temperature (°C) fields for June 2010 produced by RAMS at different spatial resolutions: 20 km (left), 4 km (center) and 1 km (right). Comparison between simulated fields and observations from the ISPRA-SCIA
database (colored symbols).
AIR QUALITY RESULTS AND EVALUATION
The chemical-diffusive simulations were conducted by using the FARM code (Flexible Regional Atmospheric Model) [3] [4], developed by ARIANET s.r.l. (http://www.aria-net.it/). FARM is a three-dimensional Eulerian grid model with K-type turbulence closure, that accounts for the transport, chemical reactions and ground deposition of atmospheric pollutants. The versions used are the 2.13 with SAPRC90 chemical mechanism [10] and 3.1, with SAPRC99 chemical mechanism [5] and the TUV module [7].
Grids specifications for FARM simulations are shown in Tab. 1. As initial and boundary conditions at 20 km resolution (Fig. 1) the EMEP (Meteorological Synthesizing Centre – West, MSC-W, http://www.emep.int/mscw/index.html) fields, suitably regridded and remapped to SAPRC90 and SAPRC99 mechanisms, were used. Higher resolution simulations were performed by employing an off-line one-way nesting.
Fig. 3 shows an example of the effects induced by the increase of the resolution on 2-month averaged ozone concentration at ground level. It is worth noting how spatial details are enhanced as the resolution increases. At 1 km we may appreciate even low values of ozone in the Basento valley, due to ozone titration resulting both from local industrial emissions and traffic; also in the Taranto area we observe an ozone consumption because of emissions from both the urban texture and the big industrial settlement.
20
Figure 3. Effect of increased resolution on period-averaged ozone concentration pattern: 20 km (left), 4 km (center) and 1 km (right).
In Fig. 4 the hourly series of the experimental data (in red) compared to simulated ones for the Trisaia site are plotted. An improvement is obtained by using the biogenic emissions calculated by means of the MEGAN model [6] (in blue) rather than those derived from the ISPRA inventory (in green) (http://www.isprambiente.gov.it/it/banche-dati/aria-ed-emissioni-in-atmosfera). This improvement is more evident regarding the highest and maximum daily values, which are involved in the regulation compliance.
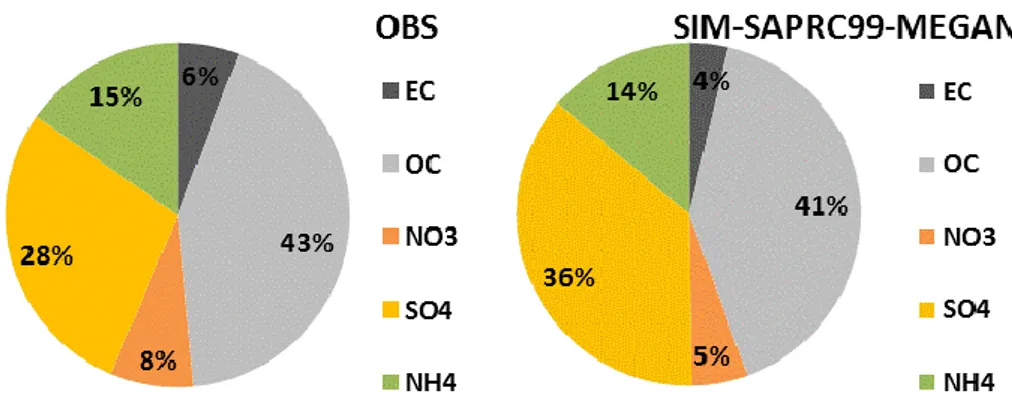
Another remarkable result obtained by using the MEGAN model is the good performance in reproducing the particulate matter speciation: Fig. 5 shows as the modelled speciation data are very close to measures; only the sulphates are slightly overestimated by the model compared to observations, possibly due to the incomplete modelling of the thermodynamics of Sicilian volcanic plumes. In particular the use of MEGAN model produced a significant increase of organic carbon amount. This is related to the enhanced production of secondary organic aerosols due to the oxidation of isoprene, whose MEGAN emissions result higher than the ones derived from ISPRA. These are really the expected result, because the Basilicata region is populated by lots of greenery, whose emissions are obviously estimated with more accuracy by means of a specific biogenic model like MEGAN.
Figure 4. Time series of observed (red) vs simulated concentrations, using both the ISPRA inventory biogenic emission (green) and the MEGAN model (blue), at Trisaia site.
21
Figure 5. Particulate matter speciation observed (left) and modeled (right). EC=elemental carbon, OC=organic carbon, NO3=nitrates, SO4=sulfates, NH4=ammonia.
Information about Codes, Storage and CPU time
RAMS is an open source code (http://www.atmet.com/index.shtml) written in Fortran language. It was compiled in its parallel version and implemented in MVAPICH environment. In order to identify the optimal processor number minimizing execution times, some different processor numbers were tested and 64 was chosen as optimal one. Parallel jobs were dispatched on cresco2 machines.
The FARM finite-elements code is written in Fortran90 language and compiled with the Intel® Fortran Compiler, by employing the OpenMP parallelization paradigm. We already found that the optimal number of processors to be used in CRESCO environment is 8 [11]. In order to take advantage of the dedicate 24-hour queue “minni_128h24”, the batch runs were arranged through the dependency option available with the LSF “bsub” command, by splitting then each job as follows: i) eight concatenated sub-jobs simulating 10 days at 20 km resolution; ii) fifteen concatenated sub-jobs simulating 4 days at both 4 and 1 km resolution.
CPU time and storagerequirements for meteorological (Fig. 6 and Tab. 2) and air quality (Fig. 7 and Tab. 3) simulations are shown at the three different resolutions. About the air quality storage, both input (emissions) and output files are accounted.
It is worth noting that the amount of memory space for meteorology and air quality outputs depends almost linearly on the number of grid points (Tab. 1). Both meteorological and air quality inputs/outputs are stored in netCDF format, by means of 2D and 3D variables, with a own different amount of specific memory per variable. This is precisely the reason why air quality storages do not exactly scale with the grid spacing.
CPU times also grow almost linearly with the number of grid points for 20 and 4 km resolution; despite the number of grid points changes little passing from 4 to 1 km resolution, the considerable growth of CPU time, with respect to the 4 km run, is due to a smaller integration time, needed for guaranteeing reliable and convergent solutions. Even the appearance of new small-scale meteorological structures, arising as the grid space is reduced, may contribute to rise the CPU time. Conclusions
The verification of AMS-MINNI with data from the Trisaia field campaign showed good performances and confirmed that both the introduction of new modules and the increasing spatial resolution substantially improved the model performances.
Future verifications of AMS-MINNI in polluted areas, such as the Po Valley, will provide further indications on the strengths and shortcomings of the modelling system.
22
Table 2. CPU times and space requirement for meteorological simulations.
Table 3. CPU times and space requirement for air quality simulations.
Figure 6. CPU time (left axis) and space requirement (right axis) for meteorological simulations.
Figure 7. CPU time (left axis) and space requirement (right axis ) for air quality simulations.
20 km 4 km 1 km
CPU time (hours x cores) 2207.10 5967.94 14321.46
Space (GB) 6.37 17.79 19.75
20 km 4 km 1 km
CPU time (hours x cores) 807 2444 6198
23 References
[1] ZANINI G., MIRCEA M., BRIGANTI G., CAPPELLETTI A., PEDERZOLI A., VITALI L., PACE G., MARRI P., SILIBELLO C., FINARDI S., CALORI G. The MINNI project: an integrated assessment
modeling system for policy making. International Congress on Modelling and Simulation. Zealand,
Melbourne, Australia, 12-15 December 2005, pp. 2005-2011. ISBN: 0-9758400-2-9.
[2] COTTON W.R., PIELKE R. A., WALKO R. L. , LISTON G. E., TREMBACK C. J., JIANG H., MC ANELLY R. L., HARRINGTON J. Y., NICHOLLS M. E., CARRIO G. G. AND MCFADDEN, J. P.
RAMS 2001: Current status and future directions. Meteorology and Atmospheric Physics, 82, (2003)
5-29.
[3] SILIBELLO C., CALORI G., BRUSASCA G., CATENACCI G., FINZI G. Application of a
photochemical grid model to Milan metropolitan area. Atmospheric Environment 32 (11), (1998)
2025-2038.
[4] GARIAZZO C., SILIBELLO C., FINARDI S., RADICE P., PIERSANTI A., CALORI G., CECINATO A., PERRINO C., NUSIO F., CAGNOLI M., PELLICCIONI A., GOBBI,G.P., DI FILIPPO P. A
gas/aerosol air pollutants study over the urban area of Rome using a comprehensive chemical transport model. Atmospheric Environment 41, (2007) 7286-7303 .
[5] CARTER W.P.L.. Documentation of the SAPRC-99 chemical mechanism for VOC reactivity assessment. Final report to California Air Resources Board, Contract no. 92-329, and (in part) 95-308, (2000).
[6] GUENTHER A., KARL T., HARLEY P., WIEDINMYER C., PALMER P. I., AND GERON C.
Estimates of global terrestrial isoprene emissions using MEGAN (Model of Emissions of Gases and Aerosols from Nature). atmos. chem. phys., 6, (2006) 3181-3210.
[7] MADRONICH S. Photodissociation in the atmosphere 1. Actinic flux and the effects of ground
reflections and clouds. J. Geophysical Research, 92, (1987) 9740–9752.
[8] WALKO R.L., BAND L.E., BARON J., KITTEL T.G.F., LAMMERS R., LEE T.J., OJIMA D., PIELKE R.A., TAYLOR C., TAGUE C., TREMBACK C.J., VIDALE P.J. Coupled
atmosphere-biophysicshydrology models for environmental modeling. Journal of Applied Meteorology, 39, (2000)
931–944.
[9] DESIATO F., LENA F., TORETI A. SCIA: a system for a better knowledge of the Italian climate. Bollettino di geofisica teorica e applicata. Vol. 48, n.3, (2007) 351-358.
[10] CARTER W.P.L. A detailed mechanism for the gas-phase atmospheric reactions of organic compounds. Atmospheric Environment, 24 A (3), (1990) 481-518.
[11] BRIGANTI G., CALORI G:, CAPPELLETTI A., CIANCARELLA L., D’ISIDORO M., FINARDI S., VITALI L. Determination of multi-year atmospheric transfer matrices for GAINS-Italy model. High
Performance Computing on Cresco Infrastructure: research activities and results 2009-2010, (2011),
25
THERMO-ACOUSTIC INSTABILITIES IN A LAB-SCALE BURNER A. Di Nardo*, G. Calchetti*, S. Chiocchini **, E. Giacomazzi *, E.
Giulietti* [email protected]
*ENEA via Anguillarese 301 – 00123 ROMA ITALY **Università ROMA TRE
Introduction
Lean premixed combustion in gas turbines (GT) is widely used in order to meet stringent low NOx emissions demands. If this technique allows the achievement of a quite homogeneous temperature distribution, thermo-acoustic instabilities are a common problem in gas turbine combustors operating in lean premixed mode. Pulsations, caused by a resonant feedback mechanism coupling pressure and heat release [1–7], can lead to strong perturbations in the gas turbine and even to the destruction of system components. Equivalence ratio fluctuations is one of the major cause of flame instability [8, 9]: for example changes in air inlet velocity cause variations of the flow rate but may also produce mixing fluctuations and the introduction into the combustion zone of pockets with different equivalence ratio that can generate instabilities. The instabilities of turbulent premixed flames have been the subject of intense research in the last ten years. Numerical simulation tools at this moment are still not completely reliable in the studies of combustion instabilities and Large Eddy Simulation (LES) offers great possibilities for what concerns the self-excited combustion oscillations prediction [1–3, 10–14].
The burner
In this study the experimental campaign conducted at the German Aerospace Center (DLR) [15] was chosen as test case. The burner nozzle was designed by Turbomeca S.A. and was operated with premixed CH4/air, which for an equivalence ratio of Φ = 0.7 (25 kW) exhibited a strong self-excited thermoacoustic oscillation at a frequency of about 290 Hz. In Fig. 1 is shown a schematic of the entire system. Air at ambient temperature flows through a radial swirler to the burner nozzle. The fuel gas (CH4) is supplied through small holes within the radial swirler with high momentum to ensure good mixing before entering the 85x85 mm combustion chamber. The burner is
26
operated at 25 kW with an equivalence ratio of 0.70. Reynolds number at the nozzle is about 35000 and the swirl number is approximately 0.6.
Numerical methods
The simulations were conducted using the commercial CFD code ANSYS-FLUENT. The computational grid consists of about 4.000.000 computational cells. For the combustion chamber a hexahedral grid properly refined at the chamber inlet was adopted, while, given the geometric complexity, a tetrahedral grid was used for the plenum. The dynamic Smagorinsky-Lilly LES approach was used for turbulence. The turbulence-chemistry interaction was modeled using the Eddy-Dissipation-Concept model [16], in conjunction with a simple 2-steps and 5 species mechanism [17] and a more complex 46-steps and 17 species chemical mechanism [18]. Simulations were run in parallel on a about 128 cores of the high-parallel ENEA-CRESCO cluster section 2, for a month.
Comments
Pressure signals coming from microphones placed in the chamber and the plenum oscillate at a frequency of about 290Hz and the two signals are not in phase. The two signals recorded at the same positions during the simulation are reported in figure 2. The dominating frequency of both is about 250Hz. The figure also shows that the trace of the signal from the plenum is smoother than that from the combustion chamber. This was confirmed experimentally. Mean temperature field is similar for the two mechanisms used, but the simple one exhibits general higher values. On the other hand instantaneous fields reveal very high and unrealistic temperature peaks in this case, with respect experimental data. The flame is anchored at the nozzle exit, where the swirl effect generates an inner recirculation zone. Here the recirculation of hot products ignites the incoming fresh mixture, stabilizing the flame, which assumes the shape of a cone (fig. 1). Chemical reactions however extend until up to chamber walls. An outer recirculation zone it is also present at the chamber corners. Temperature profiles are reported in figure 3. If the external part of the profiles matches satisfactorily with the experimental data, there is a certain mismatch for the internal part. It seems that the inner recirculation zone predicted by the simulations is less wide in terms of reaction, even if it is well captured in terms of flow field (fig. 4). Mixing of fuel and air within the swirler it is not perfect, as results from CH4
27
profile at nozzle exit and the pulsating behavior of the flame is mainly due to changes in equivalence ratio of the fuel air mixture entering the combustion chamber. When pressure in the chamber is low, air flow velocities increase and the fresh mixture is not able to burn, also due to ignition delay.
Figure 1. Mean (right) and instantaneous (left) temperature (a) (K) and OH mass fraction (b).
Figure 2. Pressure signal in the plenum and in the chamber.
Pockets of combustible mixture rise even very far from nozzle exit and burn at chamber walls, where velocities lower and the elapsed time is sufficient for mixing and ignition delay. This causes an increase in pressure and a
28
subsequent reduction in air flow, that again generates a fuel-rich mixture. It is then possible to conclude that pressure fluctuations and heat release sustain each other, fulfilling the criterion for self sustained oscillations in flames of Rayleigh.
Figure 3. Temperature (top) and O2 mole fraction (bottom) radial profiles.
Figure 4. Axial velocity profiles. References
[1] Keller J.J., AIAA J. 33: 2280–2287 (1995).
[2] Fernandes E.C., Heitor M.V. , in: F. Culick, M.V. Heitor, J.H. Whitelaw (Eds.), Unsteady Combustion, Kluwer Academic, Dordrecht, 1996, p. 1.
[3] Paschereit C.O., Gutmark E., Weisenstei, W., Combust. Sci. Technol. 138: 213– 232 (1998). EXP * 6 mm + 10 mm o 15 mm < 40 mm > 60 mm EXP + 1.5 mm o 5mm x 15 mm > 35 mm
29
[4] Lefebvre A.H., Gas Turbine Combustion, Taylor & Francis, (1999). [5] Candel S., Proc. Combust. Inst., 29: 1–28 (2002).
[6] Lee J.G., Santavicca D.A., J. Propulsion Power 19:735–750 (2003). [7] Syred N., Prog. Energy Combust. Sci., 32 93–161 (2006).
[8] Lieuwen T., Torres H., Johnson C., Zinn B., J. Eng. Gas Turb. Power 123 (1) 182–189 (2001).
[9] Shreekrishna S., Hemchandra S., Lieuwen T., Combust. Theory Model. 14 (5) 681–714 (2010).
[10] Dowling A.P., Hubbard S., Proc. Inst.Mech. Engrs. 214: 317–332 (2000). [11] Stone C., Menon S., Proc. Combust. Inst. 29: 155–160 (2002).
[12] Cook D.J., Pitsch H., Peters N., Proceedings ASME Turbo Expo, GT2003-38558 (2003).
[13] Lieuwen T., J. Propulsion Power 19: 765–781 (2003).
[14] Roux S., Latigue G., Poinsot T., Meier U., Berat C., Combust. Flame 141: 40– 54 (2005).
[15] Meier W., Weigand P., Duan X.R., Giezendanner-Thoben R., Combustion and Flame 150: 2–26 (2007).
[16] Magnussen B. F., Nineteeth AIAA Meeting, St. Louis (1981).
[17] Westbrook C. K., Dryer F. L., Combust. Sci. Technol., 27: 31–44 (1981). [18] Smooke M.D., Puri I.K., Seshadri K., Proc. Combust. Inst. 21: 1783–1792 (1986).
31
OXY-COAL COMBUSTION SIMULATIONS IN AN EXPERIMENTAL FURNACE A. Di Nardo, G. Calchetti
*ENEA via Anguillarese 301 – 00123 ROMA ITALY Abstract
One of the most promising techniques for CO2 separation and capture is combustion in pure oxygen and recirculated exhaust gas atmosphere, named oxy-combustion. The use of exhaust gas is necessary for temperature containment, which otherwise would be too high. Theoretically, in this way it is possible to obtain CO2 concentrations of about 95%, after water vapor condensation. In order to delve into this technology and make available experimental data to validate numerical models, IFRF has realized an experimental furnace called Fo.Sper. [1], installed at ENEL-Livorno, able to operate in oxy+flue_gas and air mode. In the first case exhaust gases are extracted, cooled, condensed and partly returned to the combustion chamber, after being enriched in oxygen.
Furnace description
The furnace is a 2x2x6.25m parallelepiped. It consists of 11 refractory water-cooled sections, in order to simulate the energy extraction and heat exchange that takes place in a full-scale plant. Measuring probes are inserted through 14 ports, arranged along the furnace. The burner is essentially constituted by three concentric ducts (primary, secondary and tertiary). The inner pipe (primary) is used for pulverized coal feeding. The combustion air is fed through the secondary and tertiary ducts, provided of adjustable swirler.
Figure 1. The burner section. Simulation set-up and discussion
The simulation of the reactor Fo.Sper. was conducted using the ANYS-FLUENT software. The mesh is a hybrid mesh, tetrahedral in the inner of the burner and prismatic (triangular and quadrilateral base) in the combustion chamber and consists of about 500000 cells. Given the
32
periodicity of the problem, the study was limited to one quarter of the entire apparatus. The simulation uses for turbulence the k-ε model [2]. The EDC model (Eddy Dissipation Concept) [3] was adopted for chemical phenomena in gas phase and the P1 model for radiative heat transfer [4]. Temperature distribution on the walls was extrapolated from the available data. The trajectory and the exchange of energy and mass of the particles was evaluated according to a Lagrangian approach. Table 1 shows the boundary conditions used in the simulation. Pyrolysis was modeled as a two stage process. During primary pyrolysis coal particles decompose releasing volatile, composed of TAR, light hydrocarbons and gas. In the second stage, the TAR decomposes producing soot, hydrocarbons and light gases (mainly CO and H2). Coal burned in the experimental campaign is the Sebuku Indonesian. Volatile release was modeled with the CPD [5, 6, 7] model. The volatile species were represented with a single pseudo molecule like CxHyOz, which decomposes in the gas phase through an infinitely fast reaction according to:
CxHyOz→TAR+CH4+CO+CO2 (1)
Tab. 1. Operating conditions and reactions contsants.
TAR is appoximated as CnHm, with a ratio C/H=1.1 and is oxidated via the following first order reaction while the formation of soot was neglected:
CnHm+m/2O2→mCO+n/2H2 (2)
The light gases released during primary pyrolysis react according to the simplified mechanism of Jones and Lindstedt [8], whose constants are given in table 1.
Once the volatile species are issued during primary pyrolysis, the remaining char in the coal particles reacts with the surrounding gas. The mechanism adopted in this case is the following:
33
C(s)+1/2O2→CO (7)
C(s)+CO2→2CO (8)
C(s)+H2O→CO+H2 (9)
Reaction (7) is important for combustion in air, while reaction (8) becomes important in the case of oxy-combustion, due to the high partial pressures of CO2. Reaction (9) is relevant only under conditions typical of gasification. The rate of surface reactions is determined by the intrinsic kinetics of reactions (7) - (9) (whose constants are reported in Table 1) and the rate of gaseous species reagents diffusion within the particle [9-12].
Simulations were run in parallel on about 64 cores of the high-parallel ENEA-CRESCO cluster section 2, for a week.
In figure 2 particle trajectories are shown. The swirl ensures that the particles have, at least in the first part of their path, a helical motion within the combustion chamber and determines an increase in residence time and mixing. This, together with the fact that particles are relatively small (60 micrometers on average), makes the devolatilization process begin and run out very close to the burner. The same thing applies to char combustion.
The results were compared with experimental data measured through some of the ports located along the combustion chamber.
Species concentrations show a qualitative agreement, while temperature matches very well experimental data (figure 4).
Figure 2. Particles trajectories colored by residence time (s).
34
Figure 4. Temperature radial profiles.
References
[1]Coraggio G., Laiola M. “Combustion of NG and pulverized coal in a mixture of oxygen and RFG”. IFRF Doc NoF110/y/01 (2009).
[2]Launder B., Sharma B. “ Application of the energy-dissipation model of turbulence to the
calculation of flow near a spinning disc”. Letters in Heat and Mass Transfer, 1:131–137 (1974).
[3]B. Magnussen. Modeling of NO x and soot formation by the Eddy Dissipation Concept. Int. Flame Research Foundation, Jan 1989.
[4]Cheng P. “Two-dimensional radiating gas flow by a moment method”. AIAA Journal, 2(9):1662– 1664 (1964).
[5]Grant D., Pugmire R., Fletcher T., Kerstein A. “Chemical model of coal devolatilization using
percolation lattice statistics”. Energy & Fuels, 3(2):175–186 (1989).
[6]Fletcher T. H., Kerstein A. R., Pugmire R. J., Grant D. M. “Chemical percolation model for
devolatilization. 2. Temperature and heating rate effects on product yields”. Energy & Fuels,
4(1):54–60 (1990).
[7]Fletcher T. H., Kerstein A. R., Pugmire R. J., Solum M. S., Grant D. M. “Chemical percolation
model for devolatilization. 3. Direct use of carbon-13 NMR data to predict effects of coal type”.
Energy & Fuels , 6(4):414–43 (1992).
[8]Jones W. P., Lindstedt R. P. “Global reaction schemes for hydrocarbon combustion”. Combustion and Flame, 73(3):233–250 (1988).
[9]Smith I. W. “The combustion rates of coal chars: A review”. Symposium (International) on Combustion, 19(1):1045–1065 (1982).
[10]Baum M., Street P. “Predicting the Combustion Behavior of Coal Particles”. Combustion Science and Technology, 3(5):231–243 (1971).
[11]Smoot L. “A decade of combustion research”. Progress in Energy and Combustion Science (1997).
[12]Field M. “Rate of combustion of size-graded fractions of char from a low-rank
35
TEMPERATURE EFFECT ON THE ELECTRONIC PROPERTIES OF SMALL CADMIUM SULFIDE NANOCLUSTER
E Burresi1,* M Celino2 1
ENEA, Faenza Research Laboratories, Technical Unit for Faenza Material Technologies (UTTMATF) via Ravegnana, 186, Faenza, 48018, Italy;
2
ENEA, C. R. Casaccia, via Anguillarese 301, 00123 Rome, Italy *Corresponding Author: E-mail: [email protected].
Tel: 0039-0546678546. Fax: 0039-0546678575
Keywords: Ab-initio molecular dynamics, nanomaterials, cadmium sulfide, quantum dots Abstract
In this work the total and partial density of states were calculated for small single wurtzite CdS nanoparticle, quantum dots, with diameter below 2 nm, by performing DFT pseudopotentials calculations with generalized gradient approximation. The cluster was previously heated at different temperatures ranging from 100 to 600 K, by means of Car-Parrinello ab-initio molecular dynamics, finding a stable phase after 340 K. The density of states was obtained for the structures heated at 100K, 280K, 330K, 340K, 480K and 570K and substantial modifications were found after 340K, where the superficial effects cause some alterations of the intermediate electronic states around the band gap. This effect is meaningful for small particles, where the fraction of the surface atoms is larger than the fraction of the core atoms.
1) Introduction
In our previous work we focused on the behavior of the structure of small CdS nanocluster with size around 13 Å under the effect of the temperature, in the range from 100K to 600K [1]. In that context, we reported formation energy and an accurate analysis of the atomic structures after each simulation by means of distance distributions and coordination numbers. We observed that the initial hexagonal crystallographic structure bends towards an increase of bulk layer from 340 K, which involves surface structural modifications; the new structure is an equilibrated and more stable configuration at temperature T = 340K than the starting ideal atomic configuration.
The purpose of this work is to determine the density of states (total and partial DOS) for CdS quantum dots previously heated at different temperatures, in order to understand its influence on the electronic states of these nanostructures. The electronic DOS is correlated to the structural and surface modifications and the partial density of states is determined to establish the contribution of each atom.
2) Computational details
We used the generalized gradient approximation (GGA) in the DFT framework and pseudopotential approach, as implemented in the Quantum Espresso suite [2]. A plane wave cutoff energy of 30 Ry was used, and a box size of 16 Å. The ions positions have been taken from previous calculations, for different temperatures; in particular for geometry at 100K, 280K, 330K, 340K, 480K and 570K. The 100K, 280K, 330K, 340K, 480K and 570K clusters were labeled: CdS100, CdS280, CdS330, CdS340, CdS480 and CdS570, respectively. In order to perform Self Consistent Field plane-wave calculations, just gamma point was used. Martins-Trouiller type pseudopotentials for S and Cd were employed. All the simulation was performed by using 32 processors on the CRESCO infrastructure.
36
Figure 1: Views of CdS wurtzite cluster. In yellow sulphur atoms and blue cadmium atoms.
3) Results and Discussions
Figure 1 shows the CdS wurtzite structure cluster built with 96 atoms (Cluster96). The total DOS has been calculated for CdS cluster for CdS100, CdS280, CdS330, CdS340, CdS480 and CdS570 sample and for the first three structures the total DOS are reported in Figure 2.
Figure 2 Total density of states for CdS100, CdS280 and CdS330.
These types of systems have large applications like luminescent material. For this reason, we are interested in modifications of the electronic structure near the band gap. Figure 2 shows a clear band gap of size around 1eV with presence of surface states around 0.3eV, probably due to the large fraction of surface atoms. In fact for small cluster, in our case with size below 2 nm, the surface atoms prevail with respect to core atoms and either electronic structure and stability are mainly influenced by surface effects. In addition from a qualitative point of view, for energy below -0.5eV and also for energy higher than 1.5eV the density of states is structured in bands, indicating an ordered atomic structure.
Figure 3: Partial density of states (PDOS) for CdS100; in figure 3a the contributions to the electronic states of the core atoms (solid line) and surface atoms (dashed line) have been reported. In figure 3b that of the surface contribution has been decomposed in two: dashed line for atoms with coordination NC = 3 and solid black line for atoms with coordination NC = 2.
a) )
b) )
37
Figure 3a reports the contribution of all the core atoms and surface atoms, summing over all orbitals (s and p-orbitals) and all atoms, core and surface. We can see that near the band gap the surface states give a bigger contribution to the electronic states, more than core atoms, also for intermediate states around 0.3eV. In Figure 3b the surface state contribution has been split in two other sub-contributions, for atoms with NC = 3 and for atoms with NC = 2. From the figure it seems that the electronic states in this energy range suffer bigger influence by the outer atoms with low number coordination.
Above 340K a modification of the cluster structure involves the surface, and diffusion of these atoms was detected. Due to the large number of atoms localized on the surface, the cluster suffers strong modifications at the temperature T = 340K. The total density of states of CdS340, CdS480 and CdS570 has been reported in Figure 4.
Figure 4: Total density of states for CdS340, CdS480 and CdS570.
Regarding the formation energy, these two surface modifications make the cluster more stable (in particular at 340K) with a substantial energy gain. A first data interpretation is that the atomic diffusion on the surface removes the electronic intermediate states at 0.3eV obtaining higher structural stability, probably corresponding to a better optics efficiency; in practice some surface defects of the nanoparticle are removed. In addition to this favourable effect, the increase of the temperature produces new defects corresponding to the novel electronic surface states after 0.5eV. Finally, the temperature at 480K induces again a novel reconstruction of the surface and in particular the mean coordination number of surface atoms increases but in this case the shifts of the peaks have a low intensity.
4) Acknowledgments
We acknowledge the HPC team for supporting our computational activities in the ENEA-GRID infrastructure and on the CRESCO high performance platform.
38 References
[1] E.Burresi, M. Celino, Solid State Science 14, 567 (2012)
[2] P. Giannozzi, S. Baroni, N. Bonini, M. Calandra, R. Car, C. Cavazzoni, D. Ceresoli, G. L. Chiarotti, M. Cococcioni, I. Dabo, A. Dal Corso, S. Fabris, G. Fratesi, S. de Gironcoli, R. Gebauer, U. Gerstmann, C. Gougoussis, A. Kokalj, M. Lazzeri, L. Martin-Samos, N. Marzari, F. Mauri, R. Mazzarello, S. Paolini, A. Pasquarello, L. Paulatto, C. Sbraccia, S. Scandolo, G. Sclauzero, A. P. Seitsonen, A. Smogunov, P.Umari, R. M. Wentzcovitch, J. Phys.: Condens. Matter 21, 395502 (2009), http://arxiv.org/abs/0906.2569.
39
High-resolution regional climate modeling for impact studies in Africa
Sandro Calmanti, Emanuele Lombardi, Giovanna Pisacane, Maria Vittoria Struglia ENEA UTMEA-CLIM, Casaccia
Corresponding author: [email protected] Introduction
A global temperature increase of 2°C above the pre-industrial level is considered to be at a threshold between dangerous and extremely dangerous for its implied impacts on ecosystems and society [1]. The EU FP7 project IMPACT2C aims to identify and quantify the impacts and most appropriate response strategies of a 2°C global warming for Europe and three selected vulnerable regions in other parts of the world. The unit UTMEA-CLIM, ENEA Casaccia, contributes to the project with several activities including the coordination of a working group focussing on the impact of climate change in the Niger and Nile basin in Africa, and the production of dedicated high-resolution climate scenarios to be used for impact studies.
In the past, the African continent has been the target of less systematic and comprehensive studies on climate variability and change compared to other regions. To address this lack of climate information an initiative of the World Climate Research Programme (WCRP) aiming at COordinating Regional Downscaling EXperiments (the CORDEX framework) - has therefore selected Africa as the a priority target area for producing high resolution climate change scenarios [2].
The climate modeling activities conducted at ENEA within IMPACT2C have been therefore planned by following the CORDEX guidelines1 in order to contribute to investigate the hyper-matrix of uncertainties in climate projections [3]. We have produced a climate scenario simulation for the African continent by using the regional climate model RegCM4 [4], which is an update to the modeling system already adopted by UTMEA-CLIM to develop the coupled ocean-atmosphere climate model for the Mediterranean region (the PROTHEUS system) [5] and to conduct climate studies over the Euro-Mediterranean area [6][7].
Tests and performances
RegCM4 is an open source software developed and maintained by the Earth System Physics Department of ICTP2. It integrates the 3-dimensional, hydrostatic, primitive equations for the atmosphere using a rectangular grid with uniform horizontal resolution and sigma-coordinates in the vertical (i.e. the vertical coordinate is the atmospheric pressure normalized with the surface pressure). From the point of view of the code architecture the main improvement in RegCM4 with respect to previous versions is a complete re-writing of the entire code from Fortran77 to Fortran90 and a more efficient strategy for domain decomposition, plus the addition of new modules such as an advanced description of the soil and
1 CORDEX specifications can be found at http://cordex.dmi.dk
![Table 3: Comparison of MgO models. Experimental values are taken from Ref. [6].](https://thumb-eu.123doks.com/thumbv2/123dokorg/5594896.67491/57.892.81.807.905.1100/table-comparison-mgo-models-experimental-values-taken-ref.webp)