Received June 11, 2018, accepted August 7, 2018, date of publication August 29, 2018, date of current version September 21, 2018. Digital Object Identifier 10.1109/ACCESS.2018.2867110
A New Method and a Non-Invasive Device
to Estimate Anemia Based on Digital
Images of the Conjunctiva
GIOVANNI DIMAURO 1, DANILO CAIVANO1, AND FRANCESCO GIRARDI 2
1Dipartimento di Informatica, Università degli Studi di Bari Aldo Moro, 70125 Bari, Italy 2ASL Bari, 70123 Bari, Italy
Corresponding author: Giovanni Dimauro ([email protected])
ABSTRACT Medical practice for determining haemoglobin (Hb) concentration, which is important for anemic patients in need of blood transfusion, requires a blood sample. In this paper, we propose a non-invasive approach to Hb estimation based on the image analysis of a specific conjunctival region. Our goal is to develop a device that is not expensive and simple to use for assessing the anemic condition; this device could be used by the physician to decide whether to take a blood sample or even by a patient at home to decide whether to inform a physician; in this way, we can avoid having the patient go frequently to the laboratory to take a blood sample. This device also allows us to rapidly screen for Anemia in a large number of persons, for example, groups of girls who are at the beginning of the menses. Here, we detail the prototype of our device and the methodology for extracting key information from the color values of the acquired image. Tests conducted on 113 anemic and healthy persons show a strong correlation between the real Hb value obtained through blood sampling and the value estimated by our device. A k-nearest neighbor classification algorithm for assessing the (non)anemic condition yielded good results and helps doctors avoid a significant number of blood tests.
INDEX TERMS Anemia, haemoglobin, conjunctiva, non-invasive, image analysis.
I. INTRODUCTION
Anemia is a global public health problem with major consequences for human health. The World Health Organi-zation (WHO) estimates that some two billion people are anemic, which is defined as Hb concentrations that are below the recommended thresholds [1], [2].
Anemia is defined as a decrease in the red blood cells circulating in the blood or as a decrease in the concen-tration of Hb: hence, it is a reduced ability of the blood to transport oxygen. It originates mainly from nutritional factors (iron deficiency, vitamins and minerals), infectious diseases (malaria, intestinal parasites) or genetic factors (haemoglobinopathies) [3], [4]. These factors can occur in isolation but are frequently associated. Iron deficiency Ane-mia is the most common nutritional deficiency, and it causes thousands of deaths (allianceanemia.org); it is also responsi-ble for increased morbidity and mortality in pre-school chil-dren and pregnant women. In 2002, iron deficiency Anemia was considered to be among the most important contributing factors to the global burden of disease [5].
Anemia has a slow evolution: normally, no obvious symp-toms appear for Hb>9-10 g/dl, since the human body imple-ments compensatory mechanisms, such as increasing the amount of blood pumped, in such a way that the amount of oxygen released to the tissues remains almost unchanged. When the compensation can no longer guarantee an adequate dose of oxygen, symptoms such as fatigue, paleness, irri-tability, increased heart rate, insomnia, headache and many others appear. The clinical report, in most cases, is ambiguous and difficult to delineate. In addition, Anemia is often not diagnosed or adequately treated in chronic patients for whom it is an important risk factor (including mortality) and has a significant impact on the quality of life.
Regardless of its aetiology, since a severe degree of Ane-mia compromises the cell oxygen availability and causes damage that ranges from damage to vital organs to a potentially life-threatening condition, in many cases, anemic patients must be transfused based on their Hb level, which can fluctuate day by day. Anemia is assessed by measuring the level of Hb, a protein in the red blood cell that is the most
reliable indicator of Anemia, because Hb supplies oxygen to all of the cells of the body. Standard clinical methods to diagnose Anemia primarily rely on the invasive determination of blood Hb, which requires venepuncture performed by a nurse or a physician. Frequent blood sampling leads to the patient’s discomfort, and the requirement of going to a labo-ratory or calling a nurse involves considerable expense.
In fact, it is of great interest to study methods and to design instruments to monitor the concentration of Hb in a non-invasive way, with reduced costs, both in the laboratory and at the patient’s home, sometimes even daily.
Many studies show great interest in the pallor of body parts to estimate Anemia. As an example, Aggarwal et al. [6] studied the validity of palmar pallor for the diagnosis of Ane-mia among children aged 6–59 months. Tsumura et al. [7] studied skin color and texture analysis/synthesis by extracting Hb and melanin information in the skin. Additionally, [8] reports studies on the relationship between skin and Hb. Spinelli et al. [9] compared the analysis of palmar and con-junctival pallor to detect Anemia: they found that there was a greater level of sensitivity to conjunctival pallor than to pal-mar pallor. Other studies found correlations between clinical signs such as pallor to Anemia; in [10], Kalter et al show the usefulness of clinical signs in the detection of Anemia, which suggests the feasibility of adding conjunctival pallor to the Integrated Management of Childhood Illness (IMCI), a strategy designed to reduce child mortality and morbidity in developing countries. Hasan et al [11] and Wang [12], [13] present image processing of a fingertip video to investigate the relationship between the image pixel information and dif-ferent Hb (Hb) levels. Additionally, in this case, the estimate of Hb is strongly influenced by the color of the skin or by simple tanning.
For many years, physicians in common practice have esti-mated Anemia in people by observing the eyelid conjunc-tiva. This practice is still widespread in many disadvantaged areas of the earth. Observing the eyelid conjunctiva can pro-vide information for suspecting Anemia, as several studies suggested. In [14], the presence of conjunctival pallor was utilised for Hb determination, and the authors reached 95% discrimination accuracy between anemic and non-anemic patients based on an evaluation of conjunctival pallor, consid-ering a cut-off of 90 g/L for the Hb concentration. A similar approach is described in [15], but the authors stated that conjunctival pallor evaluation is strongly influenced by the observer. Indeed, the physician’s experience is crucial in this type of examination. In [9], Spinelli et al. conclude that it was still early to recommend the routine use of this tech-nique (2003); however, it could promote substantial savings if perfected. The common factor in all of the cited works is that the evaluation of conjunctival pallor is not objective, and it requires direct judgement of expert physicians. In recent years, there has been an increasing interest in the use of digital images of the palpebral conjunctiva to make a non-invasive estimate of Anemia. In the next section, we will detail related work that addresses Anemia evaluation based on digital
image processing. In Section III, we introduce our novel methodology and the new acquisition device. The results obtained with 113 patients (29 of them anemic, 84 healthy) are discussed in Section IV, and Section V presents the con-clusions of our study.
II. RELATED WORK
Non-invasive approaches are extremely important for patients who need frequent blood tests, and recent improvements in image analysis have enabled promising methodologies to be developed.
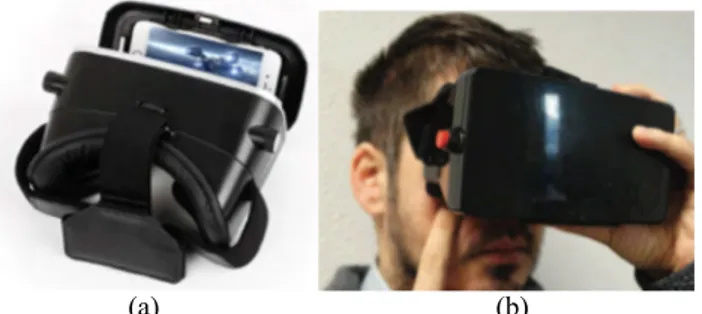
In recent years, new and interesting approaches to objec-tively correlate the eyelid color with the Hb concentration based on digital images of the palpebral conjunctiva have been proposed. As an example, in [16], Sanchez-Carrillo et al. used a colorimetric tool to compare different color shades with the conjunctiva. Hence, they achieved interesting sen-sitivity and specificity levels in screening Hb concentrations. Additionally, in [17], Suner et al analysed color features of digital images of the conjunctiva. They utilised a standard grey card with a known RGB value to compare pictures acquired under different lighting conditions. In their exper-iment, they utilised an evaluation software that ran on a Personal Digital Assistant (PDA), which considered the RGB color model and found a moderate correlation between the Hb concentration calculated in situ and the Hb concentration measured in vitro. Another very interesting study is reported in [18], where the authors use 18 possible features, including a newly added entropy feature. In [19], Chen and Miaou propose a combined approach that consists of a modified Kalman filter and penalty regression for non-invasive Anemia detection basing on the analysis of digital images of the palpebral conjunctiva, and they effectively reduce the number of suspect samples. In [20], the combination of a stochastic photon propagation model in a multi-layered human eyelid tissue and reflectance spectroscopy was used to study the spectral reflectance of palpebral conjunctiva for Hb deter-mination. The extracted Hb levels were compared with in vitro measurements of Hb; the method showed 86% sensitiv-ity estimates for clinically diagnosed Anemia cases. Unfor-tunately, the results were obtained using sophisticated and expensive clinical equipment that is not suitable for utilisation in home settings. In our previous work [21], we also estimated Hb levels using a digital image of the eyelid conjunctiva: different from [16] and [17], our approach did not require a comparative card to determine the color of the conjunctiva, due to the design of a specific device that was made of two components: the hardware and software modules (see fig. 1). The device consists of a head-mounted plastic passive viewer (similar to a Google cardboard) that solves some prob-lems, including the influence of ambient light. As evidenced, we found a moderate correlation (0.49) between a∗(CIELAB component) value of the image of the palpebral conjunctiva taken through the above device and the Hb values. Further-more, to predict the need for blood transfusion, we used a binary classifier based on a Support Vector Machine
FIGURE 1. (a) the previous acquisition device, and (b) its use.
(SVM), and the resulting indexes were 84.4% (accuracy), 82.4% (specificity) and 100% (sensitivity). The results were obtained with 77 patients (9 of them anemic, 68 healthy). In [18], the authors, citing [21], say that ‘hopefully, such a device can become popular and affordable in the future’; however, we believe that the device is still quite cumbersome and expensive for home use. The result was very encouraging, but the experiment should be extended to a larger number of patients to ascertain if that methodology can truly be used to avoid unnecessary blood transfusion or blood sampling to detect the current degree of Anemia.
Also in this paper, we evaluated the possibility of esti-mating the Hb level through a digital image of the eyelid conjunctiva. Due to the design of a new device and new software running on a common smartphone, we obtained a satisfactory result that will be detailed in the next sections.
III. THE NEW METHOD
In this section, we describe the method utilised to capture the image of a patient’s conjunctiva based on a new device that we have designed. We would like to recall that to design an effective tool for estimating the condition of Anemia through the use of digital images of the palpebral conjunctiva, the problems to be solved are the following:
• Creation of a low-cost device that is easy to use and not bulky
• Making use of the device even at home by the patient • Make the device insensitive to ambient light
• Obtain an estimate of the Anemia condition instantly • Reduce the risk of false interpretation of the condition
of Anemia to zero
• Allow remote diagnosis by the doctor or even a ‘second opinion’
The new system is shown in Fig. 2. It consists of 3 com-ponents: modified macro-lens (left), smartphone (acquisition process, center) and the software module (right).
A. THE LENS
Most likely, the most important part of the new acquisition device is the modified macro-lens shown in Fig.2 (drawing on the left) and Fig. 3a and 3b. This lens is a specific macro-lens to use with a smartphone to take high-resolution images at a reduced distance. This new lens was obtained by modifying
FIGURE 2. The new acquisition device and software (drawings from the patent application).
the Aukey PL-M1 25 mm 10x macro lens with a satin glass spacer. In the prototype that we created for experimentation, we applied LED lights around the spacer, and we isolated it with dark tape. In front of the lens, we applied a rubber ring that can be easily placed around the area of the eye to be photographed. The LED light can be powered directly from the smartphone or from a battery applied to the cover of a smartphone (in Fig.3a the power bank next to the lens was used). The lens is fixed on the plastic cover as in fig. 3b. In this way, we obtain an image acquisition device that is insensitive to the ambient light and capable of acquiring an image of the high-resolution conjunctiva as in figure 3c.
B. THE SMARTPHONE
The acquisition of the images for the purpose of the exper-iments illustrated in the following sections was conducted using 2 smartphones, an Apple iPhone 4S and a Huawei p7. We have not paid particular attention to the choice of smartphone because our ultimate goal is to make a general use system. In the future, we will study the introduction of specific parameters in the software, while the smartphones vary, if this approach allows us to increase the accuracy of the detection. The internal flash of the smartphone has been deactivated.
C. THE SOFTWARE MODULE - Hbmeter
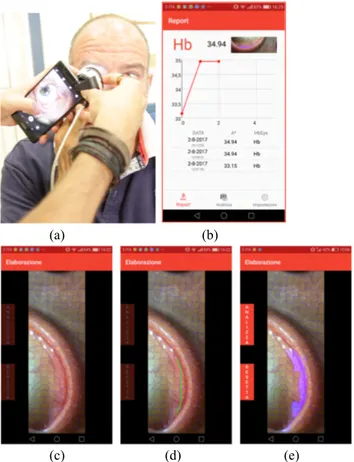
The Hbmeter software is designed and integrated into the system and is written in Java. It allows the acquisition of images of the eye, assisted selection of the conjunctiva and the calculation necessary to ascertain the condition of Ane-mia. It is designed to record the patient’s historical data, which can be consulted in both graphic and numerical form. It also includes a form for automatically sending patient data, images and indexes calculated to a doctor by email; if neces-sary, the doctor can remotely check the quality of the acquired images and the conjunctiva selections made by the patient and can evaluate the need for further tests by blood sampling and laboratory analysis. Fig. 4 shows some screenshots of the Hbmeter software.
Standard colorimetry practices require a reference element to be captured together with the subject being photographed, to extract reliable color values from a digital image. Con-versely, we designed the acquisition device to prevent exter-nal light sources, in such a way that correlation between color
FIGURE 3. The modified macro-lens and the eyelid image captured.
values and Hb concentrations could be explored without any color reference or any other per-subject calibration strategy. The patients are asked to apply the device on their face and to pull their eyelid down with their finger (or with the help of a physician or a relative); then, the picture is shot using the client application on the smartphone, which requires the LEDs to be switched on. The acquired photo is considered valid if the eyelid of the conjunctiva is largely visible. As can be seen in fig. 4d, in the Hbmeter, we designed an assisted eyelid selection module based on the SLIC superpixel algo-rithm [22], to facilitate the eyelid selection by tracing an approximate curve with a finger on the touch screen of the smartphone (see the green pixels in fig. 4d). After taking the photo the SLIC superpixel algorithm defines the boundaries of the micro-zones shown as blue meshes in Figure 4 c, d, e. In the next step, the patient can improve the above selection by eliminating/adding micro-zones that correspond to super-pixels, simply by tapping on the touch. Other studies have been conducted on the automatic selection of this region of interest [23].
The short description of the Hbmeter software that we have reported in this section has the purpose of making clear how
FIGURE 4. Screenshots of the software Hbmeter. (a,c) image acquisition; (d) eyelid assisted selection; (e) selection check; (b) estimated and historical values of the patient.
much the device can be easily used by the patient or the doctor, while the algorithms used, the dataset and the results obtained will be shown in the next sections.
IV. ESTIMATE OF THE CONDITION OF ANEMIA
In this section, we describe the methodology utilised to anal-yse the image of the patient’s conjunctiva. The analysis and results presented here are related to an offline workflow, i.e., data are processed after the acquisition phase. First, we can note that the color evaluation of the conjunctiva is performed here based on the CIE L∗a∗b∗color space. This color space describes all of the colors that are visible to the human eye mapped onto a three-dimensional integer space for a device-independent digital representation. This repre-sentation is intended to approximate human vision, i.e., the nonlinear response of the eye: uniform changes of the above components correspond to uniform changes in the perceived color, and thus, the relative perceptual differences between any two colors in L∗a∗b∗ can be approximated by treating each color as a point in a three-dimensional space (with three components: L∗, a∗, b∗) and taking the Euclidean distance between them [24]. Commonly, the three coordinates L∗, a∗, and b∗are absolute, with a pre-defined range. L∗(Lightness) represents the darkest black at L∗ = 0 and the brightest white at L∗ = 100, while a∗ and b∗ are color channels.
In (a∗, b∗) Cartesian coordinates, the origin represents neutral grey. Opponent red and green colors are represented on the a∗ axis, with red at a∗> 0 and green at a∗< 0, while opponent yellow and blue colors are represented on the b∗ axis, with yellow at b∗> 0 and blue at b∗< 0. In [21], Bevilacqua et al show that positive a∗values are fine indicators for the redness of the conjunctiva. To establish a correlation between the acquired image and the Hb values of a patient, each RGB triplet is mapped to a single numerical value that indicates the red content of the color as seen by the human eye. The original image is processed with an RGB→CIE 1976 L∗a∗b∗ color scale conversion.
As mentioned in the previous section, we developed algorithms for automatically/assisted segmenting the eyelid image, but they will be applied in a future working system to enable patient-driven, autonomous Anemia assessment. To create a gold standard dataset for the specific area of the conjunctiva to be examined, the palpebral conjunctiva of the acquired samples were manually segmented by a haematolo-gist, and the mean a∗value of the pixels in the target area was extracted. As we will explain later, the mean values of b∗and G (of the RGB components) are also calculated.
The statistical analysis was performed on data from 113 participants (63 men, 50 women) who were recruited, and they were tested after their informed consent. In par-ticular, the participants came mainly from the Hematology Departments of Istituto Tumori ‘‘Giovanni Paolo II’’ and ‘Di Venere’ Hospital (Bari, Italy) and from ‘Perrino’ Hos-pital (Brindisi, Italy). A few participants were volunteer blood donors recruited at the transfusion centre of Azienda Ospedaliera-Universitaria Policlinico di Bari. Because the color of the conjunctiva is not affected by ethnicity, lack of demographic diversity was not a concern in our study. Each subject allowed one blood sample from which the Hb (Hb) value was acquired. Simultaneously, the images of the sub-jects’ conjunctiva were acquired using the device described in the previous section.
With the aim of testing the reliability of the measurement under conditions similar to the probable working conditions, no specific data cleaning was performed at this stage. Indeed, no particular attention was paid to the photo acquisition phase. In the dataset, some conjunctivae are not perfectly in focus, and sometimes there are small shaded areas or bright spots, but most of them were eliminated by applying a simple brightness filter (see below). We were assured only that the acquired images were well illuminated (the lightness we discuss later) and that the palpebral conjunctiva was exposed as best as possible.
We base the anemic condition on a three-level evaluation scheme that considers the uncertainty or possible classifica-tion error for the samples located around the borderline sep-arating Anemia and non-Anemia. Specifically, we estimate the patient’s condition as high-risk (Hb<10.5 g/dl), doubtful (10.5< Hb < 11.5), and low-risk (Hb > 11.5), in terms of the chance of having Anemia.
After many experiments, we obtained the best classifica-tion result by considering 3 features in total, namely, a∗, b∗ and the G value extracted from the RGB component images.
Input data were filtered based on the values of L and the R,G,B components. Specifically, the mean values of the fea-tures a∗, b∗and G were calculated considering only the image pixels that showed minL< L < maxL and min < R = G = B < max (see next section). This last filtering assures that image pixels that are too dark or bright are discarded, and thus, only pixels that allow a correct pallor evaluation are considered by the system presented here. A kNN classifier and a 10-fold cross-validation test were used to estimate the risk of Anemia by means of the digital images of the conjunctive that were acquired.
V. EXPERIMENTAL RESULTS
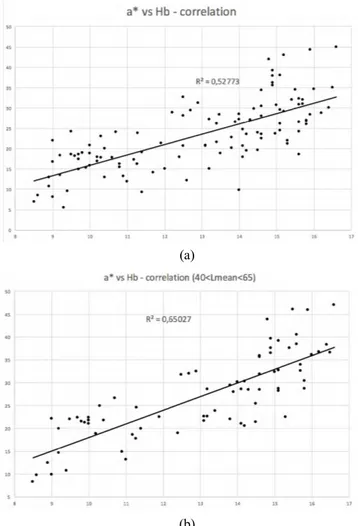
In Figure 5 (a), the relationship between the palpebral con-junctiva a∗ mean values and the measured Hb (n = 113) is reported. The Pearson Correlation Index is 0.726, which we consider to be a good result for the conditions in which the experiment was conducted and without any data clean-ing. Furthermore, we observed a significant influence of the lightness of the conjunctiva images. Indeed, the images were acquired without any specific care, then small shaded areas or some bright spots determined by the tear film present in the conjunctiva could appear. To make clear the influence of these effects on the correlation index, and therefore on the final estimate of the condition of Anemia, we performed two different experiments.
In the first experiment, we excluded from the dataset all images of palpebral conjunctiva with the mean value of L∗ outside the interval [40, 65], as determined experimentally. By limiting the L∗interval to between 40 and 65, only 74 sam-ples were considered, and the correlation index reached the maximum value of 0.806. For the whole dataset, the mean value of Hb measured in the laboratory is 12.86, and the standard deviation is 2.40, and while excluding 39 samples outside the brightness range described above, the mean and the standard deviation of Hb are 13.03 and 2.44, respectively, and thus, there is a negligible difference in the sample distri-bution. In figure 5 (b), the relationship between the palpebral conjunctival a∗mean values and the measured Hb (n = 74, 40< Lmean <65) is reported.
In the second experiment, we considered all 113 samples. In this case, the average of the a∗ component of each con-junctiva was calculated while considering only the pixels with 28 <L <82 and 16 <R = G = B <233, as deter-mined experimentally. In this way, the pixels with grey val-ues that are too dark or too light are excluded from the calculation of the average of a ∗, b ∗ and G. In this sec-ond case, the correlation is, however, increased to 0.745. Therefore, we decided to choose this second mode, which allows us to obtain excellent results based on the entire dataset.
FIGURE 5. the relationship between the palpebral conjunctival a∗and measured Hb – 113 samples (a); the same relationship with 40< Lmean <65 – 74 samples (b).
Considering the results of these two experiments, we will add to the acquisition system a module of brightness control of the acquired and selected conjunctiva, in such a way that the patient or the doctor is invited to repeat the acquisition and the selection of the conjunctiva if the average brightness of the conjunctiva image does not fall within a recommended range.
As evidenced, we found a strong correlation between the Hb values measured on the blood samples and the a∗values calculated on the images taken with the new device and the methodology presented in the previous sections.
We also measured the correlation index between the Hb values measured on the blood samples and b∗ (0.268 -weak) and the G mean values (−.490 - inverse, moderate), while considering only the pixels with 28 < L < 82 and 16 < R = G = B < 233. The correlation values among the features were a∗-b∗ = 0.259, a∗-G = −0.552 and b∗-G = −0.280.
The three features a∗, b∗ and G concur in obtaining a precise estimate of the condition of Anemia by means of a kNN classifier. Based on the estimate of the features Ga∗b∗
and the filtering image pixels as described above, we obtained the best performance that we could expect, in which false negatives=0. In fact, we specifically focused on avoiding false negatives rather than achieving the highest overall per-formance. The reason is that false positives would require healthy subjects to undergo blood testing, thus making the proposed system ineffective in some cases (and this is not a problem); in contrast, false negatives would not trigger any alerts, e.g., for subjects in need of a transfusion, thus making the system potentially harmful. The overall system perfor-mance is very good, also, as can be seen in the confusion matrix in Table 1.
TABLE 1. The confusion matrix of the classifier is shown: anemic subjects are labelled positive, while the others are labelled negative or doubtful.
The software module is not currently customised to the patient, but we expect significant performance improvements (for example, in terms of the correlation between Hb and a ∗ or other features) after adjusting the parameters for each individual patient. In addition, the conjunctiva that we used for the experiment are acquired without particular care, so much so that some are blurred, and they sometimes have shadows or some missing parts; this approach is to simulate a condition of real use by the patient, even those non-specialised in manipulating electronic tools to capture images. We expect further performance improvements by customising the parameters based on the gender and age of the patients.
VI. CONCLUSION
In this paper, a new method and a non-invasive device to estimate Anemia based on digital images of the conjunctiva have been presented. A new device for the acquisition of a subject’s conjunctiva that is not expensive and simple to use was constructed. Image processing in the CIELAB color space was utilised to correlate the a∗value of the conjunctiva areas and Haemoglobin values. Our results were achieved without any sample selection based on clinical conditions and the participants’ gender. To avoid unnecessary blood sampling, a kNN classifier was set up to determine whether a subject needs a transfusion or at least attention from a physician. The results obtained could considerably reduce the number of candidate subjects for blood sampling because the assessment could be performed by simply considering the a∗, b∗ and G values but also highlighting the state of Anemia of people at risk, such as girls in their menses period. Moreover, because Anemia involves more than one clinical symptoms, such as increased heart rate or reduction of blood
pressure (which can be detected using currently available non-invasive devices), the results provided by our system could be utilised together with the data coming from other examinations to further reduce the number of patients who are required to undergo blood sampling. In our work, the kNN classifier was tested on 113 cases; we are collecting more data to test the performance of the classifier on a larger number of people and in a short time will start screening girls in middle school.
In addition, future development will include an investiga-tion of methods for automatic discarding of images that are not suitable for this analysis, (i.e., due to eye irritation or to acquisition error) based also on lightness evaluation. This acquisition system can be used without the need for a physi-cian. As a result, patients will be able to autonomously realise the examination using their mobile phones and to obtain results immediately.
The full automatic segmentation of eyelid image needs further research, while manual segmentation and assisted seg-mentation of eyelid image described in section III both allow to get good results. Of course risks can arise from an incorrect segmentation. For this reason, the system provides for the automatic sending of data to the specialist who can perform a remote verification. It should however be kept in mind that the intended use of our system is mainly for extended screening (and therefore guided by specialized personnel) and to monitor patients who have overt diseases. Therefore, it is possible to instruct them to the correct use of the device and then mitigate risks.
REFERENCES
[1] Assessing the Iron Status of Populations, World Health Org., Geneva, Switzerland, 2004.
[2] World Health Organization, Worldwide Prevalence of Anaemia
1993-2005: WHO Global Database on Anaemia, B. de Benoist, E. McLean, I. Egli, and M. Cogswell, Eds. Geneva, Switzerland: World Health Organi-zation, 2008.
[3] E. McLean, M. Cogswell, I. Egli, D. Wojdyla, and B. de Benoist, ‘‘World-wide prevalence of anaemia, WHO vitamin and mineral nutrition infor-mation system, 1993-2005,’’ Public Health Nutrition, vol. 12, no. 4, pp. 444–454, 2009.
[4] World Health Organization, ‘‘Iron deficiency anaemia: Assessment, prevention and control—A guide for programme managers,’’ WHO Reference WHO/NHD/01.3, 2001. [Online]. Available: http://www. who.int/nutrition/topics/ida/en/
[5] The World Health Report 2002: Reducing Risks, Promoting Healthy Life, World Health Org., Geneva, Switzerland, 2002.
[6] A. K. Aggarwal, ‘‘Validity of palmar pallor for diagnosis of anemia among children aged 6–59 months in North India,’’ Anemia, vol. 2014, Nov. 2014, Art. no. 543860. [Online]. Available: https://www.ncbi.nlm.nih.gov/pmc/articles/PMC4241719/
[7] N. Tsumura et al., ‘‘Image-based skin color and texture analysis/synthesis by extracting hemoglobin and melanin information in the skin,’’ ACM
Trans. Graph., vol. 22, no. 3, pp. 770–779, 2003.
[8] E. Angelopoulou, ‘‘Understanding the color of human skin,’’ Proc.
SPIE, vol. 4299, pp. 243–251, Jun. 2001. [Online]. Available: https://www.spiedigitallibrary.org/conference-proceedings-of-spie/4299/ 0000/Understanding-the-color-of-human-skin/10.1117/12.429495.short? SSO=1
[9] M. G. N. Spinelli, J. M. P. Souza, S. B. de Souza, and E. H. Sesoko, ‘‘Reliability and validity of palmar and conjunctival pallor for anemia detection purposes,’’ Rev. Saude Publica, vol. 37, no. 4, pp. 404–408, 2003.
[10] H. Kalter et al., ‘‘Evaluation of clinical signs to diagnose anaemia in uganda and Bangladesh, in areas with and without malaria,’’ Bull. World
Health Org., vol. 75, no. 1, p. 103, 1997.
[11] M. K. Hasan, N. Sakib, R. R. Love, and S. I. Ahamed, ‘‘RGB pixel analysis of fingertip video image captured from sickle cell patient with low and high level of hemoglobin,’’ in Proc. IEEE 8th Annu. Ubiquitous Comput.,
Electron. Mobile Commun. Conf. (UEMCON), Oct. 2017, pp. 499–505, doi:10.1109/UEMCON.2017.8249004.
[12] E. J. Wang, W. Li, D. Hawkins, T. Gernsheimer, C. Norby-Slycord, and S. N. Patel, ‘‘HemaApp: Noninvasive blood screening of hemoglobin using smartphone cameras,’’ in Proc. ACM Int. Joint Conf. Pervasive Ubiquitous
Comput. (UbiComp), 2016, pp. 593–604, doi:10.1145/2971648.2971653. [13] E. J. Wang, W. Li, J. Zhu, R. Rana, and S. N. Patel, ‘‘Noninvasive hemoglobin measurement using unmodified smartphone camera and white flash,’’ in Proc. 39th Annu. Int. Conf. IEEE Eng. Med. Biol. Soc. (EMBC), Seogwipo, South Korea, Jul. 2017, pp. 2333–2336, doi:10.1109/EMBC. 2017.8037323.
[14] T. N. Sheth, N. K. Choudhry, M. Bowes, and A. S. Detsky, ‘‘The relation of conjunctival pallor to the presence of anemia,’’ J. Gen. Internal Med., vol. 12, no. 2, pp. 102–106, 1997.
[15] R. M. D. Silva and C. A. Machado, ‘‘Clinical evaluation of the paleness: Agreement between observers and comparison with hemoglobin levels,’’
Rev. Brasileira Hematol. Hemoterapia, vol. 32, no. 6, pp. 444–448, 2010. [16] C. I. Sanchez-Carrillo, T. de Jesus Ramirez-Sanchez, and B. J. Selwyn, ‘‘Test of a noninvasive instrument for measuring hemoglobin concentra-tion,’’ Int. J. Technol. Assessment Health Care, vol. 5, no. 4, pp. 659–667, 1989.
[17] S. Suner, G. Crawford, J. McMurdy, and G. Jay, ‘‘Non-invasive determi-nation of hemoglobin by digital photography of palpebral conjunctiva,’’
J. Emerg. Med., vol. 33, no. 2, pp. 105–111, 2007.
[18] Y.-M. Chen, S.-G. Miaou, and H. Bian, ‘‘Examining palpebral conjunctiva for anemia assessment with image processing methods,’’ Comput.
Meth-ods Programs Biomed., vol. 137, pp. 125–135, Dec. 2016, doi:10.1016/ j.cmpb.2016.08.025.
[19] Y.-M. Chen and S.-G. Miaou, ‘‘A Kalman filtering and nonlinear penalty regression approach for noninvasive anemia detection with palpebral conjunctiva images,’’ J. Healthcare Eng., vol. 2017, Jul. 2017, Art. no. 9580385. [Online]. Available: https://www.hindawi.com/ journals/jhe/2017/9580385/cta/, doi:10.1155/2017/9580385.
[20] O. Kim, J. McMurdy, G. Jay, C. Lines, G. Crawford, and M. Alber, ‘‘Combined reflectance spectroscopy and stochastic modeling approach for noninvasive hemoglobin determination via palpebral conjunctiva,’’
Physiol. Rep., vol. 2, no. 1, p. e00192, 2014.
[21] V. Bevilacqua et al., ‘‘A novel approach to evaluate blood param-eters using computer vision techniques,’’ in Proc. IEEE Int. Symp.
Med. Meas. Appl. (MeMeA), Benevento, Italy, May 2016, pp. 1–6, doi:10.1109/MeMeA.2016.7533760.
[22] R. Achanta, A. Shaji, K. Smith, A. Lucchi, P. Fua, and S. Susstrunk, ‘‘SLIC superpixels compared to state-of-the-art superpixel methods,’’ IEEE Trans.
Pattern Anal. Mach. Intell., vol. 34, no. 11, pp. 2274–2282, Nov. 2012, doi:10.1109/TPAMI.2012.120.
[23] G. Dimauro et al., ‘‘Automatic segmentation of relevant sections of the conjunctiva for non-invasive anemia detection,’’ in Proc.
3rd Int. Conf. Smart Sustain. Technol., to be published. [Online]. Available: http://2018.splitech.org/wp-content/uploads/2017/09/ preliminary_program.pdf and http://2018.splitech.org/
[24] A. K. Jain, Fundamentals of Digital Image Processing. Upper Saddle River, NJ, USA: Prentice-Hall, 1989, p. 68.
GIOVANNI DIMAURO was born in Taranto, Italy, in 1964. He received the Laurea degree in computer sciences from the Università degli Studi di Bari Aldo Moro in 1987. He is currently an Associate Professor of computer programming, multimedia systems, and cooperative systems with the Università degli Studi di Bari Aldo Moro. His research activities, described in over 150 papers published in scientific journals, proceedings, and books, are currently on e-health, multimedia sys-tems, and pattern recognition with applications in medicine such as new diagnosis technology for anemia and in Parkinson disease.
DANILO CAIVANO graduated in informatics from the Università degli Studi di Bari Aldo Moro and received the Ph.D. degree from the Università degli Studi di Bari Aldo Moro. He has been an Assistant Professor with the Università degli Studi di Bari Aldo Moro since 2002. Since 2007, he has been a Chief Executive Officer of SER&Practices (www.serandp.com), a spinoff company of the Università degli Studi di Bari Aldo Moro, that he has contributed to startup. He carries out his research in the Software Engineering Laboratory, Department of Informatics. He is actively involved in the Project Management Institute–Southern Italy Chapter and in the International Software Engineering Research Network. His research and teaching activities focus on topics related to software engineering with emphasis on project and process management in collocated and distributed contexts and on software development, maintenance, and testing.
FRANCESCO GIRARDI was born in Bari, Italy, in 1962. He received the degree in medicine and surgery from the Università degli Studi di Bari Aldo Moro in 1986, where three years later he specialized in general haematology, and the bach-elor’s degree in computer science in 2013. Since 2013, he has been cooperating with the Computer Science Department, Università degli Studi di Bari Aldo Moro, and with the Electric and Electronic Engineer Department, Polytechnic University of Bari. Currently he is with (ASL) Azienda Sanitaria Locale di Bari, Italy. His research activities are currently on the e-health field.