Ricerca Sistema Elettrico ADPFISS – LP2 – 113 L
1 31 Titolo
TRIDIMENSIONAL ANALYSIS OF LOCAL PERTURBATIONS ON THE
CORE REACTIVITY AND THE THERMAL-HYDRAULICS OF THE FUEL
ELEMENTS
Descrittori
Tipologia del documento: Rapporto Tecnico
Collocazione contrattuale: Accordo di programma ENEA-MiSE su sicurezza nucleare e reattori di IV generazione
Argomenti trattati: Reattori nucleari veloci, Neutronica, Termoidraulica dei reattori nucleari Sommario
Questo documento riassume il lavoro svolto per il primo obiettivo della task A.1 della Linea Progettuale 2 dell’Accordo di Programma tra ENEA e MiSE (AdP PAR2015 LP2 A.1_a). Utilizzando come riferimento la configurazione del nocciolo di ALFRED (Advanced Lead Fast Reactor European Demonstrator) riveduta ed analizzata nell’ambito del precedente piano triennale dell’AdP (PAR 2012-2014), si è esteso lo studio all’analisi di fenomeni locali di perturbazione durante il normale funzionamento di impianto. La perturbazione locale esaminata è rappresentata dalla estrazione spuria della barra di controllo con maggiore importanza (anti-reattività) che, nella simmetria del nocciolo, è adiacente all’elemento di combustibile più caldo della zona esterna. I modelli di analisi dei codici di neutronica e termoidraulica sono stati adattati in modo da riprodurre fedelmente la configurazione alterata del sistema valutando: - dal punto di vista neutronico, l’impatto della perturbazione locale sia sull’intero nocciolo (in
termini di reattività e di distribuzione di potenza globale nel nocciolo), sia sull’elemento di combustibile adiacente alla posizione ove la perturbazione ha avuto luogo (in termini di distribuzione potenza locale nell’elemento stesso);
- dal punto di vista termoidraulico, l’impatto sulla distribuzione delle temperature nei diversi sotto-canali dell’elemento più caldo e nella barretta più sollecitata di quest’ultimo, a partire dalle informazioni ricavate dalle analisi neutronica e di transitorio.
L’obiettivo principale del presente studio è la valutazione delle nuove condizioni termiche degli elementi di combustibile al fine di verificare il rispetto dei limiti di sicurezza nella nuova configurazione perturbata, o la protezione degli elementi per un eventuale intervento del sistema di protezione del reattore prima del raggiungimento del limite assunto.
Autori: M. Sarotto(1), G. Grasso(1), F. Lodi(2), G. Bandini(1), M. Sumini(2) (1) ENEA (2) UniBo Copia n. In carico a:
2
NOME FIRMA1
NOME FIRMA0
EMISSIONE 20/09/16 NOME M. Sarotto M. Tarantino M. TarantinoFIRMA
Ricerca Sistema Elettrico ADPFISS – LP2 – 113 0 R 2 31
TABLE OF CONTENTS
Acronyms and Abbreviations ... 3
1 Introduction ... 4
2 ALFRED FA/core design and neutronic model... 5
3 Local perturbation: main hypotheses ... 7
4 Neutronic analysis ... 9 4.1 Tools ... 9 4.2 Results ... 9 5 Transient analysis... 17 6 Thermal-Hydraulic analysis ... 20 6.1 Tools ... 20
6.2 Results in steady state conditions ... 21
6.3 Results in UTOP conditions ... 22
7 Concluding remarks ... 25
References ... 27
Ricerca Sistema Elettrico ADPFISS – LP2 – 113 0 R 3 31
Acronyms and Abbreviations
ALFRED Advanced Lead Fast Reactor European Demonstrator BAF Bottom of Active Fuel
BoC Beginning of Cycle BoL Beginning of Life CR Control Rod
ERANOS European Reactor ANalysis Optimised System EoC End of Cycle
FA Fuel Assembly
FALCON FOstering ALfred CONstruction FP Framework Program
GIF Generation IV International Forum keff Effective multiplication factor
LEADER Lead-cooled European Advanced DEmonstration Reactor LFR Lead Fast Reactor
MOX Mixed Oxide
OMPD Operation Monitoring and Protection Detection pcm per cent mille
rgb red green blue SR Safety Rod T Temperature TAF Top of Active Fuel TH Thermal-Hydraulic
Ricerca Sistema Elettrico ADPFISS – LP2 – 113 0 R 4 31
1
Introduction
This work represents a continuation of the national and international efforts for the development of the Advanced Lead Fast Reactor European Demonstrator (ALFRED), whose design was initially conceived in the Lead-cooled European Advanced DEmonstration Reactor (LEADER) project of the 7th EURATOM Framework Program (FP7) [1] and now carried on by the International Consortium FALCON (FOstering ALfred CONstruction), signed by Ansaldo Nucleare and ENEA (Italy), RATEN-ICN (Romania) and CVR (Czech Republic). By adopting as leading criteria the ambitious concepts expressed by the Generation IV International Forum (GIF), the Lead Fast Reactor (LFR) could represent a promising technology for a new generation of nuclear energy systems more safe, clean, economical and proliferation resistant [2]. The ALFRED core design (300 MW thermal) was successively refined in the last two years of the Programmatic Agreement (Accordo di Programma, AdP) between ENEA and MiSE (Ministero dello Sviluppo Economico), by establishing a new reference design in which some revealed criticalities were corrected [3-4].
This technical report deals with the analysis of the local effect due to perturbation phenomena potentially occurring during the nominal plant conditions. By referring to the updated design of the ALFRED Fuel Assembly (FA) and core layout (§2), the perturbation investigated was represented by the accidental extraction of the Control Rod (CR) having the highest anti-reactivity worth (§3). The impact on the core neutronics was evaluated in terms of anti-reactivity balance and power distribution among FAs with the ERANOS deterministic code [5] (§4). Furthermore, the distortion of the local power distribution in the hottest FA was evaluated at the level of detail of the single pin, by adopting the procedure summarily described in Appendix A. The steady state neutronic results were then used as input for accurate transient and Thermal-Hydraulic (TH) analyses made by:
the RELAP5 system code [6], to investigate the evolution of the worst conceivable scenario due to the spurious extraction of a single CR, that is assuming the CR withdrawal is un-adverted and the scram (i.e., reactor shutdown) is not called upon by the reactor protection system; therefore, the reactivity-initiated transient (triggered by the CR withdrawal itself) evolves freely in what is called an Unprotected Transient of Over-Power (UTOP) (§5);
the ANTEO+ sub-channel code [7], to evaluate the Temperature (T) distributions in all the pins and surrounding sub-channels of the hottest FA, in steady state and at key instants of the transient (§6).
The main objective was the assessment of the new thermal conditions of the hottest FA in order to verify the compliance with the safety limits even in the perturbed condition or, alternatively, the capability of the monitoring system to detect the abnormal condition in time to trigger the actuation of the reactor protection system before the assumed limit is approached. In the present study, the safety limit assumed is represented by the melting T of the Mixed OXide (MOX) fuel, which is approximately 2800 °C, though varying with plutonium content and burn-up.
Ricerca Sistema Elettrico ADPFISS – LP2 – 113 0 R 5 31
2
ALFRED FA/core design and neutronic model
Figure 2.1 depicts some details of the ALFRED fuel pin and FA design. The wrapped hexagonal FA is made of 126 MOX fuel pins arranged in six rows (of the triangular lattice), while the central pin is structural (i.e., an empty clad).
Figure 2.1 ALFRED FA (left) and fuel pin (right) design [mm].
Figure 2.2 shows a quarter of the core layout - as taken from [1] - having a 90° symmetry. The layout, successively refined in [3-4], is essentially made of:
57 / 114 inner / outer FAs, respectively, having the same architecture but a different Pu enrichment in the MOX pellet;
4 Safety Rods (SRs) located in the centre of the core, which stay still atop the fissile zone during normal operation and enter the core for scram by gravity (ballast driven and pneumatically boosted);
12 CRs evenly positioned halfway in the outer fuel zone; the bank partly enters the active region from the bottom during irradiation to compensate the initial over-criticality and is progressively withdrawn as far as the refuelling condition is approached;
the surrounding dummy assemblies, having the same structure of the FA but with pins filled by YZrO insulator pellets, thereby serving as reflector for both neutron economy and protection of the inner vessel.
Ricerca Sistema Elettrico ADPFISS – LP2 – 113 0 R 6 31
Figure 2.2 ALFRED core layout (90° symmetry).
The neutronic core model (with the ERANOS code, §4.1) was completed by introducing some special assemblies used to simulate the structures surrounding the core at a distance that cannot be neglected for the results accuracy. In some details:
72 assemblies made by an homogeneous mix of steel (33.8%) and Pb (66.2%) were introduced to simulate the inner vessel and the surrounding coolant;
other external “virtual” assemblies made by Pb only were introduced to simulate the coolant outside the inner vessel.
Ricerca Sistema Elettrico ADPFISS – LP2 – 113 0 R 7 31
3
Local perturbation: main hypotheses
As described in [1], the ALFRED fuel cycle is 5 years long (at full-power irradiation), being also the in-pile residence time for the FAs. In order to reduce the initial Pu enrichment, as well as the criticality swing during an irradiation cycle, a reloading scheme made of 5 batches is adopted. Moreover, no reshuffling of the FAs is considered at refuelling and, in the one-year irradiation sub-cycle, the reactivity is tuned by the 12 CRs (Figure 2.2). As shown in Figure 3.1:
at the Beginning of Cycle (BoC) of each sub-cycle the CRs are at their maximum operative insertion into the fissile zone; this position does not represent the complete insertion, so that the anti-reactivity margin left (by the remaining part of the CR absorbing bundle which is withdrawn) can be exploited for scram;
at the End of Cycle (EoC) of each sub-cycle the CRs are completely withdrawn, so that the axial position of their absorbing part is located 4 cm below the fissile zone.
The local perturbation examined is represented by the extraction of the CR having the highest importance; this one, for the symmetry of the core and its design, is adjacent to the hottest FA in
the outer zone (see Figure 2.2). Referring to the layout of the ALFRED core fissile zone depicted
in Figure A.2 in Appendix A, the neutronic simulations were performed by extracting the CR in position 34 24: the corresponding hottest adjacent FA in the outer zone results in position 33 25. For a better comprehension, Figure 3.2 sketches the portion of the core layout investigated for the local perturbation analyses.
The impact of the CR accidentally withdrawn - in terms of reactivity effect and distortion of the core power distribution – was evaluated at BoC, that is the moment during operation when the 12 CRs are actually inserted the most into the fissile zone. Then, the CR in position 34 24 (see Figure 3.2) is withdrawn down to the EoC position while the other (11) CRs are maintained in the BoC one.
In this study, two perturbed core conditions were examined:
the “Pert” condition, in which the accidentally withdrawn CR is completely extracted and its absorbing part results 4 cm below the fissile zone (i.e., as at EoC: see Figure 3.1);
the “Pert-half” condition, in which the accidentally withdrawn CR is still inserted in fissile zone halfway between the BoC and EoC axial positions.
For easiness, the impact on core neutronics of such event - in terms of reactivity and power distributions - was evaluated with fresh fuel compositions in the whole core, i.e., fuel at Beginning of Life (BoL). This assumption anyway results conservative, being the importance of the outer FAs – the ones adjacent to the CRs – higher at BoL than at BoC1.
1 A higher importance of the outer FAs implies a higher neutron flux in these, because of an over-estimation (at BoL) of the power actually developed by a core with partially burnt fuel (at BoC).
Ricerca Sistema Elettrico ADPFISS – LP2 – 113 0 R 8 31
Figure 3.1 Axial position of the CR absorbing bundle relative to the fissile core (not in scale) at BoC (left frame) and EoC (right frame).
Figure 3.2 Portion of the ALFRED core layout investigated for the local perturbation analyses.
EoC
BoC
Fuel CR Fuel CRFA Inner zone
FA Outer
zone
Ricerca Sistema Elettrico ADPFISS – LP2 – 113 0 R 9 31
4
Neutronic analysis
4.1 Tools
The neutronic analyses were carried out with the ERANOS (European Reactor ANalysis Optimised System) ver. 2.2 deterministic code [5] coupled with the JEFF3.1 nuclear data library [8]. The macroscopic cross-sections of the different core regions were produced in a 1968 energy-group-structure and condensed to the standard one at 33 groups by ECCO (European Cell COde) [9]. The macroscopic cross-sections were then used for full core calculations carried out with the TGV/VARIANT module [10], by adopting the variational nodal method in a 3D hexagonal geometry model of the core.
As briefly described in Appendix A, by exploiting the ECCO cell results obtained with a 2D hexagonal geometry model of the FA2 and by super-imposing on them the shape of the flux in the core (through an interpolation process with a fortran90 routine), the power distribution inside of the FA closest to the accidentally withdrawn CR was accurately evaluated at the level of single pins. The core “global” and FA “local” power distributions:
are shown in §4.2, also in graphical forms through a script made by the python programming language;
are used as input parameters for the transient and TH analyses reported in §5 and §6.
4.2 Results
Starting from the BoC nominal state, the variation of the effective multiplication factor (keff) was
evaluated in the “Pert-half” and “Pert” perturbed core conditions (§3). Table 4.1 reports the corresponding keff results expressed in per cent mille (pcm), together with the keff value
obtained with all the 12 CRs completely withdrawn (as at EoC). These values were calculated with the fuel at BoL (§3): the complete extraction of one CR causes a +222 pcm keff.
Table 4.2 reports the power deposited in nominal full power conditions into the fissile zone, the average and hottest FAs. The average FA power was evaluated in the whole core (by definition), but also in the inner and outer zones separately. The bold characters in the last three columns of Table 4.1 indicate that the hot FA belongs to the inner zone in the BoC and “Pert-half” conditions (in the central position 30 30, see Figure A.2), while it belongs to the outer zone in the “Pert” and EoC conditions. In the outer zone, the maximum FA power occurs (see Figures A.2 and 3.2):
in position 33 25 in the “Pert-half” and “Pert” core conditions;
in position 35 27 at BoC and EoC.
Nevertheless, in order to evaluate the distortion of the power distribution in the hot FA in perturbed conditions, the local power distribution was considered in the FA 33 25 even at BoC and EoC (also because the differences between the power values in FA 33 25 and FA 35 27 are almost negligible).
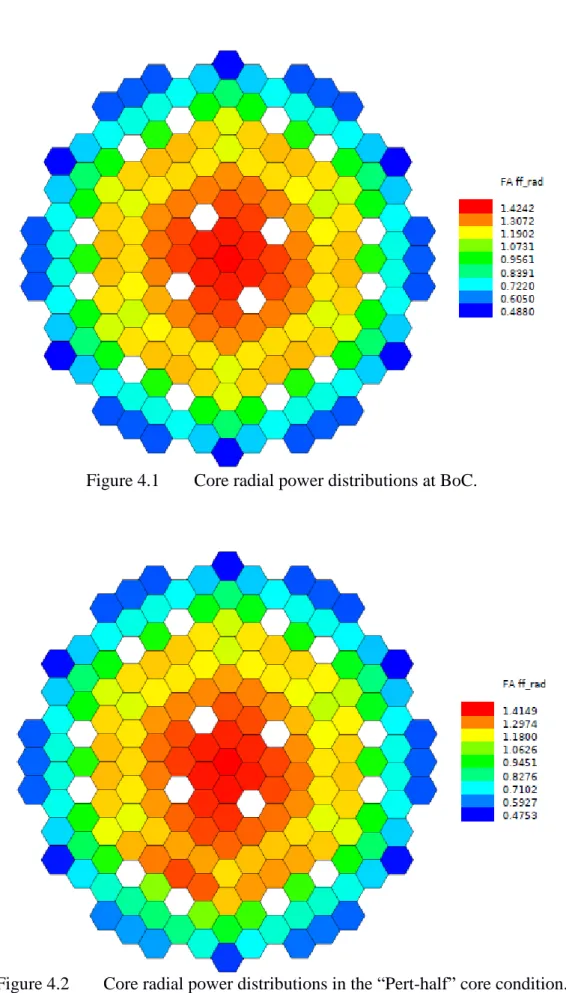
Figures 4.1-4.4 report the radial core power distributions in the four core conditions examined: the “ff_rad” values indicate the power distribution factors of every FA in a red green blue (rgb) scale. Congruently with Table 4.2, Figures 4.1-4.4 indicate that the hot FA belongs to the inner zone in the BoC and “Pert-half” conditions, while it belongs to the outer zone in the “Pert” and EoC ones.
2 The ECCO geometry model describes the horizontal section of the FA at the level of pin (and wrapper, see Figure 2.1), while axial leakages are taken into account by tuning the buckling value [9].
Ricerca Sistema Elettrico ADPFISS – LP2 – 113 0 R 10 31
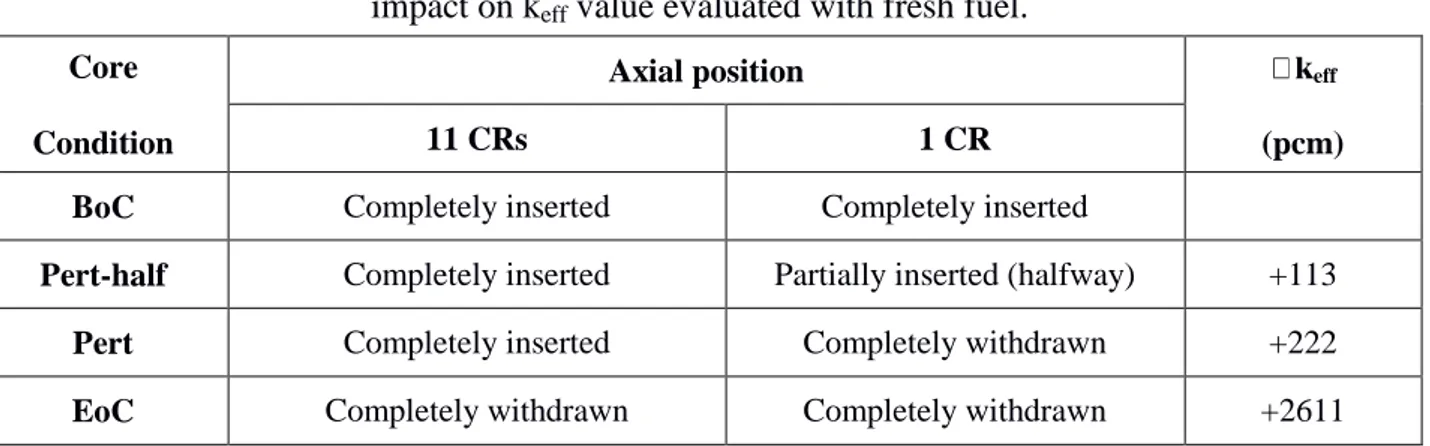
Table 4.1 Core conditions examined for local perturbation analyses (1 CR withdrawal): impact on keff value evaluated with fresh fuel.
Core Condition
Axial position eff
(pcm)
11 CRs 1 CR
BoC Completely inserted Completely inserted
Pert-half Completely inserted Partially inserted (halfway) +113
Pert Completely inserted Completely withdrawn +222
EoC Completely withdrawn Completely withdrawn +2611
Table 4.2 Power deposited into the fissile zone, the average and hottest FAs (in the whole core, as well as in the inner and outer zones separately).
Core Condition
Pth fissile [MW] Ave FA Pth [MW] Hot FA Pth [MW]
Inner 57 FA Outer 114 FA Core 171 FA
Inner Outer Core Inner
30 30 Outer 33 25 (35 27) Core BoC 125.25 168.37 293.62 2.197 1.477 1.717 2.446 2.150 (2.151) 2.446 Pert-half 124.76 168.87 293.63 2.189 1.481 1.717 2.430 2.319 2.430 Pert 124.27 169.38 293.65 2.180 1.486 1.717 2.413 2.479 2.479 EoC 112.17 181.87 294.04 1.968 1.595 1.720 2.044 2.185 (2.186) 2.185 (2.186)
Ricerca Sistema Elettrico ADPFISS – LP2 – 113 0 R 11 31
Figure 4.1 Core radial power distributions at BoC.
Ricerca Sistema Elettrico ADPFISS – LP2 – 113 0 R 12 31
Figure 4.3 Core radial power distributions in the “Pert” core condition.
Ricerca Sistema Elettrico ADPFISS – LP2 – 113 0 R 13 31
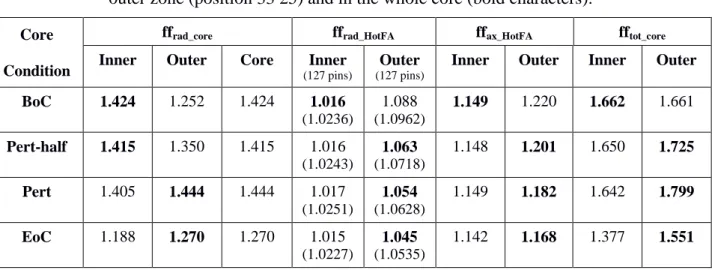
Table 4.3 reports the radial, axial and total power peaking factor values: namely “ffrad_core”,
“ffrad_HotFA”, “ffax_HotFA” and “fftot_core” (with: fftot_core = ffrad_core * ffrad_HotFA * ffax_HotFA). The radial
power distribution among the FAs was evaluated in the inner and outer zones separately: trivially, the highest values indicated by bold characters represent the “ffrad_core” peaking factor.
Congruently with Figures 4.1-4.4, the “ffrad_core” values reported in Table 4.3 coincide with the
maximum “ff_rad” ones reported in the same Figures3
.
Table 4.3 Radial, axial and total power peaking factors in the inner zone (position 30 30), outer zone (position 33 25) and in the whole core (bold characters).
Core Condition
ffrad_core ffrad_HotFA ffax_HotFA fftot_core
Inner Outer Core Inner
(127 pins)
Outer
(127 pins)
Inner Outer Inner Outer
BoC 1.424 1.252 1.424 1.016 (1.0236) 1.088 (1.0962) 1.149 1.220 1.662 1.661 Pert-half 1.415 1.350 1.415 1.016 (1.0243) 1.063 (1.0718) 1.148 1.201 1.650 1.725 Pert 1.405 1.444 1.444 1.017 (1.0251) 1.054 (1.0628) 1.149 1.182 1.642 1.799 EoC 1.188 1.270 1.270 1.015 (1.0227) 1.045 (1.0535) 1.142 1.168 1.377 1.551
For what concerns the radial distribution factors among the pins in the hot FA (ffrad_HotFA,
evaluated in the inner and outer zones separately), a couple of values are reported in Table 4.3:
the first one represents the factor among the 126 fuel pins and it was used to evaluate the total form factor (last columns in Table 4.3), representing the factor of proportionality between the average and maximum linear power values, which are reported in Table 4.4;
the second one indicated in brackets represents the factor among 127 pins (i.e., by considering also the central structural one, §2) and it was used for the TH analyses (§6).
As indicated by the bold characters in Table 4.3, the maximum value of the total form factor (and correspondingly the highest linear power values in the hottest pin reported in Table 4.4) occurs in the inner zone (position 30 30) only at BoC. In the other core conditions (“Pert-half”, “Pert” and EoC), the hottest pin belongs to the outer zone (position 33 25) close to the CR accidentally withdrawn (see Figure 3.2).
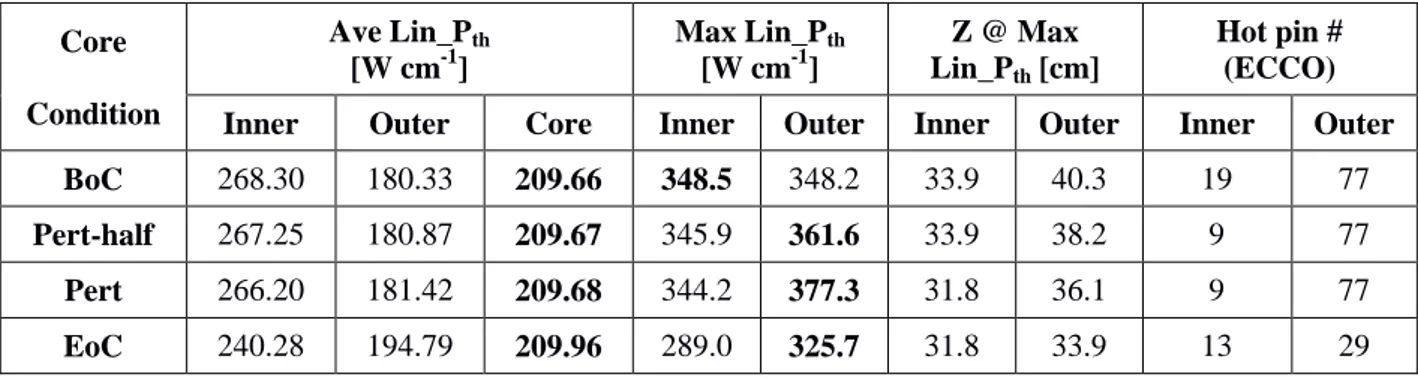
Besides the maximum and average linear power values (in the whole core, inner and outer zones separately), Table 4.4 reports the axial quote (starting from the bottom of fissile zone) at which the highest linear powers occur and the identification of the hottest pin using the numbering conventionally adopted by the ECCO cell code (see Figure A.1 in Appendix A). It can be noticed that, as expected:
in the outer FA (position 33 25) the z coordinate tends to decrease with the CR withdrawal;
the hottest pin in the inner zone (position 30 30) is close to the centre of the FA, while the hottest pin in the outer zone (position 33 25) is in the pre-last row toward the FA periphery (pointing to the core centre).
3 .A negligible differences appear at EoC (1.271 in Figure 4.4 vs. 1.270 in Table 4.3) since, actually (as in Table 4.2), the maximum FA power in the outer zone is deposited in position 35 27 (ffrad_core = 1.271), while the value reported in Table 4.3 (1.270) refers to the position 33 25 where the hottest pin is located.
Ricerca Sistema Elettrico ADPFISS – LP2 – 113 0 R 14 31
Table 4.4 Average and maximum linear power values (in the whole core, inner and outer zones), axial quote at which the highest values occur and hot pin numbering (in ECCO scheme).
Core Condition Ave Lin_Pth [W cm-1] Max Lin_Pth [W cm-1] Z @ Max Lin_Pth [cm] Hot pin # (ECCO)
Inner Outer Core Inner Outer Inner Outer Inner Outer
BoC 268.30 180.33 209.66 348.5 348.2 33.9 40.3 19 77
Pert-half 267.25 180.87 209.67 345.9 361.6 33.9 38.2 9 77
Pert 266.20 181.42 209.68 344.2 377.3 31.8 36.1 9 77
EoC 240.28 194.79 209.96 289.0 325.7 31.8 33.9 13 29
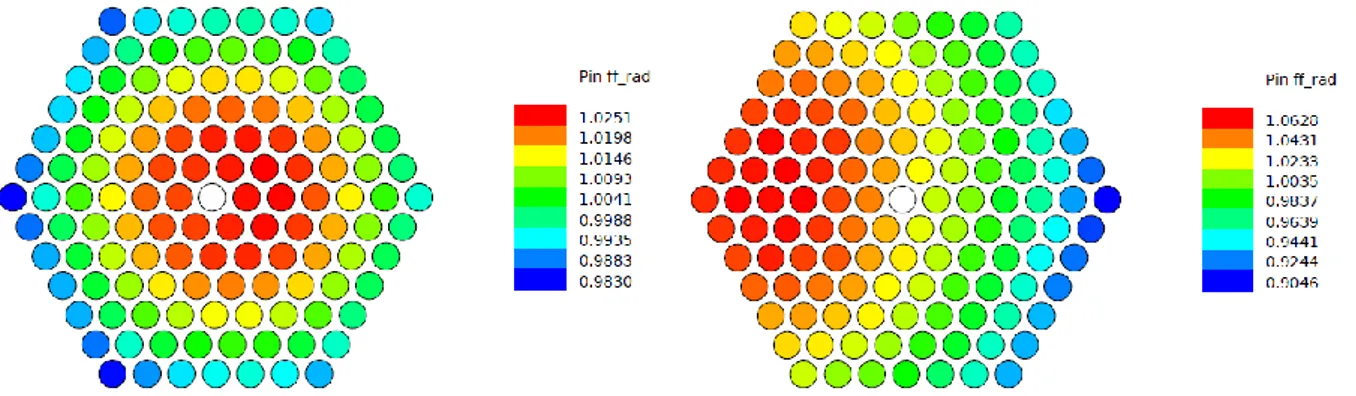
Figures 4.5-4.8 show the pin power distributions through the values of the radial peaking factors “ff_rad” for each pin in the FA positions 30 30 (inner zone) and 33 25 (outer zone). These distributions were used as input for the ANTEO+ TH analyses (§6): the highest values correspond to the ffrad_HotFA factors evaluated among 127 pins and reported in brackets in Table
4.3.
Figure 4.5 Radial peaking factors for each pin in the FA positions 30 30 (inner core, left frame) and 33 25 (outer core, right frame) in the BoC core conditions.
Figure 4.6 Radial peaking factors for each pin in the FA positions 30 30 (inner core, left frame) and 33 25 (outer core, right frame) in the “Pert-half” core conditions.
Ricerca Sistema Elettrico ADPFISS – LP2 – 113 0 R 15 31
Figure 4.7 Radial peaking factors for each pin in the FA positions 30 30 (inner core, left frame) and 33 25 (outer core, right frame) in the “Pert” core conditions.
Figure 4.8 Radial peaking factors for each pin in the FA positions 30 30 (inner core, left frame) and 33 25 (outer core, right frame) in the EoC core conditions.
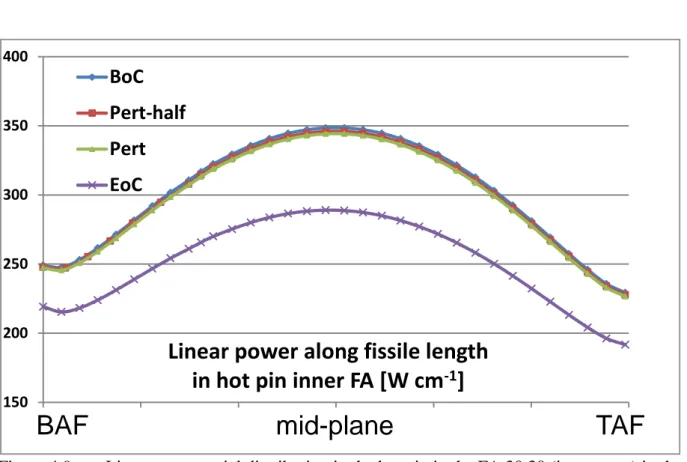
Finally, Figures 4.9 and 4.10 show the linear power axial distribution – from the Bottom of Active Fuel (BAF) to the Top of Active Fuel (TAF) - in the hot pin in the inner (FA 30 30) and outer (FA 33 25) zones, respectively, in all the core conditions examined. As expected, the behaviour of the pin power in the outer zone varies sensibly with the axial quote of the CR accidentally withdrawn, while the behaviour in the inner zone varies significantly – though only in its value, not in the shape – only at EoC (i.e., complete withdrawal of all the 12 CRs, §3).
Ricerca Sistema Elettrico ADPFISS – LP2 – 113 0 R 16 31
Figure 4.9 Linear power axial distribution in the hot pin in the FA 30 30 (inner zone) in the core conditions examined.
Figure 4.10 Linear power axial distribution in the hot pin in the FA 33 25 (outer zone) in the core conditions examined.
150 200 250 300 350 400 0 11 22 33 44 55 66
Linear power along fissile length
in hot pin inner FA [W cm
-1]
BoC
Pert-half
Pert
EoC
BAF mid-plane
TAF
150 200 250 300 350 400 0 11 22 33 44 55 66
Linear power along fissile length
in hot pin outer FA [W cm
-1]
BoC
Pert-half
Pert
EoC
Ricerca Sistema Elettrico ADPFISS – LP2 – 113 0 R 17 31
5
Transient analysis
Besides changing the power deposition among the FAs (shown in 4.2), the spurious extraction of a single CR is an initiator of an UTOP transient due to the associated insertion of positive reactivity. Therefore, in order to evaluate the thermal performances of the fuel, it is necessary to establish the maximum power reached in such transient.
The first step is thus selecting a credible maximum withdrawal velocity of the CR which is fixed by the maximum actuation speed of the motor moving the CR handler. This limiting velocity should, in theory, be as low as possible so to reduce the effect of a sudden CR extraction in an UTOP and, at the same time, as high as possible to allow for a fast regulation increasing the load following capabilities of the reactor. The adopted choice has been based on the European Utility Requirements for modern nuclear power plants [11], which states that a power variation of around 5% per minute should be a design target. Given the 300 MWth of the ALFRED reactor,
this translates in 0.25 MWth/s and considering that in [12] the extraction of some 3 mm of the 12
CRs gives a power raise of about 18MWth (amounting to 0.5 MWth/mm for the single CR), we
can immediately deduce that the necessary extraction velocity is 0.5 mm/s.
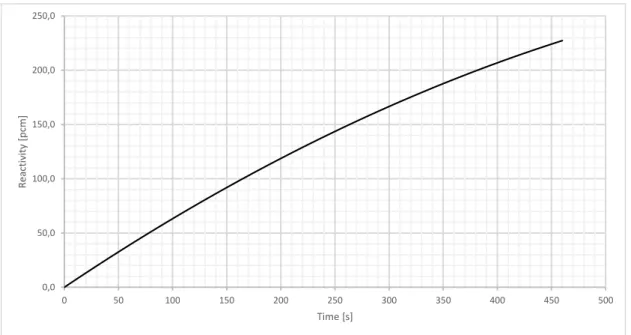
Coupling the extraction velocity with the CR reactivity curve (giving the worth of the CR for each position) reported in [13] and normalizing to the worth reported in Table 4.1, we finally obtain the relation between time and reactivity insertion. The net result is depicted in Figure 5.1 and represents the input for the transient analysis.
Figure 5.1 Reactivity4 insertion as a function of time for the UTOP.
For evaluating the transient behaviour in the “Pert” condition (§3) stemming from the reported reactivity insertion, the RELAP5 system code [6] has been selected. By adopting the reactivity coefficients reported in [13], the results depicted in Figure 5.2 were obtained. The maximum core power in the transient occurs at about 450 s and sets at 464 MWth (~1.55 times the original
power) to which corresponds a core inlet T of 445.5 °C.
4
The reactivity ρ was evaluated, by definition, as ρ = (keff – 1) / keff., where keff is the multiplication factor.
0,0 50,0 100,0 150,0 200,0 250,0 0 50 100 150 200 250 300 350 400 450 500 Re act iv ity [ p cm ] Time [s]
Ricerca Sistema Elettrico ADPFISS – LP2 – 113 0 R 18 31
Figure 5.2 Core power (left frame) and coolant inlet T in the core (right frame) as a function of time for the UTOP.
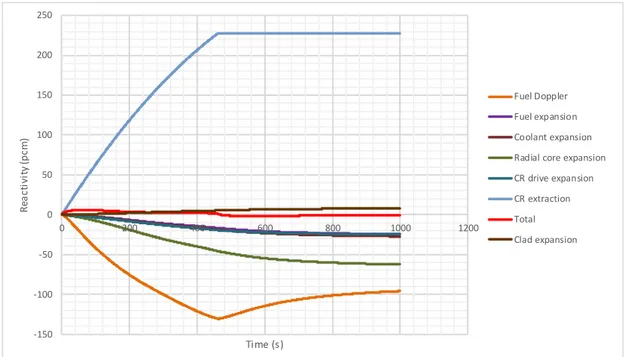
To better understand the transient dynamic, Figure 5.3 can be consulted: the inserted reactivity from the ejected CR is almost balanced by: the fuel Doppler effect, the radial core expansion due to the increasing core inlet temperature along with the fuel, the coolant and CR driveline thermal expansions. The reactivity stays slightly positive as long as the CR ejection takes place driving the power increase; once the withdrawal is completed, the reactivity becomes negative and the point of maximum power is reached. Then, the various effects balanced each other bringing the core to a new steady state power (as depicted in the left part of Figure 5.2).
Figure 5.3 Various feedback contributions to the total reactivity during the UTOP.
300 320 340 360 380 400 420 440 460 480 0 200 400 600 800 1000 Time (s) Neutronic power (MW) 380 400 420 440 460 480 500 0 200 400 600 800 1000 Time (s) T-lead core inlet (°C)
-150 -100 -50 0 50 100 150 200 250 0 200 400 600 800 1000 1200 R ea ct iv it y (p cm ) Time (s) Fuel Doppler Fuel expansion Coolant expansion Radial core expansion CR drive expansion CR extraction Total Clad expansion
Ricerca Sistema Elettrico ADPFISS – LP2 – 113 0 R 19 31
For understanding the evolution of the inlet T (depicted in the right part of Figure 5.2), it must be reminded that the primary circuit mass flow is basically constant during the transient, implying that a core power increase translates in a higher core outlet T. Given that the steam generator power removable capabilities lag behind the core ones, the steam generator outlet T and consequently the core inlet T are bound to increase until the two systems converged to the new steady state power, as visible in Figure 5.4.
Figure 5.4 Core and steam generator power evolution during the UTOP.
250 300 350 400 450 500 0 200 400 600 800 1000 1200 P o w er ( M W ) Time (s) Core Steam generator
Ricerca Sistema Elettrico ADPFISS – LP2 – 113 0 R 20 31
6
Thermal-Hydraulic analysis
6.1 Tools
The TH analyses were carried out with the sub-channel code ANTEO+ (ANalisi TErmodraulica Ottimizzata). It was developed in-house at ENEA [7] specifically for the liquid metal (e.g., Na, Pb and Pb-Bi) cooled systems and extended to encompass any (possibly conceived) advanced design, in order to meet the objectives envisaged in the GIF roadmap.
The hexagonal FA model in ANTEO+ with the convention adopted for the pin numbering is depicted in the left part of Figure 6.1, while the right part indicates the three kind of sub-channels (interior, edge and corner) for this bundle geometries. It can be noticed that the ANTEO+ pin numbering is the same used by the ECCO cell code (see Figure A.1 in Appendix A)
Figure 6.1 FA model in ANTEO+ with pin numbering (left frame); three types of sub-channel in a hexagonal assembly (triangular pin lattice, right frame).
To summarise very briefly, the modelling adopted in ANTEO+ corresponds to a system of sub-channels dynamically connected only at the inlet and energetically connected throughout the whole simulated (axial) development of the bundle. Once the coolant T distribution is known, the internal T distribution of the fuel pin can be calculated. In the present work, the capabilities of ANTEO+ in solving the T distribution inside the clad are exploited so to retrieve the maximum fuel T and the consequent margin to melting in the perturbed cases previously described. However, it must be reminded that ANTEO+ does not represent a thermo-mechanic code. Therefore, the clad and pellet T are estimated approximatively by assuming:
1) unirradiated conditions, 2) cold geometry,
3) the clad-pellet gap filled with helium; 4) no transient gaseous swelling of the fuel.
While the second hypothesis is extremely conservative, the other three may not be. Nevertheless, the maximum calculated fuel T in such conditions is deemed acceptable for the present purposes.
Ricerca Sistema Elettrico ADPFISS – LP2 – 113 0 R 21 31
6.2 Results in steady state conditions
By referring to neutronic results obtained in steady states (reported in §4.2), Figures 6.2-6.4 show the distribution of the coolant outlet T in the hottest FA in the inner and outer zones in different core conditions: the graph plots were obtained through a python procedure.
Figure 6.2 shows the distribution of the coolant outlet T in the hottest FA in the inner (left) and outer (right) zones at BoC: it can be noticed that, as expected, the radial T distribution is more uniform in the inner FA 30 30 (away from the CRs). The hottest sub-channels in both cases are the corner ones and reach an outlet T of about 490 °C in the FA 30 30 (inner zone).
Figure 6.3 shows the distribution of the coolant outlet T in the hottest FA in the inner (left) and outer (right) zones at EoC. Coherently with the linear power axial distributions of Figures 4.9 and 4.10, the highest T (occurring in the corner sub-channels as at BoC) is almost identical to the BoC value in the outer zone, while it results lower than the BoC one of about 15 °C in the inner zone. Figure 6.4 shows the distribution of the coolant outlet T in the hottest FA in the “Pert” condition (§3): the hottest FA (and pin, in the whole core) occurs in the outer zone (FA 33 25). As at BoC and EoC, the highest T occurs in the corner sub-channel and reaches about 500 °C. As expected from the power peaking factor values reported in Table 4.3, the “Pert” condition yields the highest coolant T among the four core conditions examined.
Figure 6.2 Coolant outlet T in the hottest FAs in the inner (position 30 30, left frame) and outer (33 25, right frame) zones at BoC.
Figure 6.3 Coolant outlet T in the hottest FAs in the inner (position 30 30, left frame) and outer (position 33 25, right frame) zones at EoC.
Ricerca Sistema Elettrico ADPFISS – LP2 – 113 0 R 22 31
Figure 6.4 Coolant outlet T in the hottest FA (outer zone, position 33 25) in the perturbed “Pert” core condition.
Furthermore, by continuing to refer to the steady state neutronic parameters as input (§4), the ANTEO+ analyses yield the following results for the maximum clad (surface) and fuel (pellet central) T:
for what concerns the inner zone, the different CR axial positions (see Figure 3.1) do not yield significant differences for the hottest T (coherently with the linear power values of Figure 4.9). The maximum clad and fuel T are reached in FA position 30 30 at BoC (about 510 °C and 1810 °C, respectively);
for what concerns the outer zone, the axial position of the CR has a greater impact on the hottest T (coherently with the linear power values of Figure 4.10). The maximum clad and fuel T are reached in the “Pert” condition in the FA position 33 25 (about 525 °C and 1930 °C, respectively).
Therefore, the clad and fuel safety limits of 550 °C and 2800 °C (i.e., melting) are not exceeded in such evaluations in nominal conditions. But, to calculate accurately the T reached by the fuel and its clad during the accidental CR extraction, it result necessary to analyse the phenomenon in UTOP conditions (see §6.3).
6.3 Results in UTOP conditions
Updating the FA power distribution in the “Pert” condition (§4) to the new overall core power during the UTOP (left part of Figure 5.2) and using the new core inlet T at the point of maximum power (right part of Figure 5.2), enabled the correct evaluation of the safety performances of the core. Results obtained for the hottest FA in the “Pert” condition - the one in position 33 25 of the outer zone – are reported from Figure 6.5 to Figure 6.7.
Ricerca Sistema Elettrico ADPFISS – LP2 – 113 0 R 23 31
Figure 6.5 plots the radial distribution of the coolant outlet T in the hottest FA. Figures 6.6 and 6.7 plot the axial distribution of the maximum clad and fuel T in the hottest pin, respectively.
Figure 6.5 Radial distribution of the coolant T at the outlet of the active region in the FA of maximum power for the UTOP (position 33 25).
Figure 6.6 Axial distribution of the maximum clad outer T in the point of maximum power for the UTOP (Pert) along with the same profile in BoC nominal conditions (FA 33 25).
0 100 200 300 400 500 600 700 800 0 0,1 0,2 0,3 0,4 0,5 0,6 0,7 0,8 0,9 1 Cl ad h al f-th ic kn es s T [° C]
Normalized distance from beginning of the active region
Pert BoC
Ricerca Sistema Elettrico ADPFISS – LP2 – 113 0 R 24 31
Figure 6.7 Axial distribution of the maximum fuel T in the point of maximum power for the UTOP (Pert) along with the same profile in BoC nominal conditions (FA position 33 25).
As can be seen from Figure 6.7 the maximum fuel T results 2544 °C at a local linear power around 577 W/cm; given that the melting T is 2800 °C, the remaining margin of 256 °C should be high enough to accommodate the modelling, material and fabrication uncertainties. Fuel melting should then be excluded even if the TOP initiated by the spurious withdrawal of one CR actually evolved as Unprotected (i.e., none of the safety systems acted to stop the transient). Therefore, the focus on the long term would be on the cladding and its ability to withstand creep. The peak cladding T reaches about 670 °C at half-thickness (see Figure 6.6) in the hottest pin of the hottest FA. At this T, even if sustaining the highest inner pressure due to the conditions of a completely burnt element, the time-to-rupture is in the order of some weeks. This fact well meets the recommendations of the safety regulators, which set in 30 minutes into the accident the time any operators’ intervention cannot be credited [12]. Therefore, the huge grace time for intervention allowed by the cladding time-to-rupture makes highly probable that the unprotected condition is arrested by actuation of a backup scram and, consequently, no cladding failure should be expected when this kind of accident occurs.
Even if safety requirements are met without any intervention in the target grace time, it is interesting to analyse the possible signals that could activate a scram for increasing times:
the power (and thus flux) increases by almost 55% (Figure 5.2) and that should be detected by the Operation Monitoring and Protection Detection (OMPD) system as described in [13];
the average coolant outlet T from all FAs increases. Notably, for the hottest FA it raises from 485 °C in BoC nominal conditions, (right part of Figure 6.2) up to 594 °C in UTOP conditions (Figure 6.5): therefore, the thermocouple system placed near the FA outlet nozzles should be able to detect such a significant shift.
If one of those signals succeeds in activating a scram, the transient just described would be promptly cut, with no safety implications at all.
0 500 1000 1500 2000 2500 3000 0 0,1 0,2 0,3 0,4 0,5 0,6 0,7 0,8 0,9 1 M a xi m u m f u e l T [° C]
Normalized distance from beginning of the active region
Pert BoC
Ricerca Sistema Elettrico ADPFISS – LP2 – 113 0 R 25 31
7
Concluding remarks
This report summarises the work carried out in the first year of the tri-annual AdP (Programmatic Agreement between ENEA and MiSE) program (PAR 2015), task A.1 of the first objective of project line n. 2 (LP2). The study deals with the local perturbation phenomena potentially occurring in the ALFRED LFR concept (§2) during the nominal plant conditions. The ALFRED core design was initially conceived in the EURATOM FP7 LEADER project and successively updated in the last two years of the previous tri-annual AdP program.
The perturbation investigated consists in the accidental extraction of the CR having the highest anti-reactivity worth, that is located in the FA outer zone (§3). The impact on the core neutronics was evaluated with the ERANOS deterministic code in terms of (§4):
core reactivity balance;
global power distribution among FAs;
local power distribution in the hottest FA at the level of the single pin (by adopting the procedure briefly described in Appendix A).
The neutronic results were then used as input for transient analyses, since the spurious extraction of a single CR represents the initiating event of a TOP transient (due to the sudden insertion of about 220 pcm positive reactivity). For conservativeness, the transient is also assumed to evolve in Unprotected conditions and investigated accordingly. By adopting a credible maximum withdrawal velocity of the CR (calculated basing on the target established by the European Utility Requirements for modern nuclear power plants), the transient analysis made with the RELAP5 system code pointed out that (§5):
the maximum core power in the UTOP occurs at about 450 s and sets at 464 MWth (~1.55
times the original power);
at 450 s the core inlet T reaches about 445 °C.
The main objective of the study was the assessment of the new thermal conditions of the hottest FA in order to verify the compliance with the safety limits even in the perturbed condition or, alternatively, the capability of the monitoring system to detect promptly the abnormal condition. Therefore, an accurate TH study was carried out with the ANTEO+ sub-channel code (developed in house at ENEA, §6.1) to evaluate the T distributions in all the pins and surrounding sub-channels of the hottest FA. The TH analysis was performed by adopting as input parameters both:
the neutronic results in steady states for the core- and FA-wise power distributions (§6.2);
the data coming from the analysis of the UTOP transient for the overall core power and inlet coolant T increase (§6.3).
To put in evidence the difference between the two approaches, and as main consequences of the different core power levels assumed (300 MW in steady state and 464 MW in the UTOP), we can compare:
the maximum clad outer T in the hot pin, that resulted about 525 °C in steady state evaluations and about 650 °C in UTOP conditions;
the maximum fuel T in the hot pin, that resulted 1930 °C in steady state evaluations and 2544 °C in UTOP conditions.
However, even by considering the UTOP case, a margin of 256 °C remains from the melting point (about 2800 °C). Therefore:
such margin should be high enough to accommodate the modelling, material and fabrication uncertainties;
Ricerca Sistema Elettrico ADPFISS – LP2 – 113 0 R 26 31
fuel melting should be excluded even if none of the safety systems acted to prevent, or early stop, the UTOP.
Similarly, by looking at the cladding T behaviour and its ability to withstand creep, we found that the grace time for operator intervention is far higher than the minimum target of 30 minutes. As a final remark, even if the safety requirements are met without any form of intervention in the target grace time, the possible signals that could activate a scram for increasing times can be noticed. In some details, they can be represented by:
the power that increases by about 55% and could be detected by the OMPD system;
the average coolant outlet T that reaches up to 594 °C in UTOP conditions and could be detected by the thermocouple system placed near each FA outlet nozzle.
Ricerca Sistema Elettrico ADPFISS – LP2 – 113 0 R 27 31
References
[1] Grasso, G., et al., 2014. The core design of ALFRED, a demonstrator for the European lead-cooled reactors, Nucl. Eng. and Des., Vol. 278, 287-301.
[2] OECD/NEA, 2014. Technology Roadmap Update for Generation IV Nuclear Energy Systems, . [3] Grasso, G., et al., 2014. Ottimizzazione del progetto di nocciolo di ALFRED. Ricerca di Sistema
Elettrico, Technical Report ADPFISS-LP2-050.
[4] Lodi, F., et al., 2015. Characterization of the new ALFRED core configuration. Ricerca di Sistema Elettrico, Technical Report ADPFISS-LP2-085.
[5] Rimpault, G., et al., 2002. The ERANOS code and data system for Fast Reactor neutronic analyses, Proc. Int. Conf. on the New Frontiers of Nuclear Technology: reactor physics, safety and high-performance computing, PHYSOR 2002, Seoul, Korea, October 7-10th.
[6] Fletcher, C.D., et al., 1995. RELAP5/MODE3 code manual, NUREG/CR–5535, INEL–95/174, Idaho National Engineering Laboratory.
[7] Lodi, F., et al., 2016. ANTEO+: a sub-channel code for thermal-hydraulic analysis of liquid metal cooled systems, Nucl. Eng. and Des., Vol. 301, 128-152.
[8] Koning, A., et al., 2006. The JEFF-3.1 Nuclear Data Library, NEA Data Bank, OECD, JEFF Report 21, NEA N_6190.
[9] Rimpault, G., 1997. Physics documentation of Eranos: the Ecco cell code, CEA Tech. Rep. DERSPRC-LEPh-97-001.
[10] Ruggeri, J.M., et al., 1993. TGV: a coarse mesh 3 dimensional diffusion-transport module for the CCRR/ERANOS code system, Tech. Rep. CEA DRNR-SPCILEPh-93-209.
[11] OECD-NEA, 2011. Technical and economical aspects of load following with nuclear power plants. [12] Ponciroli, R., et al., 2014. A preliminary approach to the ALFRED control strategy, Progress in
Nuclear Energy, Vol. 73, 113-128.
[13] Guglielmelli, A., et al., 2014. Studi preliminari di tecniche di monitoraggio del nocciolo di ALFRED. Ricerca di Sistema Elettrico, ENEA Technical Report ADPFISS-LP2-051.
Ricerca Sistema Elettrico ADPFISS – LP2 – 113 0 R 28 31
Appendix A:
Methodology for neutronic analysis
Even by working with a deterministic neutronic code (ERANOS, §4.1), the distortion of the local power distribution in the hot FA was evaluated at the level of detail of the single pin, by adopting the procedure here summarily described.
1) Starting from the “standard” 3D full core calculations carried out with the TGV module [10], the nodal fluxes in ERANOS were “reconstructed” by evaluating the core power distributions in all the FAs through the average flux values in nominal conditions at 300 MWth. The power
distributions were calculated with fresh fuel compositions (i.e., BoL) with the CRs in four different positions in order to simulate (see Figure 3.1):
- the BoC condition with the CRs partially inserted in fissile zone;
- the EoC condition with the CRs completely withdrawn;
- the local perturbation occurred at BoC, when the CR closest to the hottest FA in the outer zone is accidentally withdrawn. A couple of axial quotes were considered for the CR extracted: in the halfway (between BoC and EoC) and as at EoC – named “Pert-half” and “Pert” core conditions, respectively - by assuming the other 11 CRs positioned as at BoC. 2) The power distributions in all the (inner and outer) FAs were elaborated by a fortran90
program: the procedure permits to extract from the ERANOS output the power of each FA and makes it available in a table format (e.g., ready for an excel worksheet).
3) The core power distributions were post-processed by running an additional ERANOS case in which both the radial and axial meshes were refined: the refinement (not possible in the firsts full core calculations to avoid a memory overflow) is necessary to analyse accurately the impact of the local perturbation (i.e., power distortion due to the CR withdrawal). The radial power profiles were re-calculated by adopting 37 calculation points for each axial mesh, instead of the 7 ones used in the standard full core calculations. The axial power profiles were refined by a factor 2: they do not need any manipulations since are directly presented in a table format in the ERANOS output.
4) The power distributions in the hottest FAs were furtherly refined by considering:
- the flux shape in the core, obtained with ERANOS by 37 calculation points for each axial mesh of each FA;
- the flux shape in the FA obtained with ECCO (§4.1) by considering all the 127 pins. The pins numbering and symmetry adopted by the ECCO cell code is shown in Figure A.1. In some details, a fortran90 program permits to evaluate the power distributions pin by pin in the (inner and outer) hottest FA by calculating a pin power distribution factor which takes into account the flux shape in the core. The fortran90 procedure starts from the symmetric pin power distribution in the ECCO data (see Figure A.1) and modifies it by applying a correction factor that superimposes the flux shape by interpolating the 37 flux values.
5) To summarise, the results - that can be plotted in a graphical form by means of a python procedure - are essentially three:
a) the radial layout of the core fissile zone (see Figure A.2): this tool can represent also a possible check of the core geometry model described in ERANOS;
b) the “global” radial core power distribution among all the FAs: the python procedure permits to plot either the FA distribution factors (as in Figures 4.1-4.4) or the power of each FA, as shown in Figures A.3-A.6;
c) the “local” radial and axial power distributions in the hottest FAs: the radial one is refined at the pin level (see Figures 4.5-4.8), while the axial one can be refined as wished by the
Ricerca Sistema Elettrico ADPFISS – LP2 – 113 0 R 29 31
user (and compatibly with the memory overflow issue).
Figure A.1 Pins numbering and symmetry adopted by the ECCO cell code within the FA.
Figure A.2 Layout of the ALFRED core fissile zone obtained by a python procedure.
1 4 12 26 6 16 32 2 8 20 3 9 21 11 10 22 25 24 23 7 17 33 19 18 34 37 36 35 5 15 31 13 14 30 27 28 29 39 40 41 42 46 45 44 43 47 48 49 50 54 53 52 51 55 56 57 58 38 61 60 59 63 64 65 66 68 72 71 70 69 67 73 74 75 76 77 78 82 81 80 79 83 84 85 86 87 88 62 91 90 89 93 94 95 96 97 98 102 101 100 99 104 103 105 106 107 108 109 110 111 112 116 115 114 113 117 118 119 120 121 122 123 124 92 127 126 125 Pin type # 1 1 2 6 3 6 4 6 5 6 6 12 7 6 8 12 9 6 10 6 11 12 12 12 13 6 14 12 15 12 16 6 1 2 4 3 6 5 7 9 8 11 12 10 13 16 15 14 Pin types
Ricerca Sistema Elettrico ADPFISS – LP2 – 113 0 R 30 31
Figure A.3 Core power distribution at BoC (FA power).
Ricerca Sistema Elettrico ADPFISS – LP2 – 113 0 R 31 31
Figure A.5 Core power distribution in the “Pert” core condition (FA power).