Engineering Structures 226 (2021) 111341
Available online 17 October 2020
0141-0296/© 2020 The Authors. Published by Elsevier Ltd. This is an open access article under the CC BY-NC-ND license (http://creativecommons.org/licenses/by-nc-nd/4.0/).
Effectiveness of a steel ring-frame for the seismic strengthening of masonry
walls with new openings
M´onica.Y. O˜na Vera
a,*, Giovanni Metelli
a, Joaquim A.O. Barros
b, Giovanni A. Plizzari
a aDICATAM, University of Brescia, Via Branze 43, 25123 Brescia, ItalybISISE, IB-S, Department of Civil Engineering, University of Minho, Campus de Azur´em, 4800-058 Guimaraes, Portugal
A R T I C L E I N F O Keywords:
New openings Brick masonry wall Steel ring-frame Seismic behaviour
A B S T R A C T
The creation of new openings in masonry walls is a frequent intervention in existing buildings. Depending on their size and position, these interventions may cause a significant decrease of the wall’s original in-plane strength and stiffness, thus compromising the building seismic resistance. Therefore, in masonry buildings, strengthening techniques may be required to (i) restore as much as possible the loss of stiffness and strength, (ii) be reversible and (iii) respect the compatibility between materials, particularly in the case of historical buildings. In an attempt to comply with these requirements, engineering practitioners often introduce very stiff steel profiles forming a ring-frame inside the opening for fully restoring the stiffness and resistance without sub-stantially increasing the building’s weight. However, the effectiveness of this technique is typically quantified using linear elastic analysis and a simple sum of the flexural and shear stiffness of the masonry panels and the steel ring-frame. The present work aims to improve the knowledge and better understanding of the effectiveness of this traditional steel ring-frame technique, through experimental and numerical methods. The experimental program was designed to provide a full assessment of the effects of introducing a new door opening in brick masonry walls, from the cutting process to the application of in-plane cyclic lateral deformations. The steel ring- frame was designed using numerical tools and consisted of four profiles welded together and tied to the sur-rounding masonry wall by means of steel dowels dry-driven into calibrated holes of the brick. Results show that the steel ring-frame system restores the original solid wall’s in-plane strength and ductility, but not the lateral stiffness, despite the use of large steel profiles.
1. Introduction
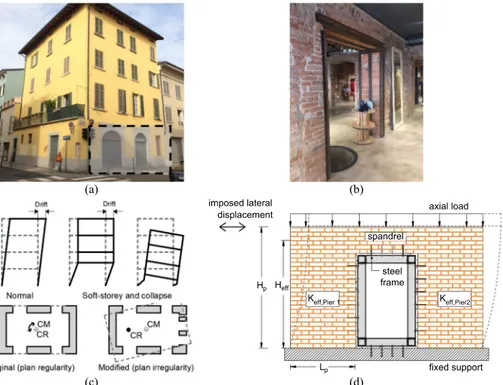
The renovation of existing unreinforced masonry (URM) buildings has increased significantly in recent years, e.g: existing buildings often turn into hotels, shops, restaurants, parking garages (at the street level) or office spaces (Fig. 1a,b). Some of such renovation works require the perforation of original solid masonry walls to create new openings which, depending on their size and position, may cause relevant changes in the mass, stiffness and strength of the wall or the entire building. Such changes may be unfavourable when seismic forces are present and, thus, should be carefully addressed. In general, building codes suggest that, whenever possible, perforations or new openings in load-bearing ma-sonry walls should be avoided to minimize unfavourable effects of ir-regularities, especially under seismic loads [1,2]. Irregularities can contribute to increase the distance between the centre of stiffness (CR) and centre of mass (CM) in the structural systems, which may produce
undesired torsional effects and induce the brittle collapse of the struc-ture in case of seismic events (Fig. 1c). However, despite these serious concerns and the building codes suggestions, the demand for intro-ducing new openings in URM walls is continuously increasing in seismic prone countries, thus changing the seismic behaviour of the original building. One example is Italy [3], where the Italian building code explicitly mentions the introduction of new openings in walls and allows the intervention without the need to perform a global analysis of the structure [2,4], as long as the original stiffness and strength of the wall
“do not significantly change after the intervention” (Section 8.4.1 and
C8.4.1). Thus, since it was demonstrated that new openings may impair the wall’s stiffness and strength, depending on their size and position
[3,5], suitable strengthening is necessary to minimize such reduction and fulfil the Italian building codes requirements. However, when working with masonry, besides improving the building’s structural response, strengthening techniques should also be reversible and
* Corresponding author.
E-mail address: [email protected] (M´onica.Y. O˜na Vera).
Contents lists available at ScienceDirect
Engineering Structures
journal homepage: www.elsevier.com/locate/engstruct
https://doi.org/10.1016/j.engstruct.2020.111341
compatible with the surrounding masonry [6]. To this aim, engineering practitioners often introduce a steel ring-frame around the new opening and adopt a simplified analytical approach for its design [3,7,8]. Steel frames (Fig. 1d) are usually preferred above other strengthening tech-niques due to their high level of reversibility, ease of application and the stiffness and strength they can provide without substantially increasing the building self-weight [9]. However, to the date and the knowledge of the authors, in the literature this retrofitting technique has not been investigated in-depth and only a few numerical and experimental studies have been recently published by Billi et al. [3] and Proença et al.
[10]. Billi et al. carried out macro-numerical simulations on walls with new openings equal to 13% of the walls’ total area and reinforced with different steel-profiles cross-sections, different base restraints of the steel frame uprights and two limit cases of the degree of connection between the steel frame uprights and the surrounding masonry. Billi and co-workers concluded that only steel-profiles with very large moments of inertia (which could be incompatible with architectural re-quirements) are capable of restoring the wall’s original stiffness, while little difference was observed with regards the in-plane strength. Regarding the connection between frame and surrounding masonry, Billi et al. concluded that a perfect connection increases significantly the wall’s in-plane strength and ductility when compared to the opposite limit (absence of connections). However, although the work of Billi and co-workers was accurate for the correspondent research stage, the connections were modelled using Mohr-Coulomb based interface ele-ments in between the steel profiles and masonry, i.e., the degree of connections was simulated by varying the value of the cohesion for the interface elements, by considering the connection as distributed. Thus, the numerical model was not able to capture the damage of the masonry surrounding a real point-wise connection (such as dry-driven connectors or metal bars welded to the steel-profiles and glued to masonry with epoxy or fluid mortar). Therefore, as indicated by Billi et al. [3], experimental research is needed to validate the reliability of the nu-merical models presented in [3].
Conversely, Proença et al. [10] carried out two quasi-static cyclic in- plane tests on stone-masonry walls with a window type opening, being one of the wall specimens reinforced with a steel ring-frame. The latter
was fixed to the wall employing threaded rods and an injectable high performance chemical adhesive which may compromise the revers-ibility of the strengthening system. The experimental results from Pro-ença and co-workers [10] showed that the anchorage system and the steel ring-frame reinforcement increased the deformation capacity of the wall in 25% and +40% at peak strength. Regarding the cracking pat-terns, the unreinforced wall developed a shear mechanism while the reinforced wall developed a mixed shear-rocking behaviour with a distributed cracking pattern. The work of Proença et al. [10] included numerical simulations using the total strain rotating crack model and showed good agreement between the load-displacement numerical and experimental curves. However, it is worth noting this numerical inves-tigation assumed perfect compatibility between the steel ring-frame (beam elements) and the surrounding masonry wall (plane-stress ele-ments), which can be very difficult to reproduce in real practice [3].
The present paper aims to complement the work of Billi et al. [3] and Proença et al. [10] and to advance the knowledge of the seismic analysis of masonry walls with new openings strengthened with steel frames, by presenting the results of both an experimental research and refined numerical models. For the main experimental test, a brick masonry wall was built and, eventually, cut to create a new opening, simulating a real case scenario. Then, the wall was strengthened with a steel ring-frame around the opening (designed using preliminary numerical analyses
[11]). The frame was connected to the surrounding masonry wall by means of steel dowels dry-driven into clay-bricks, thus allowing a higher degree of reversibility when compared to chemical anchorages. Finally, the wall was tested under quasi-static cyclic in-plane loads to analyse both the global behaviour of the strengthened wall and the local damage in the zone surrounding the connections due to the interaction between the steel frame and the masonry. The numerical model, which explicitly takes into account the local shear-slip law of the dowel connection, was validated by the experimental results through the analysis of the lateral response of the wall and the cracking patterns. Results showed that the flexible steel ring-frame was capable of restoring the in-plane strength of the original wall but not the lateral stiffness. Stronger steel profiles in-crease the lateral strength of the wall with opening, suggesting that the proposed strengthening technique, as well as that of others referred to
(a) (b)
(c) (d)
Fig. 1. Unreinforced masonry building with new openings in Brescia (Italy) (a, b); vertical and plan irregularity caused by the introduction of the new openings (c);
(Billi et al. [3] and Proença et al. [10]) could also be used to compensate for pre-existent (original) large openings in walls that might otherwise experience a severe damage or collapse during a seismic event.
2. Background theory
Current works in the technical literature propose the steel ring-frame as a strengthening system for masonry walls which were perforated to create a new door or window opening type. This strengthening system is aimed against both vertical loads [8,9] and in-plane lateral actions
[3,7]. To determine the wall’s in-plane stiffness before and after the introduction of a new opening, the “equivalent frame” idealization and the Timoshenko Beam Theory (TBT) are generally applied. The equiv-alent frame method assumes that the spandrel contribution is related to the piers boundary conditions, i.e., masonry piers are evaluated either as cantilever beams or double-fixed beams, when the “weak spandrel- strong piers” or the “strong spandrel-weak piers” idealization is hypothesized.
The URM wall’s effective stiffness (Keff), which is a percentage of its
elastic stiffness (αKe) is calculated as the reciprocal of the sum of the
flexural and shear flexibility (Kf-1 and Ks−1, respectively), as shown in Eq. (1). Keff is used to determine the elastic branch of walls shear strength-
displacement curve [12], while α is the reduction factor that accounts
for cracked masonry, and kf and ks are the wall flexural and shear
stiffness, respectively. Eurocode 8 (Part 1) [1] suggests that, in the absence of more accurate information, Keff is reduced to one half of the
elastic stiffness (i.e., α =0.5). Similarly, the Italian Building Code [2,4] assumes α = 1.0 and α = 0.5 for uncracked and cracked masonry, respectively. Keff=αKe=α ( 1 Kf +1 Ks )−1 (1) Kf = n EMIp H3 eff (2) Ks= GMLpt 1.2 Heff (3)
In Eqs. (2) and (3), EM and GM are the uncracked masonry Young and
Shear Modulus; Ip, Heff, Lp and t are the pier cross-sectional moment of
inertia, effective height [13], length and thickness, respectively (Fig. 1d); n is equal to 3 for cantilever walls and 12 for double fixed conditions.
It is worth noting that, despite the advantage of adopting the prac-tical simplifications proposed by the TBT, the double-fixed or cantilever conditions may not apply to certain walls which can present a mixed behaviour under certain conditions or with the increase of masonry’s non-linear response [14]. Intermediate boundary conditions might also depend on the spandrel brick bonding type (which creates an inter-locking effect) and other factors such as the lintel material and length, reinforced concrete beams in the floor confining the spandrels, and amount of axial load acting on the spandrel [15–18]. However, the TBT continues to be a valid method widely used in engineering practice to calculate the loss of stiffness (ΔK) due to the creation of a new opening, which is then equalized to the steel frame stiffness needed to restore the original conditions [3,7]. ΔK is calculated as the difference between the original stiffness of the solid wall (Keff,SW) and the stiffness of the
perforated wall with new opening (Keff,PW), as in Eq. (4). If the
config-uration used in this research work is considered (Fig. 1d), Keff,PW is
assumed equivalent to a system of two parallel piers; therefore, it is calculated as in Eq. (5), where Keff,Pier1 and Keff,Pier2 are the effective
stiffness of the masonry piers at each side of the opening (Pier 1 and Pier 2 in Fig. 1d).
ΔK = Keff ,SW− Keff ,PW (4)
Keff ,PW=Keff ,Pier1+Keff ,Pier2 (5)
As observed, for the sake of simplicity, the TBT does not consider the complex possible interaction between the steel-ring-frame and the sur-rounding masonry by means of the steel connectors, which could enhance the strengthening technique performance. Further experi-mental, analytical and numerical investigations are, then, needed to develop and validate other more sophisticated design alternatives with higher accuracy potential.
3. Experimental programme
3.1. Specimen geometry and design of the strengthening steel ring-frame
The wall specimen herein evaluated was representative of a wall located at the ground level of a two-storey unreinforced masonry house. This house is assumed as a single-family dwelling (i.e., a single- house completely separated by open space from another residential property;
Fig. 2); such dwelling type is often present worldwide, although some-times sharing one wall with another dwelling unit. In Italy, many of these dwellings were built after the Second World War and before the introduction of seismic design codes; thus, neglecting any design for possible earthquakes. Nowadays, these dwellings are submitted to local interventions, in order to accomplish owners’ new demands. One example is shown in Fig. 2, which is the reference structure for the present research. Therein, a new door opening of 1200 mm × 2150 mm is created at the ground-level to connect the kitchen to the adjacent dining room.
The tested solid- brick masonry wall is shown in Fig. 3, having sizes allowed by the set-up available in the Laboratory of University of Brescia. Thus, the wall was 3140 mm long, 2000 mm high and 250 mm thick while the final size of the new opening was about 1000 mm × 1500 mm, corresponding to 25% of the total wall surface. At the base and on the top of the wall a 200 mm deep beam simulates the effects of a floor diaphragm in transferring the horizontal seismic forces to the walls.
The steel frame aimed to stiffen and strengthen the perforated URM wall with opening such that it would behave as a solid wall (without opening), is in line with the requirements of the Italian Building Code
[2,4]. To this aim, the design of the steel frame, connectors size and spacing was based on preliminary numerical analyses [11], which included sensitivity analyses on the opening size, steel profile cross- section, restraint conditions at the frame uprights and absence of connectors.
The results of these simulations showed that, to restore the wall’s original stiffness, the steel frame should be composed of profiles with large cross-sections and high values of the moment of inertia (e.g., HEA240). These findings were in agreement with the results of Billi et al.
[3]. Conversely, to restore the wall’s original in-plane strength, a steel frame with a smaller cross-section (e.g. HEA140) was sufficient, as long as the frame uprights were fixed at the base and shear steel dowels having a diameter of 16 mm were spaced by 200–250 mm. It was also observed that large cross-sections of the steel frame induced a rather brittle response of the wall, due to anticipated cracks in the masonry portion. Therefore, a smaller profile (HEA140) was preferred, also for its reduced size when compared to the opening size. Fig. 4 shows the de-tailing of the steel ring-frame formed by four HEA140 profiles with S355 grade steel, welded together for forming a closed ring inside the open-ing. The steel frame was connected to the surrounding wall by means of smooth steel dowels (S355) having a diameter of 16 mm and a length of 200 mm. It should be noted that the dowels were dry-driven into cali-brated holes of bricks headers or stretchers (Fig. 4b), as also described in depth in the following section.
Finally, it should be observed that the steel ring-frame is represen-tative of a strengthening intervention of a new door at the ground-floor level where the lower horizontal steel profile, anchored to the
foundation, does not interfere and obstruct the communication between the adjacent rooms since it can be easily hidden within the thickness of the ground-floor slab. If the lower profile cannot be used because of the presence of the slab, at the building upper levels, the two uprights of the frame could be extended up to the bottom surface of the slab and fixed at their base to the masonry, without changing significantly the inelastic response of the intervention, as observed by Billi et al. [3].
3.2. Specimen construction
The wall specimen was built of solid clay bricks (250 mm × 120 mm ×60 mm) assembled according to the Flemish bond pattern, using a 10 mm layer of weak mortar having a compressive strength equal to 5 MPa. Before the introduction of the new door opening, Dywidag bars were used to fix the bottom base beam of Reinforced Concrete (RC) to the strong floor of the laboratory. This procedure caused small deflections of the RC bottom beam, which led to the formation of two bed-joint cracks at the base and mid-height of the right pier (Crack “A” and “B” in Fig. 4). Thus, before the application of the vertical load the wall was perforated by means of a diamond grinding disk to create the new opening. It should be noted that props were not used to shore-up the spandrel during the cutting process. The wall was then axially loaded with a load of 250 kN, reproducing a real case of a the two-storey house shown in
Fig. 2. The applied vertical load and the masonry self-weight induced compressive stress of 0.32 MPa at the base of the wall, which is about 5.5% of the masonry compressive strength.
Fig. 2. Example of a single dwelling house where a new opening is created (coloured with red). All units are in [mm]. (For interpretation of the references to colour
in this figure legend, the reader is referred to the web version of this article.)
Section A-A Welded Dowels Ø16mm s=210mm A A RC loading beam RC base
Dowels in the front side Dowels in the back side
19 80 684 12 24 20 0 Front view 20 0 Front view steel frame
high strength mortar 3150 1010 welded joints 15 50
Fig. 3. Schematization of the steel frame detailing. All dimensions are in [mm].
Fig. 4. (a) Steel dowels; (b) insertion of dowels in calibrated holes; (c) dowels
and mortar used in the gap between masonry-steel frame; (d) wall specimen with indications of the bed-joint crack “A” and “B”, and the Dywidag bars used to fix the RC bottom beam to the strong floor of the laboratory.
After 28-days of drying in the laboratory environment, the new opening was introduced according to the following procedure: first two vertical straight lines were cut using a diamond grinding disc of 90 mm diameter, then the bed-joint at the top of the opening was cut; finally, mortar joints and bricks were removed manually, using a masonry drill- bit and a hammer.
Once the new opening was created, the ring steel frame was placed along the perimeter of the opening, leaving a 30 mm to 35 mm gap in between the piers and the steel frame (Fig. 4c). The connection between the steel frame and the masonry was guaranteed by the steel dowels having a total length (L) equal to 200 mm (Fig. 4a), while the embedded length inside the brick, mortar and steel flange (Le) was 180 mm. The
dowels were hammered into a calibrated hole (Fig. 4b) and welded to the profile flanges to ensure fixed ends and exploit the dowel’s maximum shear stiffness (Fig. 4c). The choices of L, Le and welded heads
were based on the estimation of the dowel’s capacity proposed by Giuriani [9,19]. Finally, a high-strength mortar having a compressive strength of 36.87 MPa after 7 days was poured to fill the 30 mm gap between the wall and the frame (Fig. 4c). The wall after the intervention is shown in Fig. 4d.
3.3. Materials’ properties
In addition to the in-plane tests, material tests on solid clay bricks, mortar, masonry wallets and triplets were carried out. The results of these tests and relevant European Standards used are summarised in
Table 1. Further details on test set-up and data processing can be found in [11]. It should be noted that the masonry wallets used to determine the compressive strength of the masonry had a geometry of about 490 mm × 740 mm × 250 mm and identical brick arrangement as the wall. The wallets compressive strength resulted about 6.3 MPa, with a Young modulus perpendicular to the bed joints of 10.6 GPa; these values are similar to those found by Kallioras et al. [20] for a similar masonry arrangement and brick type. Triplet tests performed for a different level of transverse pressures allowed to estimate an initial shear strength (c) of 0.28 MPa and an initial internal friction coefficient (μ) equal to 0.78
(friction angle φ = 38◦).
3.4. Test set-up and instrumentation
As already mentioned, the wall laid on a RC foundation anchored to the laboratory slab by means of Dywidag bars. As shown in Fig. 5, lateral displacements of increasing amplitude were applied to the RC top spandrel beam using a screw jack located at the top left of the specimen. The test set up is similar to those already used at the University of Brescia in several quasi-static cyclic tests on masonries walls [27,28]. This jack had a load capacity of 500 kN and reacted against a rigid steel braced frame. When the screw jack pushed the wall towards the right direction (Fig. 5), the load was assumed as positive. A steel plate (2 in
Fig. 5) was placed at the right end of the RC top beam and connected to the opposite plate (1 in Fig. 5) by means of a steel bar running through the mid-section of the RC beam. The lateral sliding of the RC foundation was prevented by two horizontal bars which anchored the RC base to the
Table 1
Mechanical properties determined through laboratory standard tests.
Material Property Unit Mean value
Brick Compressive strength orthogonal to the brick stretcher side [21] fby [MPa] 41.2
(CoV 10.3%) Compressive strength parallel to the brick stretcher side fbx [MPa] 17.2
(CoV 14.3%)
Mortar in the wall Compressive cubic strength [22] fcm,I [MPa] 5.1
(CoV 3.2%)
Flexural strength ftm,I [MPa] 1.3
(CoV 30.4%)
Young Modulus [23] Em,I [MPa] 5860
(CoV 7.5%) High strength mortar in the gap Compressive cubic strength [22] fcm,II [MPa] 36.9
(CoV 1.5%)
Flexural strength ftm,II [MPa] 5.3
(CoV 2.8%)
Masonry Compressive strength orthogonal to bed-joints [24] fcM,y [MPa] 6.3
(CoV 1.5%) Compressive strength parallel to bed-joints fcM,x [MPa] 6.2
(CoV 11.4%) Young Modulus orthogonal to bed-joints [24] EM,y [MPa] 10,585
(CoV 13.1%)
Young Modulus parallel to bed-joints EM,y [MPa] 5345
(CoV 8.6%)
Cohesion [25] c [MPa] 0.28
Shear friction coefficient µ [–] 0.78
Steel dowels Yielding strength [26] fy [MPa] 374
(CoV 0.2%)
Ultimate strength fu [MPa] 531
(CoV 7.14%)
Fig. 5. Schematization of the loading set-up used for the in-plane quasi-static
reaction frame. Finally, it should be noted that the vertical load of 250 kN was applied using a hydraulic jack and distributed on the top spandrel beam with a series of steel beams. The vertical load was kept constant during the test by means of a hydraulic pump.
Fig. 6a shows the linear variable differential transducers (LVDT) and potentiometers (PT) used for the test. The instruments LVDT H0 and LVDT H1 recorded the horizontal displacement of the top RC beam and the top wall, respectively. H4 was used to measure any possible sliding of the RC base with respect to the laboratory floor. H3 and H5 recorded any sliding of the masonry wall piers with respect to the RC foundation. Potentiometers V1 and V3 registered any lifting of the masonry piers from the RC bottom beam, indicating possible rocking movements. V2 and V4 measured possible rotations of the concrete base. Rotations were assumed positive when clockwise, while horizontal displacements were assumed positive towards the positive loading direction. The long stroke linear potentiometers D1 – D6 were used to identify any shear distor-tions of piers and masonry spandrel, while LVDTs V5 and H7 measured sliding between the masonry wall and the steel frame (Fig. 6b). Finally, LVDTs V6, H6 and V8 registered any sliding between the strong mortar and the steel profile.
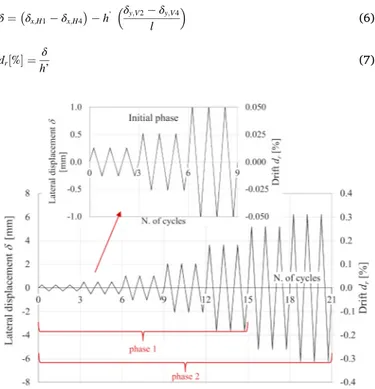
The lateral displacement of the wall (δ) and the drift (dr) were
determined as follows: δ =(δx,H1− δx,H4 ) − h’(δy,V2− δy,V4 l ) (6) dr[%] = δ h’ (7)
where δx,H1, δx,H4, δx,V2 and δx,V4 are the displacements measured by the
LVDTs H1, H4, V2 and V4 respectively; l and h’ are the horizontal and vertical distance between the measurement devices, as shown in Fig. 6.
3.5. Test phases and loading history
The quasi-static cyclic test was divided into two phases. During Phase 1, the bed-joint crack “A” shown in Fig. 4d developed; this crack influ-enced the wall’s hysteresis response, by introducing asymmetries be-tween the positive and negative load directions. Since the principal aim of the test was to study the interaction between the steel frame and the masonry wall and not the influence of bed-joint cracks, the test was stopped at a drift of 0.20%; then, Crack “A” was repaired and the test restarted (Phase 2).
The displacement history used during each phase is shown in Fig. 7; three loading cycles per drift (dr) were carried out up to a drift of 0.30%,
corresponding to a lateral displacement of 6.24 mm. The elastic stiffness was calculated at the initial drift of dr =0.0125% (lateral displacement equal to 0.25 mm). The test was stopped at the cycle where the wall shear capacity dropped by 20% and when the failure modes were evident due to severe damage in the wall. It should be noted that the loading history and test set-up were in line with previous in-plane tests carried out by the same research group [5,27,28].
3.6. Experimental results
Fig. 8a shows envelopes of the experimental results of Phase 1 and 2; for the sake of clarity, only the hysteresis belonging to Phase 2 is plotted.
Fig. 8b shows the cracks observed prior to each phase of the in-plane test. As explained, Crack “A” (of approx. 2 mm width) and Crack “B” (≤0.5 mm width) were a consequence of the tensioning of the Dywidag bars used to fix the concrete base beam to the laboratory strong floor. Crack “A” increased in width during the test (up to about 4 mm), which caused an asymmetric cyclic behaviour in Phase 1 (Fig. 8a). As mentioned in Section 4.2, the test was stopped at a drift (dr) of 0.20%,
and Crack “A” was repaired using a grouting technique with non- expansive high-flow cement mortar, in an attempt of filling the crack gap as much as possible. However, the following Phase 2 of the test started with another bed-joint crack developed during the end of Phase 1, viz. Crack “C” in Fig. 8b, which also characterized the hysteresis response of the wall as shown in Fig. 8a.
3.7. Crack patterns
During Phase 1, the bed-joint Crack “A” continued developing until reaching the opposite inner side of the pier. Then, at δ = 1.50 mm, Crack “C” and other minor cracks were observed at the opening left corners. At
δ =2.00 mm, more cracks were observed at the spandrel level and in the Fig. 6. Position of measurement devices (a)with details (b) of the instruments used to measure sliding between the steel frame and the masonry wall or the mortar
(dimensions are in mm).
masonry surrounding the dowels. At the end of the test (δ = 6.24 mm), the width of crack “C” increased up to approximately 1.5 mm. Therefore, Phase 2 started with the cracks shown in Fig. 8b. During Phase 2, the cracks in the masonry surrounding the dowels continued developing until the end of the test (Fig. 9); these cracks developed as a consequence of the rocking behaviour of both piers, i.e., when pushing the wall to-wards the positive load direction, the compressive strut concentrated in
the right pier, while the left pier began uplifting and the dowels acted to limit this action. When pulling the wall (negative load direction), a similar behaviour occurred on the other side of the wall. The piers’ uplifting was confirmed by the potentiometers V1 and V3 [11].
From the crack development observed during the test, it seemed that the wall behaved as a nearly rigid body rotating about the piers’ toes, confirming that the shear dowels contributed to a better interaction
Fig. 8. Experimental curves obtained after Phase 1 and 2 (a); initial cracks observed at the beginning of each phase (b).
Fig. 9. Experimental crack patterns at the end of the test: front view (a); back view (b).
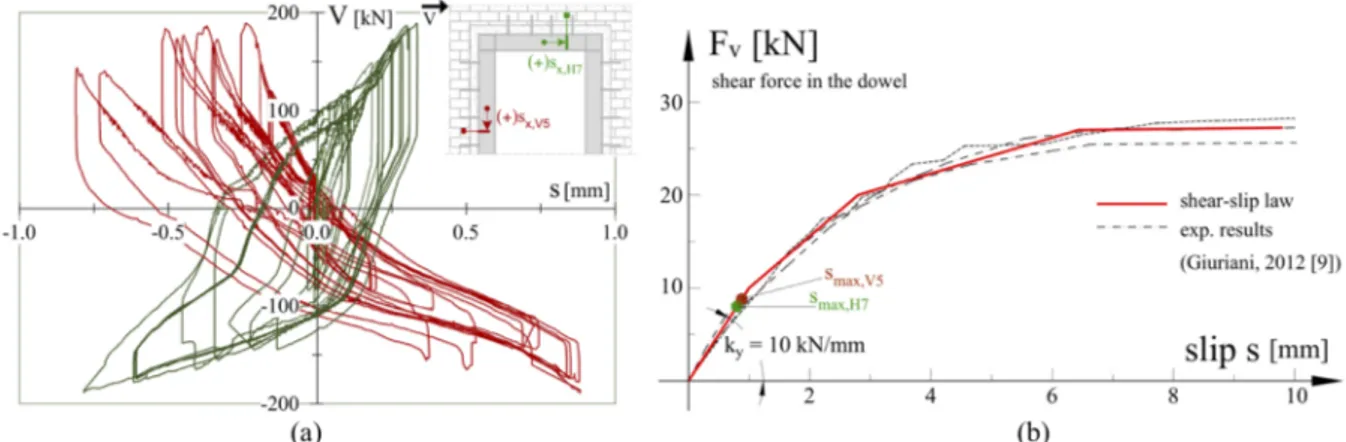
Fig. 10. Sliding measured by instruments V5 and H7, located between the masonry wall and steel frame (a); Shear-slip mean experimental curve obtained by
Giuriani [9] with indication of the maximum displacements attained by V5 and H7 devices (b). *Note that only the mean of the tests on brick masonry specimens is plot, i.e., CS1, C1D and C2S. The rest of the specimens were tested in different materials which are not compatible with the present research.
between spandrel-steel frame and spandrel-piers; these results are in line with those obtained by Proença et al. [10]. Finally, it was observed that the toes of the wall started cracking at the first cycle of the series with the maximum drift and continued cracking during the following two cycles. At this point, the wall shear capacity dropped by 25% in the positive direction and 20% in the negative direction and more cracks were observed at the spandrel level and around the steel dowels. The test was stopped at this drift level.
Fig. 10a shows the curves of the horizontal load (V) vs. the sliding (s) between the steel frame and the neighbour masonry of both the left pier (sx,V5) and the spandrel (sx,H7). The position of both instruments (V5 and
H7) was coincident with the location of the dowels (dry-driven into the bricks), so that the measured sliding (sx,V5 and sx,H7) was representative
of the local shear behaviour of the dowel connection, which takes into account also the cumulative local cracking of the surrounding masonry. Displacements sx,V5 and sx,H7 were then compared with the experimental
curves studied by Giuriani [9] and Marini et al. [19] who studied analytically and experimentally the shear/sliding local behaviour of steel dowels dry-driven into clay bricks and welded to a steel plate subjected to a shear force. The results obtained by Giuriani [9] are plotted in Fig. 10b where the maximum displacements measured by the instruments V5 and H7 are indicated in red and green circle symbols; it can be noted that the steel dowels remained in the elastic branch of the shear-sliding experimental curve of Giuriani [9] until the end of the in- plane test on the masonry wall.
4. Numerical investigation
The numerical investigation was carried out in two stages: – Stage I, which refers to the preliminary analyses carried out before
the in-plane test, with the aim of addressing the design of the steel frame reinforcement and wall specimen geometry and
–Stage II, which refers to the analyses carried out after the experi-mental test in order to validate the analyses of Stage I.
In this work, only Stage II is presented, since the preliminary ana-lyses of Stage I can be found elsewhere [5,11], where the mesh de-pendency was also evaluated. The numerical macro-models used the smeared crack approach, which is based in the Total Strain Fixed Crack Model (TSFCM), available in the Finite Element program DIANA FEA v.10.2 [29]. Due to the anisotropic material behaviour of masonry, micro-models have higher potentiality to simulate more precisely the local and global behaviour of this type of structures [30]. However, they
require several parameters and some of them were difficult to determine from experimental tests at the Stage I of our research. Therefore, the TSFCM was selected for the preliminary analysis (Stage I). The relevant parameters for this model were experimentally assessed in [5,11]. The fixed crack concept has already proven good accuracy of results [31] and was herein chosen over the rotating crack concept because of its per-manent memory of damage orientation, which is more compatible with the physical meaning of cracking of masonry, as the orientation of cracks does not change during the analysis. In the case of masonry walls sub-jected to in-plane loads and built with low strength mortar and stronger brick units, cracks would typically start and continue to spread along the mortar bed- and head-joints; therefore, mortar joints represent fixed planes of weaknesses, along which cracks (Mode I and/or II) develop with a fixed orientation upon initiation. A monotonic loading was applied and compared against the envelope of the experimental cyclic results. In principle, analyses with cyclic loading would be more appropriate when compared against experimental cyclic tests; however, the aim of the present numerical models is the evaluation of the overall shear capacity curve, which is defined by the stiffness, peak strength and ultimate displacement. Moreover, it has been proved that, when applying cyclic loads to Total Strain Crack (TSC) models, the energy dissipation could be strongly underestimated due to their secant-based unloading-reloading nature of the corresponding constitutive laws [32].
4.1. Finite element mesh, loads and boundary conditions
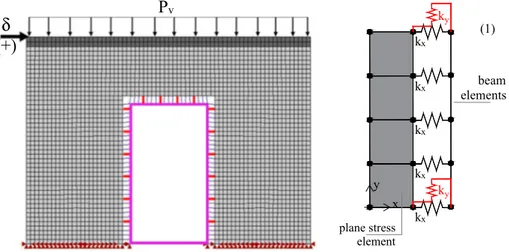
Fig. 11 shows the final mesh adopted in the present simulations, which was a good compromise between prediction accuracy and computing time. The mesh was based on 2599 square elements having a dimension of 50 mm; in particular, the following elements were used: (i) 4-node quadrilateral plane stress elements with Gauss-Legendre integration scheme of 2 integration points in each direction of the natural FE coordinate system to model the masonry wall and load distributor RC top beam;
(ii) 2-node Bernoulli beam type elements (2D) of 6 degrees of freedom to model the steel frame profiles;
(iii) 2-node no-tension spring elements to simulate the contact be-tween the steel frame and the masonry (stiffness kx in Fig. 11);
(iv) 2-node spring elements to model the steel dowels working under pure shear action (stiffness ky in Fig. 11).
Walls were modelled as cantilever beams; thus, the nodes at the base were restrained in longitudinal and vertical directions. The RC
P
v x y ky kx beam elements (1) plane stress element kx kx kx ky kxδ
(+)
Fig. 11. FE Mesh of models: Wall type 2 (PWF) with detail (1) of the steel ring frame to masonry connection; herein, masonry is light-grey coloured, concrete
distributor beam is dark-grey, the steel ring frame is blue, no-tension (axial) springs are black, while shear connectors are red. (For interpretation of the references to colour in this figure legend, the reader is referred to the web version of this article.)
distributing beam on the top of the wall was modelled with linear elastic properties (E = 30,000 MPa, ν =0.2). This assumption was supported by experimental evidence since no cracking of the reinforced concrete beam was observed during the test [11]. The loads were applied in two Phases: (1) application of the distributed load of 82.8 kN/m due to a 250 kN vertical load (as in the experiment); (2) application of mono-tonic increasing horizontal displacement to the top beam. The analyses were stopped when no further convergence was found for tolerances based on normalized energy (0.0011), displacement (0.01) and force convergence (0.01). The analyses used the Regular Newton-Raphson solving method with linear approximation.
4.2. Masonry constitutive laws
The masonry inelastic deformation in compression was modelled using a parabolic stress-strain relationship. The tensile post-cracking softening was simulated using the law proposed by Hordijk [33], which is dependent on the material tensile strength and fracture energy. A crack bandwidth equal to the square root of the element area was adopted [34] to convert the crack width concept (the law obtained experimentally by Hordijk) in a tensile strain, by preserving the results of the FE analysis independent of the refinement of the FE mesh. The post-cracked shear stiffness was simulated using a damage function. The values used in the constitutive laws are listed in Table 2. Three simu-lations were carried out, each using the following values of the Young modulus: (i) Ey =10,585 MPa (in the direction perpendicular to the mortar bed-joints), (ii) Ex =5344 MPa (parallel to the bed-joints) and (iii) the mean of these values E = 7965 MPa. The tensile strength (ft) was
calculated as in Eq. (8) [35], while the compressive fracture energy (Gc)
was determined from Eq. (9) [36], multiplied by a reduction factor of 0.5 (as conservative value) since this equation was originally proposed for plain concrete [37].
ft=
c
2μ (8)
Gc=dufc (9)
where c and μ are the cohesion and the friction coefficient, both obtained
from standard tests (Table 1), du =1.6 according to [36], and fc is the compressive strength.
4.3. Shear springs constitutive law
The stiffness of the dry-driven dowel connectors (ky), was modelled
through spring elements whose shear-slip behaviour was calibrated based on the experimental results of Giuriani [9], who carried out several shear-slip tests on steel dowels of 16 mm diameter embedded in masonry (as in the experimental test of the present wall). These dowels were dry-driven into clay bricks and welded to a steel plate subjected to a horizontal force to determine the steel dowels shear capacity and assess analytical formulations. In the numerical simulations, a multi- linear shear (Fv) – slip (s) law fitting the experimental results of
Giur-iani [9] was used to model the shear behaviour of the dowel connection
(red curve shown in Fig. 10b).
4.4. No-tension springs constitutive laws
The stiffness of the no-tension springs (kx,) was calculated as an
assemblage of three springs working in series along the x-direction perpendicular to the opening side. Theses spring represent the mortar layer between the steel frame and masonry wall, the steel flange and steel web, as shown in Fig. 12a.
The stiffness kx was then determined as in Eq. (10) where km is axial
stiffness of the mortar layer, kf is flexural stiffness of the profile flange
and ks is axial stiffness of the profile web. The stiffness km was calculated
as in Eq. (11), where the loaded area supported by each spring is equal to the width of the profile base (bs) multiplied by the portion of element
supported by each spring (in this case, the element size is i = 50 mm;
Fig. 12a); Em is the Young Modulus of the mortar filling the gap between
the masonry wall and the steel frame and is equal to 35,000 MPa; hm is
the thickness of the mortar layer, equal to 30 mm. Finally, hs is the steel
profile depth, tw is the web thickness, tf is the flange thickness, r is the
fillet radius, and bs is the flange width of the steel profile (Fig. 12a). The
web stiffness ks is calculated as in Eq. (12), where the loaded area for the
steel profile is calculated as the web thickness (tw) multiplied by the
tributary length along which each spring is located (i); Es is the steel
Young Modulus. The flange stiffness (kf) was calculated as in Eq. (13),
where p is the pressure from the masonry wall (herein assumed equal to the masonry compressive strength, fcM,x, in Table 1) and ηf is the
deflection of each flange calculated as in Eq. (14); therein, If is the flange
moment of inertia. The final no-tension law for the axial springs is shown in Fig. 12b. kx= 1 1 km+ 1 kf+ 1 ks (10) km= bsi Em hm (11) ks= twi Es hs 2− tf− r (12) kf = p bs ηf (13) The flange deflection (ηf) due to the pressure from the masonry wall
is obtained as follows: ηf= 1 8 p b4 EsIf =3 2 p b4 Est3f i (14)
4.5. Numerical vs experimental results
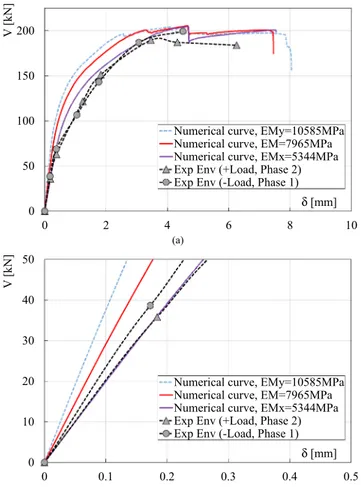
Fig. 13a and b show a comparison between the experimental and numerical load-displacement curves obtained with the different values of the Young Modulus (Table 2). The negative experimental envelope of experimental Phase (1) and the positive envelope of Phase (2) are plotted in the same quadrant. The remaining experimental envelopes are not included, since both are influenced by the opening-closing effect of the bed-joint cracks “A”, “B” and “C” (Fig. 8). As shown in Fig. 13a, the numerical models were capable of reproducing with fair accuracy the stiffness degradation, peak lateral strength and peak displacement registered during the experimental test. The effect of the Young Modulus was observed: experimentally, the wall’s initial response was stiffer for Phase (1), where the specimen was less damaged than Phase (2) (Fig. 8b). In the present study, it should be observed that the elastic modulus EMy (10,585 MPa) was obtained from wallets built in the
lab-oratory, where visible cracks were not observed prior to the test while, as mentioned above, the wall specimen tested in Phase (1) had two visible cracks at the spandrel level and at the base of one pier (Fig. 8a).
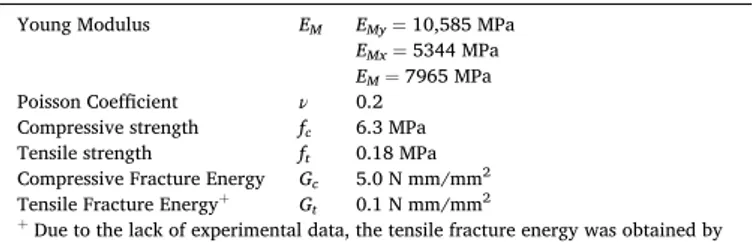
Table 2
Masonry material properties used in the FE model.
Young Modulus EM EMy =10,585 MPa EMx =5344 MPa EM =7965 MPa Poisson Coefficient ν 0.2
Compressive strength fc 6.3 MPa
Tensile strength ft 0.18 MPa
Compressive Fracture Energy Gc 5.0 N mm/mm2
Tensile Fracture Energy+ G
t 0.1 N mm/mm2
+Due to the lack of experimental data, the tensile fracture energy was obtained by performing preliminary numerical inverse analysis with the experimental results of [28].
As a consequence, the numerical model using the mean value EM =7965 MPa (about 75% of EMy) better approximates the elastic stiffness of
Phase 1; likewise, it was expected that the smaller value of the Young Modulus EMx (5344 MPa ≈ 0.5 EMy) better approximates the
experi-mental curve of Phase (2) (Fig. 13b).
Fig. 14a and b show the crack patterns of the wall specimen strengthened with a steel profile type HEA140, used in the experimental test, and with a larger profile (HEA240), respectively, with the attempt to restore also the initial stiffness of the squat original wall [11].
Fig. 14 evidences the capability of the model in reproducing the experimental cracks in the masonry material surrounding the shear dowels, in both spandrel and right pier. The crack width (Ecw1), was
estimated as the product of the cracking tensile strain by the crack bandwidth. It is also observed, that the compressive strut in the right pier led to a high concentration of tensile stresses orthogonal to the strut and the consequent “stair-step” type cracks (Fig. 14a and b). The cracks at the piers’ base and the principal stresses (Fig. 14a and c) evidence dominant rocking behaviour for the wall strengthened with the steel profile HEA140. When the stiffer profile HEA240 is used, the cracks and principal stresses in Fig. 14b and d evidence severe damage in the ma-sonry wall due to tensile stresses in the left pier and at the spandrel level, thus leading to a brittle response, as also shown the curve shear force (V) – lateral displacement (δ) curve of Fig. 15a.
4.6. Effectiveness of the steel frame technique
Further analyses were carried out using the material properties of
Table 2 and with the lower Young Modulus EMx =5344 MPa, with the aim of comparing the responses of a Solid Wall (SW) against a wall with a door opening (Perforated Wall, PW) and the walls with openings reinforced with the steel ring-frame system type HEA140 and H240 (Perforated Wall with Frame, PWF). Fig. 15a and b show the shear ca-pacity curves of these models and the variation of elastic stiffness of the analysed walls. The main results are summarized in Table 3 which shows the maximum peak loads (Vmax) and initial stiffness calculated at
a lateral displacement δ = 0.25 mm (Kd=0.25mm) along with the variation
of the strength and stiffness of the walls with respect to the solid one (SW). It can be observed that a steel ring-frame with a profile with small cross-section and moment of inertia (i.e., PWF HEA140) restores only 45% of the original solid wall’s stiffness (ksw), and that a profile type
with larger cross-section (PWF HEA240) restores only 50% of ksw.
Moreover, both profiles are capable of restoring the wall in-plane strength but not the initial stiffness. It should be also noted that the wall with steel frame’s HEA240 profile shows a rather brittle behaviour after reaching the peak load; this is caused by the contrast between the brittle nature of masonry and the high lateral stiffness of the steel ring- frame: masonry starts cracking at low values of lateral loads, while the steel frame demands for higher loads to be mobilized, which induced severe damage both in the masonry spandrel and piers (Fig. 14d)
The crack patterns of Fig. 15c,d show dominant rocking behaviour in both cases (SW and PW). It is also noticeable that the wall with opening (PW) seems to be separated in three rigid blocks: two piers and one spandrel, while the strengthened walls PWF-HEA140 and PWF-HEA240 (Fig. 14a,b) present diffuse cracks along spandrel and piers, in line with the experimental cracks shown in Fig. 9.
5. Concluding remarks
The paper focuses on the effectiveness of a ring steel frame to restore the stiffness and strength loss due to the introduction of a new opening
) b ( ) a ( -2000 -1500 -1000 -500 0 500 -4 -3 -2 -1 0 1 2 3 4 N [kN] ηx(mm)
k
x= 685 kN/mm tensile action compressive actionFig. 12. Definition of no-tension spring at the masonry-to-steel frame interface (a) and corresponding constitutive law (b).
(a) (b) 0 50 100 150 200 0 2 4 6 8 10 V [k N] δ [mm] Numerical curve, EMy=10585MPa Numerical curve, EM=7965MPa Numerical curve, EMx=5344MPa Exp Env (+Load, Phase 2) Exp Env (-Load, Phase 1)
0 10 20 30 40 50 0 0.1 0.2 0.3 0.4 0.5 V [k N ] δ [mm] Numerical curve, EMy=10585MPa Numerical curve, EM=7965MPa Numerical curve, EMx=5344MPa Exp Env (+Load, Phase 2) Exp Env (-Load, Phase 1)
Fig. 13. Numerical vs experimental lateral load-displacement curves (a); zoom
in a masonry wall. The collaboration between the ring frame and the masonry was herein guaranteed by steel dowels dry-driven into cali-brated holes of the bricks. The proposed technique is easy to apply, non- invasive and removable.
On the basis of experimental and numerical results on a masonry wall
with a new door having an area of about 25% of the total area of the wall, the following outcomes can be drawn:
• The results show that the steel-ring frame with a relatively small moment of inertia (HEA140) was able to efficiently restore the in- plane lateral load and the displacement capacity of a solid wall with the same material properties. The strengthened wall presented a flexural response associated with a toe-crushing failure mode. Di-agonal cracks were distributed along the masonry piers due to the local shear actions of the dowels. Thus, the results demonstrated the effectiveness of the connection between the dry-driven steel dowels and the surrounding masonry. However, further experimental tests using different point-wise connections and spacing would contribute to evaluating the effectiveness of other techniques used in practice.
Fig. 14. Crack patterns of the perforated wall with steel frame HEA140 (a); Crack patterns of the perforated wall with steel frame HEA240 (b); principal stresses (c,
d) at a lateral displacement of 4 mm.
Fig. 15. Lateral load-displacement numerical curves (a); zoom-in of the elastic branch (b); numerical crack patterns for the models SW (c) and PW (d) at a lateral
displacement of 4 mm.
Table 3
Peak in-plane strength and initial stiffness of the models presented in Fig. 15(a).
SW PW PWF HEA140 PWF HEA240 Vmax [kN] 195.2 147.1
(− 25%) 206.5 (+6%) 254.8 (+30%) Kd=0.25mm [kN/mm] 436.0 184.5
•The experimental results of this paper provided useful information on the wall behaviour and allowed to validate the applicability of a nonlinear numerical model. Based on this validation, further nu-merical analyses were carried out on a solid wall, a wall with a new opening and a wall strengthened with a stiffer profile. Numerical results show that neither a stiff nor a more flexible profile are capable of restoring more than 50% of the original solid wall’s stiffness. Besides, the numerical models showed that a very stiff frame might lead to a more brittle response of the wall with opening, due to the sudden collapse of the masonry surrounding the frame, caused by the large shear stiffness of the strengthening steel frame.
•Finally, the present work evidences the rough approximation pro-vided by the simplified beam theory for the determination of the stiffness loss due to the introduction of a new opening. This is related to the many parameters that have to be taken into account for a correct evaluation of the stiffness; among them, it should be mentioned the effects of the spandrel in the piers boundary condi-tions or the spandrel contribution to the in-plane stiffness.
CRediT authorship contribution statement
M´onica.Y. O˜na Vera: Conceptualization, Formal analysis,
Investi-gation, Data curation, Writing - original draft, Visualization. Giovanni
Metelli: Conceptualization, Methodology, Validation, Resources,
Writing - review & editing, Project administration, Funding acquisition.
Joaquim A.O. Barros: Conceptualization, Methodology, Writing -
re-view & editing, Supervision. Giovanni A. Plizzari: Conceptualization, Methodology, Resources, Writing - review & editing, Supervision, Project administration, Funding acquisition.
Declaration of Competing Interest
The authors declare that they have no known competing financial interests or personal relationships that could have appeared to influence the work reported in this paper.
Acknowledgements
The financial support of the Italian Ministry of Education, University, and Research (MIUR) for the Doctoral Scholarship of the first author is gratefully acknowledged. The Authors would like to thank the techni-cians Andrea Delbarba, Augusto Botturi from laboratory Pietro Pisa and MSc Eng. Jennifer Rebuzzi, MSc Eng. Alessandro Mangano for their valuable help during the experimental activities.
References
[1] EN 1998-1. Eurocode 8: Design of structures for earthquake resistance - Part 1: General rules, seismic actions and rules for buildings. CEN, Bruxeles, 2004. [2] NTC-2018. Decreto Ministeriale 17/1/2018. Norme tecniche per le costruzioni.
Ministry of Infrastructures and transportations. G.U.S.O. n42 on 20/2/2018 [in italian]; 2018.
[3] Billi L, Laudicina F, Salvatori L, Orlando M, Spinelli P. Forming new steel-framed
openings in load-bearing masonry walls: design methods and nonlinear finite element simulations. Bull Earthq Eng 2019;5(17):2647–70.
[4] Ministry of Infrastructures and Transportation. Istruzioni per l’applicazione delle nuove norme tecniche per le costruzioni di cui al Decreto Ministeriale 17 Gennaio 2018. G.U. S.O. n. 35 of 11/2/2019 [in Italian]; 2018.
[5] Ona Vera MY, Metelli G, Barros JAO, Plizzari G. New openings in unreinforced masonry walls under in-plane loads: a numerical and experimental study. Int J Masonry Res Innov (in press); https://doi.org/10.1504/IJMRI.2020.10032221. [6] ICOMOS. International scientific committee for analysis and restoration of
structures of architectural heritage guidelines. Recommendations for the analysis, conservation and structural restoration of architectural heritage; 2003.
[7] Pugi F. Interventi nelle murature e nuova normativa sismica: aperture e cerchiature in murature portanti con telai in acciaio e in calcestruzzo armati, analisi conforme alla normativa NTC 2008, regione di Toscana: D.G.R. 606 del 21/06/2010) [in Italian], AEDES, ISBN 9788860555663; 2010.
[8] Mariani M. Particolari costruttivi nel consolidamento e restauro [in Italian], DEI, ISBN 9788849605105; 2014.
[9] Giuriani E. Consolidamento degli edifici storici [in Italian], UTET Scienze Technique, ISBN 978-8859807636; 2012.
[10] Proença J, Gago A, Vilas Boas A. Structural window frame for in-plane seismic
strengthening of masonry wall buildings. Int J Architect Heritage 2018;13(1): 98–113.
[11] Ona Vera MY. Local interventions in unreinforced masonry walls: new openings
and seismic retrofitting techniques. PhD Thesis. Italy: Universit`a degli Studi di Brescia; 2019.
[12] Frumento S, Magenes G, Morandi P, Calvi G. Interpretation of the experimental
shear tests on clay brick masonry walls and evaluation of q-factors for seismic design. Research Report EUCENTRE. Pavia: IUSS Press; 2009.
[13] Dolce M. Schematizzazione e modellazione degli edifici in muratura soggetti ad
azioni sismiche. L’Industria delle Costruzioni 1991;25:44–57 [in Italian].
[14] Lagomarsino S, Penna A, Galasco A, Cattari S. TREMURI program: an equivalent
frame model for the nonlinear seismic analysis of masonry buildings. Eng Struct 2013;56:1787–99.
[15] Gattesco N, Rinaldin G, Claudio A. Experimental and numerical characterization of
the cyclic behaviour of unreinforced and reinforced masonry spandrels. Proceedings of the 9th international masonry conference, Guimaraes-Portugal. 2014.
[16] Beyer K, Dazio A. Quasi-static monotonic and cyclic tests on composite spandrels.
Earthquake Spectra 2012;28(3):885–906.
[17] Beyer K, Dazio A. Quasi-static cyclic tests on masonry spandrels. Earthquake
Spectra 2012;28(3):907–29.
[18] Graziotti F, Magenes G, Penna A. Experimental cyclic behaviour of stone masonry
spandrels. Proceeding 15th WCEE, Beijing, China. 2012.
[19] Marini A, Giuriani E, Belleri A, Cominelli S. Dowel connections securing roof-
diaphragms to perimeter walls in historic masonry buildings and in-field testing for capacity assessment. Bull Earthquake Eng 2018;16(9):4001–25.
[20] Kallioras S, Guerrini G, Tomassetti U, Marchesi B, Penna A, Graziotti F, et al.
Experimental seismic performance of a full-scale unreinforced clay-masonry building with flexible timber diaphragms. Eng Struct 2018;161:231–49. [21] EN 772-1. Methods of test for masonry units. Part 1: Determination of compressive
strength. European Standards, CEN/TC. Brussels, Belgium; 2011.
[22] EN 1015-11. Methods of test for mortar for masonry – Part 11: Determination of flexural and compressive strength of hardened mortar. Brussells, Belgium; 2011. [23] EN 12390-13. Testing hardened concrete – Part 13: Determination of secant
modulus of elasticity in compression. Brussels, Belgium; 2013.
[24] EN 1052-1. Methods of test for masonry. Part 1: Determination of compressive strength. Brussels, Belgium; 2001.
[25] EN 1052-3. Methods of test for masonry. Part 3: Determination of initial shear strength. Brussels, Belgium; 2002.
[26] EN 10025-1. Hot rolled products of structural steels. Part 1: General technical delivery conditions; 2015.
[27] Messali F, Metelli G, Plizzari G. Experimental results on the retrofitting of hollow brick masonry walls with reinforced high performance mortar coatings. Constr Build Mater 2017;141(15):619–30. https://doi.org/10.1016/j.
conbuildmat.2017.03.112.
[28] Facconi L, Conforti A, Minelli F, Plizzari G. Improving shear strength of
unreinforced masonry walls by nano-reinforced fibrous mortar coating. Mater Struct 2013;48:2557–74.
[29] DIANA FEA. Finite Elemen Program, user’s manual v.10.2, The Netherlands; 2018.
[30] Lourenço P. Computational strategies for masonry modelling. PhD Thesis. Delft-
The Netherlands: Delft University of Technology; 1996.
[31] Medeiros P, Vasconcelos G, Lourenço P, Gouveia J. Numerical modelling of non-
confined and confined masonry walls. Constr Build Mater 2013;41:968–76.
[32] Rots J, Messali F, Esposito R, Jafari S, Mariani V. Computational modelling of
masonry with a view to groningen induced seismicity, Structural Analysis of Historical Constructions. Proceedings of the 10th international conference on structural analysis of historical constructions, SAHC. 2016.
[33] Hordijk D. Local approach to fatigue of concrete. PhD Thesis. Delft, The
Netherlands: Delft University of Technology; 1991.
[34] Rots J. Computational modelling of concrete fracture. PhD Thesis. Delft-The
Netherlands: Delft University of Technology; 1988.
[35] Rots J. Structural masonry: an experimental/numerical basis for practical design rules. AA Balkema, ISBN 9789054106807; 1997.
[36] Lourenço P. Recent advances in masonry structures: micromodelling and
homogenization. London: Imperial College Press; 2009. [37] CEB-FIP Model Code 90, Thomas Telford Ltd, UK; 1993.
![Fig. 3. Schematization of the steel frame detailing. All dimensions are in [mm].](https://thumb-eu.123doks.com/thumbv2/123dokorg/5562694.66335/4.892.68.424.712.1009/fig-schematization-steel-frame-detailing-dimensions-mm.webp)