Università degli Studi di Salerno
DIPARTIMENTO DI SCIENZE ECONOMICHE E STATISTICHE
Annamaria Nese* – Niall O’Higgins**
I
N ANDO
UT OF THEC
APITALIAS
AMPLE:
E
VALUATINGA
TTRITIONB
IASWORKING PAPER 3.174
Dicembre 2005
*CELPE Centro Interdipartimentale di Economia del Lavoro e Politica Economica - Università degli Studi di Salerno - Via Ponte don Mellillo – 84084 Fisciano (Sa)
**CSEF Centre for Studies in Economics and Finance - Department of Economics University of Salerno - 84084 Fisciano (SA), Italy - nohiggins@unisa.it
1. Introduction... 3
2. The nature of the Capitalia sample survey. A comparison with the data from the Censi of Industrial production. ... 4
3. Panel Attrition in the Capitalia sample ... 6
3.1 The Capitalia Panel ... 7
3.2 Summary statistics... 11
3.3 The Process of Attrition: Probit analysis... 14
4. Panel Attrition in the Capitalia sample. A simple test. ... 17
4.1 A simple test of sample selection bias... 18
5. Conclusions... 21
References... 23
1. Introduction
The Capitalia1 sample survey of manufacturing firms in Italy represents a potentially important source of panel data on Italian firms. To date 8 waves have been released the most recent of which takes the survey upto the year 2000. In each wave, data is collected for a three year period and resampling of the same firms allows the construction of a firm panel over a much longer period. The composition of such a panel for the 5th, 6th 7th and 8th waves covering the period 1989-2000 inclusive was undertaken as part of the PRIN 2003 research project “Metodi e applicazioni per la valutazione delle politiche del lavoro e di aiuto alle imprese”.
In this paper, the characteristics of the sample are considered. In particular, sample entry and exit behaviour are studied in order to gain some understanding of the potential for using the database constructed at the University of Salerno for undertaking panel studies of firms over 2 or more waves of the survey. Such panels would be useful in many contexts, for example, in gaining a better understanding of the impact of industrial policies on indicators of firm success than has thusfar been possible with the analysis of single waves of the sample. Given the unique richness of the database in terms of the range of qualitative as well as quantitative information on Italian firms which it contains, the potential uses and usefulness of a panel dataset constricted from the Capitalia sample are extensive.
Panel attrition, however, represents a significant potential obstacle to such a use of the sample. Firms exit the sample and are replaced (more or less). The nature of the exit (and to some extent replacement) process will influence the extent to which a panel of firms constructed over more than one wave of the survey may be relied upon to produce unbiased estimates of the parameters of interest in a model of, for example, the impact of subsidies on firm performance. In this paper an attempt is made to throw light on this issue by analysing these processes.
1
In the following section we take a first look at the data, providing some descriptive statistics on the 5th to 8th waves of the Capitalia sample and comparing it to information drawn from the Censi of Industrial production of 1991 and 2001. In section 3, the problem of panel attrition is considered in general as well as in the context of the Capitalia data. In section 4 a test for attrition bias suggested by Verbeek & Nijman (1992) is implemented. Finally, section 5 reports our conclusions.
2. The nature of the Capitalia sample survey. A comparison with the data from the Censi of Industrial production.
This paper considers the 5th, 6th, 7th and 8th waves of the Capitalia survey undertaken in 1991, 1994, 1997 and 2000 respectively. The survey covers a sample of firms with between 11 and 500 employees and a census of firms with a workforce of over 500. Information is collected in two parts, a qualitative questionnaire administered to firms and quantitative balance-sheet data collected from firms covering a three year period. Although small changes have been introduced in each wave of the survey, the same basic structure has been adopted since the 5th wave in 1989 allowing, in principle, the construction of time series information on numerous variables. In each wave around 4500 fims are included (usually a slightly smaller number for the balance-sheet data) which represents (usually) a little under 5% of the total number of manufacturing firms2. The sample is stratified such that larger firms are much more likely to be sampled; indeed, for firms of over 500 workers a census is actually taken. Table 2.1 reports the size distribution of firms in the samples and, for comparison purposes the size distribution of firms drawn from the Censi of
2
Although if one considers the size of the sample in relation to either employment or output, the figure is closer to 10% of the manufacturing total as is
1991 and 2001 the first of which was used to construct the Capitalia samples3. TABLE 2.1 % of firms No. of employees 1991 (5th wave) 1994 (6th wave) 1997 (7th wave) 2000 (8th wave) Capitalia Sample 11-19 0.5 14.2 21.6 33.3 20-49 19.2 20.5 41.0 42.5 50-249 41.8 33.6 26.5 17.2 250+ 38.6 31.8 10.9 6.9
Total number of firms 4156 5415 4497 4680
Censi 1991 2001
11-19 59.0 58.5
20-49 28.5 28.5
50-249 10.8 11.4
250+ 1.7 1.6
Total number of firms (with at least 10 employees)
97,165 95,017 Capitalia sample as % of 1991 Census firms
by firm size 1991 1994 1997 2000 (% of 2001 Census) 11-19 0.03 1.34 1.69 2.81 20-49 2.87 4.00 6.66 7.35 50-249 16.52 17.32 11.33 7.41 250+ 98.71 105.85 30.23 21.36
Total number of firms 4.28 5.57 4.63 4.93
Clearly small firms are relatively underrepresented in the sample. It may be observed however, that over time, their relative representation has increased substantially. In the fifth wave, firms
3
In practice, the first Capitalia sample considered here - the fifth wave undertaken in 1991 – was based on the Chambers of Commerce database of small and medium sized enterprises (CERVED).
with fewer than 20 employees were virtually absent. This is perhaps due to the fact that the sample was drawn from the CERVED database in which possibly very small firms of under 20 workers are severely underrepresented given the necessary registration process. At the other end of the scale, the 5th and 6th waves included a practical census of firms with at least 250 workers4. Subsequently, the percentage of large firms has fallen off fairly dramatically as the census was restricted to firms with over 500 workers.
3. Panel Attrition in the Capitalia sample
Missing data represents an important issue in econometrics. In particular, in panel surveys, observation units not only may decide not to answer specific questions, but they are also likely to drop out of the panel between two consecutive waves. This problem is known as “attrition”.
There is huge literature focusing on the consequences of panel attrition (e.g. Hausman & Wise, 1979; Little & Rubin, 1987; Fitzgerald et al., 1998; Rendtel et al., 2004; Dennis-Rick Li, 2003; Liao, 2006; Flossmann, 2006) for the validity of estimates based on such surveys; the focus point is the mechanism causing attrition.
In particular, if the mechanism causing non response is random, so that the lost observation units and the remaining ones exhibit similar patterns, panel attrition affects only the representativeness of the original sample, but it does not cause biased estimates. However, if panel attrition is not random, but, in particular, the factors which determine non response are correlated with the issue being analysed by the researcher, attrition may cause non response bias.
This section investigates the presence and the likely consequences of attrition in the Capitalia sample reporting how the
4
Possibly the figure of over 100% for the 6th wave is due to the growth of firms between the date of the census (1991) and the date of the survey (1994). Another possibility is that in this wave, firms are included in both questionaire and
sampled firms retained in the panel differ from the respondents lost. In particular, the following section compares the size distribution of firms in two-wave panels with firms in the cross-section; section 3.2 displays summary statistics, section 3.3 contains probit regressions of the probability that firms drop out or enter the panel in each of the following waves: wave 5 (years 1989-1991), 6 (years 1992-1994), 7 (years 1995-1997) and 8 (years 1998-2000).
3.1 The Capitalia Panel
In practice there are several sources of data loss which occur in constructing a panel from the sample survey waves. First, before one actually comes to constructing the panel itself, not all firms can be included because, although included in the sample with information from the questionnaire or from balance-sheets, for some firms information is only provided for one but not both of these. In the seventh and eighth waves the firms for which balance sheet data were collected are a subsample of firms who completed the questionaire, in the fifth and sixth, the methodology is a little different with overlapping samples being collected. That is, in these waves some firms are included with only information on balance sheet data, others with only questionaire data and third group comprise firms for which information was collected from both sources. Figure 1 illustrates this.
Thus, a first source of data loss arises from the exclusion of firms for which information is incomplete in the sense that either the questionaire data or the balance sheet data is entirely absent from the sample. This issue is analysed in more detail below; however, in order to get an idea of the impact on the samples, table 3.1.1 compares the size distribution of firms in the complete sample with those for whom information is available from both (questionaire and balance sheet) sources. For the most part there is not a huge difference between the distributions apart from the case of the 6th wave where the number of large firms is almost halved in the reduced sample, providing further support for the idea that
some firms at least were double counted in the the full sample. More generally the number of very small firms drops further in all waves. TABLE 3.1.1 % of firms No. of employees 1991 (5th wave) 1994 (6th wave) 1997 (7th wave) 2000 (8th wave) Capitalia Sample Full sample Q & B Full sample Q & B Full sample Q & B Full sample Q & B 11-19 0.5 0.1 14.2 9.7 21.6 18.0 33.3 31.0 20-49 19.2 20.6 20.5 24.1 41.0 40.2 42.5 44.4 50-249 41.8 42.6 33.6 47.3 26.5 29.8 17.2 18.1 250+ 38.6 36.8 31.8 18.9 10.9 12.0 6.9 6.4 Total number of firms 4156 3823 5415 3522 4497 3688 4680 4004
What then is the cause of incomplete information? Either data was not sought: solicited (in the case of the questionnaire) or collected (in the case of balance sheets); or was not provided - firms declined to respond to the questionnaire or information was not available on balance sheets. Without further information from Capitalia (or Mediocredito) it is not possible to know which of these is responsible.
On the basis of the sample for which full information was available, a panel was constructed. At each wave a large proportion (roughly betewen 2/3 and 3/4) of firms dropped out Table 3.1.2 again reports the size distribution of firms in panels constructed from 2 successive waves5 compared in this case to the full information samples from each successive wave. Two principal
5
Given the very high rate of panel attrition, it did not appear useful to constuct panels with more than two waves. The appendix includes full descriptive statistics, however, it may be noted here that only for only 132 firms is full information available on all four waves.
points are worth observing. Survival in the panel does not seem to be closely related to firm size, however, it is very clear that there is a substantial degree of variation in firm size for survivors on the panel particularly for the 5th-6th wave. For the 5th and 6th waves, the size distribution of the panel (5th-6th and 6th-7th respectively) is reasonably close to the original size distribution. This is not true of the 7th wave (vis-a-vis the 6th-7th panel) and the 8th wave (vis-a-vis the 7th-8th) panel. That is, the size distribution for the later panels reflects the size distribution of the earlier rather than later cross-section of firms. TABLE 3.1.2 % of firms No. of employees Size in 5th wave
Size in 6th wave Size in 7th wave Size in 8th wave 5th wave 5th & 6th wave 6th wave 6th & 7th waves 7th wave 7th & 8th waves 8th wave 11-19 0.1 0.1 8.4 9.7 4.5 4.8 18.0 19.8 15.8 31.0 20-49 20.6 15.2 21.0 24.1 20.2 19.8 40.2 42.0 43.4 44.4 50-249 42.6 41.0 46.7 47.3 46.2 45.0 29.8 27.2 29.8 18.1 250+ 36.8 43.7 23.9 18.9 29.1 30.4 12.0 11.1 11.1 6.4 Total number of firms 3823 1765 3522 749 3688 1031 4004
The question arises why did firms drop out of the panel? Several alternatives are possible. First, it is possible that information was not solicited on the part of Capitalia/Mediocredito at the successive round. Given the extremely high rate of attrition, it seems likely that this is at least partially responsible for panel attitrition – after all, it was never the stated intention of Mediocredito or Capitalia to create a complete panel dataset on firms. Second firms may not have been willing or able to provide responses which in turn may depend on several different factors: • The firm made a decsion not to respond a second time for
whatever reason;
• The firm no longer (effectively) exists because it has been taken over or merged with another.
Once again, without further information from Capitalia itself it is not possible to know the relative importance of each of these possibilities
Finally, as we will see in more detail below, a third source of data loss is due to incomplete responses to either the questionaire or balance sheet data files.
3.2 Summary statistics
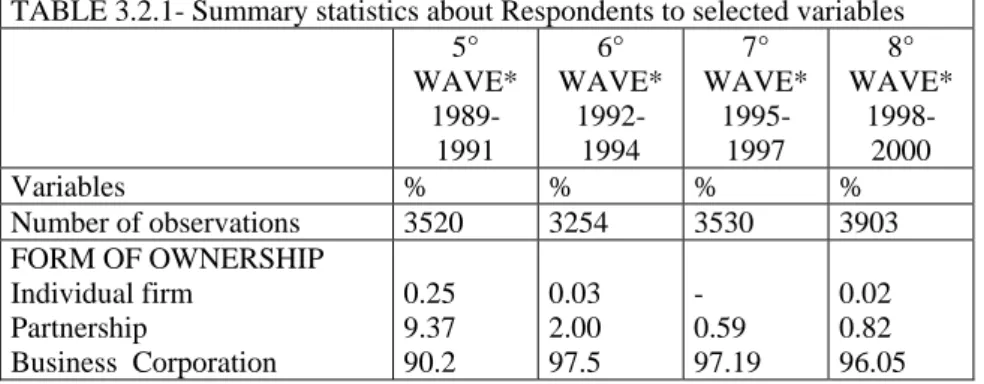
Full descriptive statistics on firms in each wave and in the Capitalia panel are reported in the Appendix, in this section, we limit ourselves to a comparison of the characteristics of firms retained in two consecutive waves of the panel with the characteristics of the firms lost. In particular, in the first column of table 3.2.1 statistics are displayed concerning the respondents to selected variables, both in the questionnaire and in the balance sheet, in the fifth wave, column 2 regards the sixth wave, and so on.
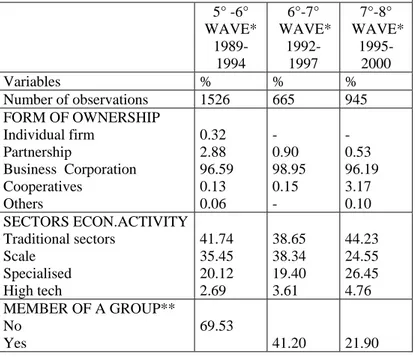
Table 3.2.2, in column 1, reports summary statistics about respondents in the fifth wave that were interviewed again in the sixth wave and answered to all the specific questions; column 2 concerns firms “included” and “respondent” in the sixth and in the seventh waves; in column 3 are reported data for firms “included” and “respondent” in the seventh and in the eighth wave.
TABLE 3.2.1- Summary statistics about Respondents to selected variables 5° WAVE* 1989-1991 6° WAVE* 1992-1994 7° WAVE* 1995-1997 8° WAVE* 1998-2000 Variables % % % % Number of observations 3520 3254 3530 3903 FORM OF OWNERSHIP Individual firm Partnership Business Corporation 0.25 9.37 90.2 0.03 2.00 97.5 - 0.59 97.19 0.02 0.82 96.05
Cooperatives Others 0.11 0.05 0.37 0.06 2.15 0.06 3.02 0.08 SECTORS ECON.ACTIVITY Traditional sectors Scale Specialised High tech 43.03 34.97 19.34 2.64 43.02 34.70 17.85 4.42 41.98 27.17 25.58 5.27 52.96 18.29 23.93 4.82 MEMBER OF A GROUP** No Yes 0.1-10% 10 - 20% 30 - 50% > 50% 70.14 0.45 0.36 2.18 26.84 33.37 27.39 19.57 CONSORTIUM 17.04 10.26 10.23 10.09 RECEIVED STATE FINANCIAL INCENTIVES 53.35 44.62 42.80 40.92
YEAR FIRM FOUNDED*** 967 (29.54) 1969 (19.86) 1972.87 (18.68) 1975 (18.40) NUM. OF EMPLOYEES (third year) 364.08 (691.04) 186.13 (558.69) 135.73 (404.01) 75.85 (263.44) ROI****(third year) 0.09 (0.08) 0.07 (0.1) 0.07 (0.09) 0.06 (0.07) Notes:
* In the fifth wave missing data are labelled with “0”, in the seventh wave missing data are labelled with “9”, in the other two waves mainly with “-1”. ** In the fifth wave there is no distinction between firms not answering and firms not belonging to a group.***The sample does not include observations reporting errors on the year of foundation (9 variables have been excluded in wave 5, 4 variables in wave 8); values “0” have been considered as missings;.*** *Roi= Ro/Total assets. In the fifth wave, “Ro” was not available so that it has been obtained as difference between added value and labour cost; the values 0 of the relevant variables have been considered as missings.
The data in table 3.2.1 show that sampled firms, respondent in each wave, are mainly “business corporations”, working in traditional sectors. The percentage of firms belonging to a group decreases in the eight wave, while the share of firms in a consortium is higher in the fifth wave. The “ROI” value does not greatly vary among the four waves, while the decrease of the mean number of employees is very impressive. Finally, it is interesting to note that the percentage of firms that received financial state incentives is more than the fifty percent only in the fifth wave.
Let us compare the data reported in table 3.2.2 with those in table 3.2.1. What surprisingly emerges is that the share of firms that had received financial support from the government, included and respondent in the 6th-7th wave panel, is now higher than fifty percent; the other interesting features observed for the 6th-7th wave panel, are the increase in firms belonging to a group, firms in the scale sector and above-all the mean number of employees per firm.
TABLE 3.2.2- Summary statistics about respondents to selected variables in two consecutive waves
5° -6° WAVE* 1989-1994 6°-7° WAVE* 1992-1997 7°-8° WAVE* 1995-2000 Variables % % % Number of observations 1526 665 945 FORM OF OWNERSHIP Individual firm Partnership Business Corporation Cooperatives Others 0.32 2.88 96.59 0.13 0.06 - 0.90 98.95 0.15 - - 0.53 96.19 3.17 0.10 SECTORS ECON.ACTIVITY Traditional sectors Scale Specialised High tech 41.74 35.45 20.12 2.69 38.65 38.34 19.40 3.61 44.23 24.55 26.45 4.76 MEMBER OF A GROUP** No Yes 69.53 41.20 21.90
0.1-10% 10 - 20% 30 - 50% > 50% 0.59 0.39 2.42 27.06 MEMBER OF A CONSORTIUM 18.61 10.68 11.42 RECEIVED STATE FINANCIAL INCENTIVES 57.86 51.58 42.01
YEAR FIRM FOUNDED*** 967.79 (25.74) 1966.77 (20.32) 1972.57 (17.68) NUM. OF EMPLOYEES (third year) 366.65 (589.50) 228.70 (441.30) 106.46 (248.50)
ROI**** (third year) 0.09 (0.07)
0.07 (0.08)
0.07 (0.07)
Notes: see notes to table 3.1.1
The most important pattern exhibited by the 5th-6th wave panel when compared to wave 5 respondents is an increase in the share of “business corporations” and in the probability of having received state financial incentives.
Finally, when we consider the 7th-8th wave panel, the consequences of attrition on the sample composition seems to be less significant: what one can observe is a lower percentage of firms belonging to a group and the reduction of firm size.
3.3 The Process of Attrition: Probit analysis
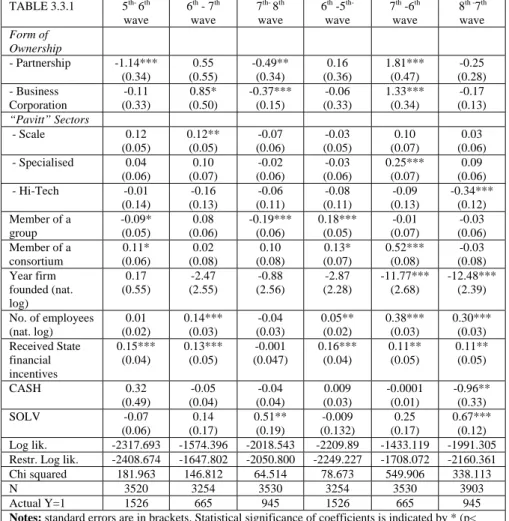
Separate regressions were conducted to predict whether sampled firms in one wave were observed in the following wave, reporting complete data on selected variables. Two problems are not considered at this stage in the research: firstly, we do not investigate the likely correlation between non response in two consecutive waves; secondly, we do not distinguish between different sources of data loss.
The results of the probit regressions are reported in table 3.3.1. In particular, the results in the first column have been obtained comparing wave 5 respondents “included” at wave 6, and wave 5 respondents “lost” at wave 6.
The impact both of the number of employees and of state financial incentives in predicting the probability of remaining in the sample is very interesting (see columns 1, 2 and 3 in table 3.3.1). More specifically, the coefficients on these variables are almost always significant and exhibit the same sign (with the exception of the 7th-8th wave). These results are confirmed considering the estimates of the probability of entering the sample reported in the column 4, 5, 66.
The other results may be summarised as follows. The members of a consortium or of a group report higher probabilities both of entering and of remaining in the 5th-6th wave panel, the Pavitt sector also significantly affects the composition of the 6th-7th wave panel, while the variable “SOLV7” significantly influences the probability both of leaving and of entering waves 7 and 8.
As a consequence, one can summarize the evidence reported in this section by underlining that significant differences have been found for respondents lost and respondents “included” across different variables usually used in literature to characterize firm profiles. The most important feature, however, is that the firms retained in two consecutive waves in the panel are more likely to have received financial support from the government.
6
In the fourth column, the results concern the probability that respondents “found” at the sixth wave were already in the panel in the fifth wave; in the column 5, the results concern the probability that respondents “found” at the wave 7 were already in the panel in the wave 6; column 6 concerns the waves 7 and 8.
7
It must be noted that a significant number of firms (almost 400) in the fifth and in the eight wave exhibit “unusual values” for CASH and for SOLV, in particular, very high values for CASH and negative values for SOLV (CASH, SOLV and other variables are defined in the tables). However, in this first step of the research, we retained these observations in the sample since their exclusion does not affect our main results.
TABLE 3.3.1 5th- 6th wave 6th - 7th wave 7th- 8th wave 6th -5 th-wave 7th -6th wave 8th -7th wave Form of Ownership - Partnership -1.14*** (0.34) 0.55 (0.55) -0.49** (0.34) 0.16 (0.36) 1.81*** (0.47) -0.25 (0.28) - Business Corporation -0.11 (0.33) 0.85* (0.50) -0.37*** (0.15) -0.06 (0.33) 1.33*** (0.34) -0.17 (0.13) “Pavitt” Sectors - Scale 0.12 (0.05) 0.12** (0.05) -0.07 (0.06) -0.03 (0.05) 0.10 (0.07) 0.03 (0.06) - Specialised 0.04 (0.06) 0.10 (0.07) -0.02 (0.06) -0.03 (0.06) 0.25*** (0.07) 0.09 (0.06) - Hi-Tech -0.01 (0.14) -0.16 (0.13) -0.06 (0.11) -0.08 (0.11) -0.09 (0.13) -0.34*** (0.12) Member of a group -0.09* (0.05) 0.08 (0.06) -0.19*** (0.06) 0.18*** (0.05) -0.01 (0.07) -0.03 (0.06) Member of a consortium 0.11* (0.06) 0.02 (0.08) 0.10 (0.08) 0.13* (0.07) 0.52*** (0.08) -0.03 (0.08) Year firm founded (nat. log) 0.17 (0.55) -2.47 (2.55) -0.88 (2.56) -2.87 (2.28) -11.77*** (2.68) -12.48*** (2.39) No. of employees (nat. log) 0.01 (0.02) 0.14*** (0.03) -0.04 (0.03) 0.05** (0.02) 0.38*** (0.03) 0.30*** (0.03) Received State financial incentives 0.15*** (0.04) 0.13*** (0.05) -0.001 (0.047) 0.16*** (0.04) 0.11** (0.05) 0.11** (0.05) CASH 0.32 (0.49) -0.05 (0.04) -0.04 (0.04) 0.009 (0.03) -0.0001 (0.01) -0.96** (0.33) SOLV -0.07 (0.06) 0.14 (0.17) 0.51** (0.19) -0.009 (0.132) 0.25 (0.17) 0.67*** (0.12) Log lik. -2317.693 -1574.396 -2018.543 -2209.89 -1433.119 -1991.305 Restr. Log lik. -2408.674 -1647.802 -2050.800 -2249.227 -1708.072 -2160.361 Chi squared 181.963 146.812 64.514 78.673 549.906 338.113
N 3520 3254 3530 3254 3530 3903
Actual Y=1 1526 665 945 1526 665 945 Notes: standard errors are in brackets. Statistical significance of coefficients is indicated by * (p< 10%), ** (p < 5%) or *** (p < 1%). Regional dummies are included
(North-East, North-Ovest, Center, South). ROI=RO/total assets, CASH=net working capital/total current liabilities, SOLV=equity plus reserves/total assets8.
8
4. Panel Attrition in the Capitalia sample. A simple test.
Why is panel attrition important? Essentially, the non-random selection of the sample which panel attrition is likely to involve may lead to biased estimates of parameters in the estimation of econometric models based on the panel. The problem is one of incidental truncation and in the context of industrial policy examined below may be thought of as analogous to the sample selection problem in the evaluation of treatment effects. Stated simply, if the attrition of firms is related to (observed or unobserved) characteristics of firms which in turn influence the outcome indicator of interest, the impact of these characteristics on the survival (in the sample) of the firm may be ‘interpreted’ by the econometric model as the effects of observed characteristics on the outcome variable of interest. The issue is complicated further by the fact that survival of the firm on the market and therefore (at least potentially) in the sample may itself be a variable of interest. Here the reason for non-response becomes important. If it is simply a case of firms not being included in the sample on a random basis by Capitalia/Mediocredito, then the problem should not arise. However, if non-response is due in part to firm failure and to firm merger, the combination of these effects may confound estimates of the effect of say industrial policy. On the one hand, if it were simply the case that firms which drop out from the sample have either failed or simple not been re-selected (on a random basis) by the institution undertaking the survey, then attrition may be used as an instrument for firm failure and consequently the problem at least partially resolved. In the present case however, as well as not being (in all probability) randomly selected for follow up by the surveying institution, it is also the case that firm disappearance from the market can not be attributed to firm failure alone but may depend on mergers between firms which will invalidate the instrumental variable approach suggested above.
In what follows, we leave aside (for the present) the details of the nature of the attrition and concentrate on the implementation of a simple test for selection bias arising from non-random panel
attrition in the context of a simple model for evaluating industrial policy.
4.1 A simple test of sample selection bias
As noted above, panel attrition has received considerable attention in the econometrics literature over the years9. In this section, a simple test for attrition bias suggested by Verbeek & Nijman (1992) is implemented. Essentially, this involves estimating models based on cross section data, introducing a dummy variable to represent the presence of the firm in the full panel. Table 4.1.1 reports the results of this process in the estimation of simple models of the impact of firm subsidies on different indicators of importance for the 6th, 7th and 8th waves. The first coloumn for each wave reports the results of a probit estimation of the determinants of receiving a subsidy, whilst the remaining three waves estimate the deteminants of three measures of firm performance using OLS.
The key result to which we would wish to draw attention concerns the coefficients on the ‘panel dummy’ variable which is included to identify the existence of attrition bias in the parameter estimates10. It will be observed that these parameters are sometimes, albeit not invariably, statistically significant. This suggests that the presence of panel attrition bias cannot be ignored in the Capitalia sample. Further work will look at how to resolve this problem.
9
In addition to the references given above, one might also see Hal (1987) and Dionne et al (1998).
10
Note however that this does not control for attrition bias. In order to do so several approaches have been suggested (e.g. Kyriazidou, 1997; Dionne et al.
TABLE 4.1.1
6th wave 7th wave 8th wave
Financial Incentives
ROI CASH SOLV Financial Incentives
ROI CASH SOLV Financial Incentives
ROI CASH SOLV
Form of Ownership - Partnership 58 (.38) 1.35 (.92) .06 (.13) -.15 (.26) -.16 (.41) .36 (.68) -.31 (.29) -.51 (.60) .40 (.38) .02 (.26) -.07 (.11) -.22 (.26) -Business Corporation .79** (.37) 1.25 (.91) -.01 (.12) -.16 (.24) .01 (.40) .19 (.65) -.47* (.28) -.51 (.57) .70** (.31) .01 (.20) -.04 (.09) -.20 (.20) - Cooperative .52 (.49) .26 (.95) -.07 (.16) -.25 (.31) .36 (.42) -.69 (.66) -.41 (.28) -.57 (.58) .85*** (.33) -1.08*** (.22) -.11 (.09) -.30 (.22) “Pavitt” Sectors - Scale .10** (.05) .01 (.04) -.03* (.02) .03 (.03) .09* (.05) .06 (.04) .04** (.02) .04 (.06) .10* (.05) -.01 (.04) -.03* (.02) -.04 (.04) - Specialised .15** (.06) -.10** (.05) .07*** (.02) -.02 (.04) .10** (.06) .14*** (.04) .03* (.02) .00 (.03) .17*** (.05) .13*** (.04) .07*** (.02) .06 (.04) - Hi-Tech -.05 (.10) .01 (.08) .06* (.04) -.03 (.06) .05 (.09) .32*** (.08) .10*** (.03) .05 (.06) -.20** (.09) .55*** (.07) .27*** (.03) .40*** (.07) Member of a group -.13** (.05) -.10** (.04) -.04** (.02) .06* (.03) -.09* (.06) .02 (.04) -.00 (.02) .13*** (.03) -.22*** (.05) -.13*** (.04) -.01 (.02) .11*** (.04) Member of a consortium .42*** (.07) -.01 (.06) -.01 (.02) -.09** (.05) .31*** (.06) -.05 (.05) -.00 (.02) -.06 (.04) .44*** (.06) -.19*** (.05) -.01 (.02) -.04 (.04) Age of firm (nat.
log) -.05* (.03) -.01 (.02) .08*** (.01) .14*** (.02) .08*** (.03) -.03 (.02) .10*** (.01) .23*** (.02) -.04 (.03) -.07*** (.02) .09*** (.01) .26*** (.02) No. of employees (nat. log) .14*** (.02) -.14*** (.02) -.00 (.01) -.01 (.01) .18*** (.02) -.08*** (.02) .02*** (.01) .03* (.02) .35*** (.02) -.03 (.02) .01 (.01) .05** (.02) Received State financial incentives - -.00 (.03) -.03* (.01) .05* (.03) - .03 (.03) -.01 (.01) .07** (.03) - -.03 (.03) -.01 (.01) .19*** (.03) Panel attrition bias .21*** (.04) .01 (.03) .02* (.01) .07** (.03) .06 (.06) .01 (.05) .02 (.02) -.03 (.04) .09** (.05) -.03 (.03) .02 (.01) .08** (.03) (Pseudo-) R2 .04 .07 .03 .03 .05 .05 .05 .07 .07 .11 .06 .08 N 4287 3039 3441 3391 4479 3301 3681 3642 4650 3626 3996 3944
Note: standard errors are in brackets. Statistical significance of coefficients is indicated by * (p< 10%), ** (p < 5%) or *** (p < 1%). In addition to the coefficients reported here, estimates include regional dummies. The dependent variables in th OLS regressions were expressed in natural logarithms. The estimates are based on the full cross-section in each case for which observations were available.
5. Conclusions
In this paper we have looked at issues concerning the use of panel data derived from the Capitalia sample survey of Italian Manufacturing firms. The key result emerging is that it is unwise to implement panel data estimates on the basis of this sample without taking into consideration selection bias due to panel attrition.
More specifically, three sources of data loss occurred in constructing the Capitalia panel.
Firstly, the Capitalia panel was derived from the single waves excluding the firms for which both the questionnaire data and the balance sheet data were completely absent; on this point, it must be noted that the cause of incomplete information is unknown: either data was not required by Capitalia or was not provided by the firms.
Secondly, at each wave a large portion of firms dropped out of the panel, and we don’t know the cause of data loss: either firms were not re-interviewed by Capitalia at each stage or firms were unable (or unwilling) to answer.
Finally, some firms are excluded from the final sample by researchers because of missing data on specific variables.
As a consequence of the very high rate of non-random panel attrition, construction of panels of more than two waves is unwise.
In the paper we reported significant differences between the characteristics of the firms “included” in two consecutive waves of the panel and the characteristics of the firms “lost”; in particular, firms retained in the panel are more likely to have received financial aids by the government.
Finally, a test for attrition bias has suggested that the presence of panel attrition bias cannot be ignored in the Capitalia sample.
The procedure to adopt in order to resolve panel attrition bias will be the subject of further work.
References
Bagella M., Becchetti L., Londono Bedoya D.A., “ Investment and Export Subsidies in Italy: Who Gets Them and What Is Their Impact on Investment and Efficiency”, Rivista di Politica Economica, Marzo-Aprile 2004.
Dennis M.J., Rich L., - 2003 -“Effects of Panel Attrition on Survey Estimates”, Annual Meeting of the American Association for Public Opinion Research, Nashville, TN.
Dionne, G., Gagné, R. & Vanasse, C. – 1998 – “Inferring Technological Parameters from Incomplete Panel Data,”
Journal of Econometrics, Vol. 87, pp. 303-327.
Fitzgerald, J., Gottschalk, P. & Moffitt, R. – 1998 – “An Analysis of Sample Attrition in Panel Data: The Michigan Panel Study of Income Dynamics,” Journal of Human Resources, Vol. 33, no. 2, pp. 251-299.
Flossmann, A. L. – 2006 – “Accounting for Panel Attrition and Non response in GMM – Estimation: A Matching of Moments Approach, Mimeo.
Hausman, J.A. & Wise, D.A. – 1979 – “Attrition Bias in Experimental and Panel Data: The Gary Income Maintenance Experiment,” Econometrica, Vol. 47, no. 2, pp.455-473. Lia T.F., - 2006- “A Method for Analyzing Categorical Data with
Panel Attrition”, 2006 Methodology of Longitudinal Surveys Conference, University of Essex
Little, R.J.A., Rubin D.B. – 1987 – “Statistical Analysis and Missing Data”, John Wiley & Sons, Inc., New York, NY.
Kyriazidou, E. – 1997 – “Estimation of a Panel Data Sample Selection Model,” Econometrica, Vol. 65, no. 6, pp. 1335-1364.
Rendtel U. , Behr A., Bellgardt E., & Sisto J. – 2004- “Does Panel Attrition Disturb Comparative analysis with the European Community Household Panel (ECHP)?, Mimeo.
Vella, F. & Verbeek, M. – 1999 – “Two-step Estimation of Panel Data Models with Censored Endogenous Variables and Selection Bias,” Journal of Econometrics, Vol. 90, pp. 239-263.
Verbeek, M. & Nijman, T. – 1992 – “Testing for Selectivity Bias in Panel Data Models,” International Economic Review, Vol. 33, no. 3, pp. 681-703.
Appendix 5th WAVE 1989-1991 6th WAVE 1992-1994 7th WAVE 1995-1997 8thWAV E 1998-2000 Variables % Number of observations 4156 5415 4497 4680 FORM OF OWNERSHIP Individual firm Partnership Business corporation Cooperatives Others Number of observations 0.23 9.44 90.13 0.10 0.08 3823 0.09 14.43 85.00 0.38 0.09 4420 0.15 3.53 94.11 2.11 0.07 4496 0.02 0.09 96.03 2.96 0.06 4661 SECTORS ECON. ACTIVITY Traditional sectors Scale Specialised High Tech Number of observations 41.9 36.09 18.9 3.08 4156 45.65 33.41 16.80 4.14 5415 41.78 27.62 25.68 4.91 4497 52.22 18.14 24.34 5.29 4680 REGION Piemonte Valle d'Aosta Liguria Lombardia Trentino Veneto
Friuli Venezia Giulia Emilia Romagna Marche Toscana Umbria Lazio Campania Abruzzo Molise Puglia Basilicata Calabria Sicilia 11.84 0.20 2.40 30.86 1.05 16.13 3.53 12.13 3.60 6.27 1.20 3.43 2.60 2.11 0.20 0 0.20 0.27 1.15 11.16 0.17 1.38 29.09 1.23 14.06 3.30 13.13 4.45 8.85 1.50 3.18 3.13 2.10 0.28 0 0.47 0.3 1.23 9.96 0.09 1.11 29.29 0.91 14.21 3.27 11.16 4.00 10.38 0.87 2.02 2.82 2.13 0.33 2.85 0.42 0.27 2.58 9.29 0.13 0.99 27.28 0 11.92 2.76 12.22 4.69 12.03 1.58 2.55 4.56 2.40 0.26 3.50 0.28 0.41 2.27
Sardegna Number of observations 0.83 4080 0.95 5276 1.31 4497 0.88 MEMBER OF A GROUP No Yes 0.1- 10% 10 2-0% 30 - 50% > 50% Number of observations ^ 1.45 1.53 7.08 89.93 1172 68.26 31.74 4420 75.1 24.89 * * * * 4495 79.62 20.38 4671 MEMBER OF A CONSORTIUM Yes No Number of observations 16.87 83.10 3823 9.70 90.3 4214 10.02 89.98 4493 10.11 89.89 4660 STATE FINANCIAL INCENTIVES Yes No Number of observations 53.75 46.25 3823 40.61 59.39 4211 41.49 58.51 4488 40.55 59.45 4619 Mean (dev. Std.) YEAR OF FOUNDATION Number of observations 1967 (135.97) 3675 1967 (23.18) 4404 1973 (18.39) 4492 1979 (264.33) 4630 NUMBER OF EMPLOYES Number of observations 598.15 (2984.61) 4156 231.28 (1330.30) 4409 120.66 (373.58) 4483 87.76 (364.23) 4680
5th WAVE 1989-1991 5th-6th WAVE 1989-1994 5th-6th-7th wave 1989-1997 5th-6th-7th-8th wave 1989-2000 Variables % Number of firms 4156 2571 544 164 FORM OF OWNERSHIP Individual firm Partnership Business corporation Cooperatives Others Number of observations 0.23 9.44 90.13 0.10 0.08 3823 0.21 7.69 91.88 0.13 0.08 2378 0.39 5.24 94.17 0.19 - 515 0.63 1.90 97.47 - - 158 SECTORS ECON. ACTIVITY
Traditional sectors Scale Specialised High Tech Number of observations 41.9 36.09 18.9 3.07 4156 42.63 34.42 19.29 3.66 2571 37.68 38.05 20.77 3.49 544 39.63 34.15 24.39 1.83 164 REGION Piemonte Valle d'Aosta Liguria Lombardia Trentino Veneto
Friuli Venezia Giulia Emilia Romagna Marche Toscana Umbria Lazio Campania Abruzzo Molise Puglia Basilicata Calabria Sicilia Sardegna 11.84 0.20 2.40 30.86 1.05 16.13 3.53 12.13 3.60 6.27 1.20 3.43 2.60 2.08 0.20 0 0.20 0.27 1.15 0.83 10.87 0.20 1.85 31.63 1.10 14.85 4.06 12.92 3.78 6.66 1.26 3.62 2.52 2.28 0.16 0 0.20 0.27 1.06 0.71 13.97 0 2.05 39.11 0.56 14.90 3.17 10.43 2.98 6.70 0 2.42 0.37 1.49 0.19 0 0.19 0.19 0.74 0.56 12.96 0 0.62 41.97 1.23 14.20 2.47 10.49 4.94 8.02 0 1.85 0 1.23
Number of observations 4080 2539 537 162 MEMBER OF A GROUP No Yes 0.1- 10% 10 2-0% 30 - 50% > 50% Number of observations 1.45 1.53 7.08 89.93 1172 1.47 1.61 7.5 89.41 746 2.82 2.26 7.91 87.00 177 3.85 3.85 7.69 84.61 52 MEMBER OF A CONSORTIUM Yes No Number of observations 16.87 83.10 3823 17.62 82.38 2378 17.28 82.72 515 21.52 78.48 158 STATE FINANCIAL INCENTIVES Yes No Number of observations 53.75 46.25 3823 57.23 42.77 2378 62.13 37.87 515 71.52 28.48 164 Mean (Std. dev) Mean (Std. dev.) Mean (Std. dev) Media (Std. dev) YEAR OF FOUNDATION Number of observations 1967 (135.97) 3675 1967 (35.05) 2288 1965 (41.20) 498 1967 (21.99) 154 NUMBER OF EMPLOYES Number of observations 598.15 (2984.61) 4046 696.82 (3622.54) 2571 770.07 (1634.26) 544 718.78 (1422.60) 164
Variables 6thWAVE 1992-1994 6th-7th WAVE 1992-1997 6th-7th-8th WAVE 1992-2000 Number of firms 5415 927 258 FORM OF OWNERSHIP Individual firm Partnership Business corporation Cooperatives Others Number of observations 0.09 14.43 85.00 0.38 0.09 4420 - 6.99 92.78 0.22 - 887 - 1.20 98.80 - - 251 SECTORS ECON. ACTIVITY
Traditional sectors Scale Specialised High Tech Number of observations 45.65 33.41 16.80 4.14 5415 37.97 38.73 18.98 4.31 927 36.04 39.15 22.09 2.71 258 REGION Piemonte Valle d'Aosta Liguria Lombardia Trentino Veneto
Friuli Venezia Giulia Emilia Romagna Marche Toscana Umbria Lazio Campania Abruzzo Molise Puglia Basilicata Calabria Sicilia Sardegna Number of observations 11.16 0.17 1.38 29.09 1.23 14.06 3.30 13.13 4.45 8.85 1.50 3.18 3.13 2.10 0.28 0 0.47 0.3 1.23 0.95 5276 15.70 0.11 1.32 37.43 0.44 13.83 3.73 8.89 3.62 8.45 0.11 1.98 0.55 1.54 0.33 0 0.33 0.11 0.77 0.77 911 16.53 0 0.39 37.40 0.79 14.17 3.15 9.45 5.51 9.06 0 1.18 0.39 1.57 0.39 254 MEMBER OF A GROUP No 68.26 59.41 59.60
Number of observations 4420 887 250 MEMBER OF A CONSORTIUM No Number of observations 90.3 4214 89.14 838 13.69 241 STATE FINANCIAL INCENTIVES
Yes No Number of observations 40.61 59.39 4211 49.82 50.18 837 43.57 56.43 241 YEAR OF FOUNDATION Number of observations 1967 (23.18) 4404 1964.22 (24.41) 886 1964.36 (22.68) 251 NUMBER OF EMPLOYES Number of observations 231.28 (1330.30) 4409 263.96 (536.11) 889 258.12 (514.94) 251
7th WAVE 1995-1997 7-8th WAVE 1995-2000 Variables Number of firms 4497 1313 FORM OF OWNERSHIP Individual firm Partnership Business corporation Cooperatives Others Number of observations 0.15 3.53 94.11 2.11 0.07 4497 - 0.53 96.42 2.97 0.08 1313 SECTORS ECON. ACTIVITY
Traditional sectors Scale Specialised High Tech Number of observations 41.78 27.62 25.68 4.91 4497 43.94 25.06 26.58 4.42 1313 REGION Piemonte Valle d'Aosta Liguria Lombardia Trentino Veneto
Friuli Venezia Giulia Emilia Romagna Marche Toscana Umbria Lazio Campania Abruzzo Molise Puglia Basilicata Calabria Sicilia Sardegna Number of observations 9.96 0.09 1.11 29.29 0.91 14.21 3.27 11.16 4.00 10.38 0.87 2.02 2.82 2.13 0.33 2.85 0.42 0.27 2.58 1.31 4497 10.05 0 0.46 31.38 1.14 15.38 2.82 10.81 3.50 11.20 0.91 1.52 2.51 1.98 0.38 2.89 0.15 0.23 1.67 0.99 1313 MEMBER OF A GROUP No 75.11 78.45
Number of observations 4495 1313 MEMBER OF A CONSORTIUM No Number of observations 89.98 4493 89.03 1312 STATE FINANCIAL INCENTIVES
Yes No Number of observations 41.49 58.51 4488 41.30 58.70 1310 Mean (dev std.) YEAR OF FOUNDATION Number of observations 1973 (18.39) 4492 1973,45 (17.43) 1312 NUMBER OF EMPLOYEES Number of observations 120.66 (373.58) 4483 106.36 (287.76) 1311
WORKING PAPERS DEL DIPARTIMENTO
1988, 3.1 Guido CELLA
Linkages e moltiplicatori input-output. 1989, 3.2 Marco MUSELLA
La moneta nei modelli di inflazione da conflitto. 1989, 3.3 Floro E. CAROLEO
Le cause economiche nei differenziali regionali del tasso di disoccupazione. 1989, 3.4 Luigi ACCARINO
Attualità delle illusioni finanziarie nella moderna società. 1989, 3.5 Sergio CESARATTO
La misurazione delle risorse e dei risultati delle attività innovative: una valu-tazione dei risultati dell'indagine CNR- ISTAT sull'innovazione tecnologica. 1990, 3.6 Luigi ESPOSITO - Pasquale PERSICO
Sviluppo tecnologico ed occupazionale: il caso Italia negli anni '80. 1990, 3.7 Guido CELLA
Matrici di contabilità sociale ed analisi ambientale. 1990, 3.8 Guido CELLA
Linkages e input-output: una nota su alcune recenti critiche. 1990, 3.9 Concetto Paolo VINCI
I modelli econometrici sul mercato del lavoro in Italia. 1990, 3.10 Concetto Paolo VINCI
Il dibattito sul tasso di partecipazione in Italia: una rivisitazione a 20 anni di distanza.
1990, 3.11 Giuseppina AUTIERO
Limiti della coerenza interna ai modelli con la R.E.H.. 1990, 3.12 Gaetano Fausto ESPOSITO
Evoluzione nei distretti industriali e domanda di istituzione. 1990, 3.13 Guido CELLA
Measuring spatial linkages: input-output and shadow prices. 1990, 3.14 Emanuele SALSANO
1990, 3.15 Emanuele SALSANO
Investimenti, valore aggiunto e occupazione in Italia in contesto biregionale: una prima analisi dei dati 1970/1982.
1990, 3.16 Alessandro PETRETTO- Giuseppe PISAURO
Uniformità vs selettività nella teoria della ottima tassazione e dei sistemi tributari ottimali.
1990, 3.17 Adalgiso AMENDOLA
Inflazione, disoccupazione e aspettative. Aspetti teorici dell'introduzione di aspettative endogene nel dibattito sulla curva di Phillips.
1990, 3.18 Pasquale PERSICO
Il Mezzogiorno e le politiche di sviluppo industriale. 1990, 3.19 Pasquale PERSICO
Priorità delle politiche strutturali e strategie di intervento. 1990, 3.20 Adriana BARONE - Concetto Paolo VINCI
La produttività nella curva di Phillips. 1990, 3.21 Emiddio GALLO
Varianze ed invarianze socio-spaziali nella transizione demografica dell'Ita-lia post-industriale.
1991, 3.22 Alfonso GAMBARDELLA
I gruppi etnici in Nicaragua. Autonomia politica ed economica. 1991, 3.23 Maria SCATTAGLIA
La stima empirica dell'offerta di lavoro in Italia: una rassegna. 1991, 3.24 Giuseppe CELI
La teoria delle aree valutarie: una rassegna. 1991, 3.25 Paola ADINOLFI
Relazioni industriali e gestione delle risorse umane nelle imprese italiane. 1991, 3.26 Antonio e Bruno PELOSI
Sviluppo locale ed occupazione giovanile: nuovi bisogni formativi. 1991, 3.27 Giuseppe MARIGLIANO
La formazione del prezzo nel settore dell'intermediazione commerciale. 1991, 3.28 Maria PROTO
Risorse naturali, merci e ambiente: il caso dello zolfo. 1991, 3.29 Salvatore GIORDANO
1992, 3.30 Antonio LOPES
Crisi debitoria e politiche macroeconomiche nei paesi in via di sviluppo negli anni 80.
1992, 3.31 Antonio VASSILLO
Circuiti economici semplici, complessi, ed integrati. 1992, 3.32 Gaetano Fausto ESPOSITO
Imprese ed istituzioni nel Mezzogiorno: spunti analitici e modalità di relazio-ne.
1992, 3.33 Paolo COCCORESE
Un modello per l'analisi del sistema pensionistico. 1994, 3.34 Aurelio IORI
Il comparto dei succhi di agrumi: un caso di analisi interorganizzativa. 1994, 3.35 Nicola POSTIGLIONE
Analisi multicriterio e scelte pubbliche. 1994, 3.36 Adriana BARONE
Cooperazione nel dilemma del prigioniero ripetuto e disoccupazione invo-lontaria.
1994, 3.37 Adriana BARONE
Le istituzioni come regolarità di comportamento. 1994, 3.38 Maria Giuseppina LUCIA
Lo sfruttamento degli idrocarburi offshore tra sviluppo economico e tutela dell'ambiente.
1994, 3.39 Giuseppina AUTIERO
Un'analisi di alcuni dei limiti strutturali alle politiche di stabilizzazione nei LCDs.
1994, 3.40 Bruna BRUNO
Modelli di contrattazione salariale e ruolo del sindacato. 1994, 3.41 Giuseppe CELI
Cambi reali e commercio estero: una riflessione sulle recenti interpretazioni teoriche.
1995, 3.42 Alessandra AMENDOLA, M. Simona ANDREANO
The TAR models: an application on italian financial time series. 1995, 3.43 Leopoldo VARRIALE
1995, 3.44 A. PELOSI, R. LOMBARDI
Fondi pensione: equilibrio economico-finanziario delle imprese. 1995, 3.45 Emanuele SALSANO, Domenico IANNONE
Economia e struttura produttiva nel salernitano dal secondo dopoguerra ad oggi.
1995, 3.46 Michele LA ROCCA
Empirical likelihood and linear combinations of functions of order statistics. 1995, 3.47 Michele LA ROCCA
L’uso del bootstrap nella verosimiglianza empirica. 1996, 3.48 Domenico RANESI
Le politiche CEE per lo sviluppo dei sistemi locali: esame delle diverse tipo-logie di intervento e tentativo di specificazione tassonomica.
1996, 3.49 Michele LA ROCCA
L’uso della verosimiglianza empirica per il confronto di due parametri di po-sizione.
1996, 3.50 Massimo SPAGNOLO
La domanda dei prodotti della pesca in Italia. 1996, 3.51 Cesare IMBRIANI, Filippo REGANATI
Macroeconomic stability and economic integration. The case of Italy. 1996, 3.52 Annarita GERMANI
Gli effetti della mobilizzazione della riserva obbligatoria. Analisi sull’efficienza del suo utilizzo.
1996, 3.53 Massimo SPAGNOLO
A model of fish price formation in the north sea and the Mediterranean. 1996, 3.54 Fernanda MAZZOTTA
RTFL: problemi e soluzioni per i dati Panel. 1996, 3.55 Angela SPAGNUOLO
Concentrazione industriale e dimensione del mercato: il ruolo della spesa per pubblicità e R&D.
1996, 3.56 Giuseppina AUTIERO
The economic case for social norms. 1996, 3.57 Francesco GIORDANO
Sulla convergenza degli stimatori Kernel. 1996, 3.58 Tullio JAPPELLI, Marco PAGANO
1997, 3.59 Tullio JAPPELLI
The age-wealth profile and the life-cycle hypothesis: a cohort analysis with a time series of cross sections of Italian households.
1997, 3.60 Marco Antonio MONACO
La gestione dei servizi di pubblico interesse. 1997, 3.61 Marcella ANZOLIN
L’albero della qualità dei servizi pubblici locali in Italia: metodologie e risulta-ti conseguirisulta-ti.
1997, 3.62 Cesare IMBRIANI, Antonio LOPES
Intermediazione finanziaria e sistema produttivo in un’area dualistica. Uno studio di caso.
1997, 3.63 Tullio JAPPELLI
Risparmio e liberalizzazione finanziaria nell’Unione europea. 1997, 3.64 Alessandra AMENDOLA
Analisi dei dati di sopravvivenza. 1997, 3.65 Francesco GIORDANO, Cira PERNA
Gli stimatori Kernel per la stima non parametrica della funzione di regres-sione.
1997, 3.66 Biagio DI SALVIA
Le relazioni marittimo-commerciali nell’imperiale regio litorale austriaco nella prima metà dell’800.
I. Una riclassificazione delle Tafeln zur Statistik der Öesterreichischen Monarchie.
1997, 3.67 Alessandra AMENDOLA
Modelli non lineari di seconda e terza generazione: aspetti teorici ed evi-denze empiriche.
1998, 3.68 Vania SENA
L’analisi econometrica dell’efficienza tecnica. Un’applicazione agli ospedali italiani di zona.
1998, 3.69 Domenico CERBONE Investimenti irreversibili. 1998, 3.70 Antonio GAROFALO
La riduzione dell’orario di lavoro è una soluzione al problema disoccupazio-ne: un tentativo di analisi empirica.
1998, 3.71 Jacqueline MORGAN, Roberto RAUCCI New convergence results for Nash equilibria.
1998, 3.72 Rosa FERRENTINO
Niels Henrik Abel e le equazioni algebriche. 1998, 3.73 Marco MICOCCI, Rosa FERRENTINO
Un approccio markoviano al problema della valutazione delle opzioni. 1998, 3.74 Rosa FERRENTINO, Ciro CALABRESE
Rango di una matrice di dimensione K. 1999, 3.75 Patrizia RIGANTI
L’uso della valutazione contingente per la gestione del patrimonio culturale: limiti e potenzialità.
1999, 3.76 Annamaria NESE
Il problema dell’inefficienza nel settore dei musei: tecniche di valutazione. 1999, 3.77 Gianluigi COPPOLA
Disoccupazione e mercato del lavoro: un’analisi su dati provinciali. 1999, 3.78 Alessandra AMENDOLA
Un modello soglia con eteroschedasticità condizionata per tassi di cambio. 1999, 3.79 Rosa FERRENTINO
Su un’applicazione della trasformata di Laplace al calcolo della funzione asintotica di non rovina.
1999, 3.80 Rosa FERRENTINO
Un’applicazione della trasformata di Laplace nel caso di una distribuzione di Erlang.
1999, 3.81 Angela SPAGNUOLO
Efficienza e struttura degli incentivi nell’azienda pubblica: il caso dell’industria sanitaria.
1999, 3.82 Antonio GAROFALO, Cesare IMBRIANI, Concetto Paolo VINCI Youth unemployment: an insider-outsider dynamic approach. 1999, 3.83 Rosa FERRENTINO
Un modello per la determinazione del tasso di riequilibrio in un progetto di fusione tra banche.
1999, 3.84 DE STEFANIS, PORZIO
Assessing models in frontier analysis through dynamic graphics. 1999, 3.85 Annunziato GESUALDI
Inflazione e analisi delle politiche fiscali nell’U.E.. 1999, 3.86 R. RAUCCI, L. TADDEO
1999, 3.87 Rosa FERRENTINO
Sulla determinazione di numeri aleatori generati da equazioni algebriche. 1999, 3.88 C. PALMISANI, R. RAUCCI
Sulle funzioni circolari: una presentazione non classica. 2000, 3.89 Giuseppe STORTI, Pierluigi FURCOLO, Paolo VILLANI
A dynamic generalized linear model for precipitation forecasting. 2000, 3.90 Rosa FERRENTINO
Un procedimento risolutivo per l’equazione di Dickson. 2000, 3.91 Rosa FERRENTINO
Un’applicazione della mistura di esponenziali alla teoria del rischio. 2000, 3.92 Francesco GIORDANO, Michele LA ROCCA, Cira PERNA
Bootstrap variance estimates for neural networks regression models. 2000, 3.93 Alessandra AMENDOLA, Giuseppe STORTI
A non-linear time series approach to modelling asymmetry in stock market indexes.
2000, 3.94 Rosa FERRENTINO
Sopra un’osservazione di De Vylder. 2000, 3.95 Massimo SALZANO
Reti neurali ed efficacia dell’intervento pubblico: previsioni dell’inquinamento da traffico nell’area di Villa S. Giovanni.
2000, 3.96 Angela SPAGNUOLO
Concorrenza e deregolamentazione nel mercato del trasporto aereo in Italia. 2000, 3.97 Roberto RAUCCI, Luigi TADDEO
Teoremi ingannevoli. 2000, 3.98 Francesco GIORDANO
Una procedura per l’inizializzazione dei pesi delle reti neurali per l’analisi del trend.
2001, 3.99 Angela D’ELIA
Some methodological issues on multivariate modelling of rank data. 2001, 3.100 Roberto RAUCCI, Luigi TADDEO
Nuove classi di funzioni scalari quasiconcave generalizzate: caratterizzazio-ni ed applicaziocaratterizzazio-ni a problemi di ottimizzazione.
2001, 3.101 Adriana BARONE, Annamaria NESE Some insights into night work in Italy. 2001, 3.102 Alessandra AMENDOLA, Marcella NIGLIO
Predictive distributions of nonlinear time series models. 2001, 3.103 Roberto RAUCCI
Sul concetto di certo equivalente nella teoria HSSB. 2001, 3.104 Roberto RAUCCI, Luigi TADDEO
On stackelberg games: a result of unicity. 2001, 3.105 Roberto RAUCCI
Una definizione generale e flessibile di insieme limitato superiormente in ℜn
2001, 3.106 Roberto RAUCCI
Stretta quasiconcavità nelle forme funzionali flessibili. 2001, 3.107 Roberto RAUCCI
Sugli insiemi limitati in ℜm rispetto ai coni.
2001, 3.108 Roberto RAUCCI
Monotonie, isotonie e indecomponibilità deboli per funzioni a valori vettoriali con applicazioni.
2001, 3.109 Roberto RAUCCI
Generalizzazioni del concetto di debole Kuhn-Tucker punto-sella. 2001, 3.110 Antonia Rosa GURRIERI, Marilene LORIZIO
Le determinanti dell'efficienza nel settore sanitario. Uno studio applicato. 2001, 3.111 Gianluigi COPPOLA
Studio di una provincia meridionale attraverso un'analisi dei sistemi locali del lavoro. Il caso di Salerno.
2001, 3.112 Francesco GIORDANO
Reti neurali per l’analisi del trend: un approccio per identificare la topologia della rete.
2001, 3.113 Marcella NIGLIO
Nonlinear time series models with switching structure: a comparison of their forecast performances.
2001, 3.114 Damiano FIORILLO
Capitale sociale e crescita economica. Review dei concetti e dell'evidenza empirica.
2001, 3.115 Roberto RAUCCI, Luigi TADDEO
Generalizzazione del concetto di continuità e di derivabilità. 2001, 3.116 Marcella NIGLIO
2001, 3.117 Vincenzo VECCHIONE
Mutamenti del sistema creditizio in un’area periferica. 2002, 3.118 Francesco GIORDANO, Michele LA ROCCA, Cira PERNA
Bootstrap variable selection in neural network regression models. 2002, 3.119 Roberto RAUCCI, Luigi TADDEO
Insiemi debolmente convessi e concavità in senso generale. 2002, 3.120 Vincenzo VECCHIONE
Know how locali e percorsi di sviluppo in aree e settori marginali. 2002, 3.121 Michele LA ROCCA, Cira PERNA
Neural networks with dependent data. 2002, 3.122 Pietro SENESI
Economic dynamics: theory and policy. A stability analysis approach. 2002, 3.123 Gianluigi COPPOLA
Stima di un indicatore di pressione ambientale: un'applicazione ai comuni della Campania.
2002, 3.124 Roberto RAUCCI
Sull’esistenza di autovalori e autovettori positivi anche nel caso non lineare. 2002, 3.125 Maria Carmela MICCOLI
Identikit di giovani lucani.
2002, 3.126 Sergio DESTEFANIS, Giuseppe STORTI
Convexity, productivity change and the economic performance of countries. 2002, 3.127 Giovanni C. PORZIO, Maria Prosperina VITALE
Esplorare la non linearità nei modelli Path. 2002, 3.128 Rosa FERRENTINO
Sulla funzione di Seal.
2003, 3.129 Michele LA ROCCA, Cira PERNA
Identificazione del livello intermedio nelle reti neurali di tipo feedforward. 2003, 3.130 Alessandra AMENDOLA, Marcella NIGLIO, Cosimo VITALE
The exact multi-step ahead predictor of SETARMA models. 2003, 3.131 Mariangela BONASIA
La dimensione ottimale di un sistema pensionistico: means tested vs pro-gramma universale.
2003, 3.132 Annamaria NESE
2003, 3.133 Maria Lucia PARRELLA
Le proprietà asintotiche del Local Polynomial Bootstrap. 2003, 3.134 Silvio GIOVE, Maurizio NORDIO, Stefano SILVONI
Stima della prevalenza dell'insufficienza renale cronica con reti bayesiane: analisi costo efficacia delle strategie di prevenzione secondaria.
2003, 3.135 Massimo SALZANO
Globalization, complexity and the holism of the italian school of public fi-nance.
2003, 3.136 Giuseppina AUTIERO
Labour market institutional sistems and unemplyment performance in some Oecd countries.
2003, 3.137 Marisa FAGGINI
Recurrence analysis for detecting non-stationarity and chaos in economic times series.
2003, 3.138 Marisa FAGGINI, Massimo SALZANO
The reverse engineering of economic systems. Tools and methodology. 2003, 3.139 Rosa FERRENTINO
In corso di pubblicazione.
2003, 3.140 Rosa FERRENTINO, Roberto RAUCCI
Sui problemi di ottimizzazione in giochi di Stackelberg ed applicazioni in modelli economici.
2003, 3.141 Carmine SICA
In corso di pubblicazione.
2004, 3.142 Sergio DESTEFANIS, Antonella TADDEO, Maurizio TORNATORE The stock of human capital in the Italian regions.
2004, 3.143 Elena Laureana DEL MERCATO
Edgeworth equilibria with private provision of public good. 2004, 3.144 Elena Laureana DEL MERCATO
Externalities on consumption sets in general equilibrium. 2004, 3.145 Rosa FERRENTINO, Roberto RAUCCI
Su alcuni criteri delle serie a termini non negativi. 2004, 3.146 Rosa FERRENTINO, Roberto RAUCCI
Legame tra le soluzioni di Minty e di Stempacenhia nelle disequazioni varia-zionali.
2004, 3.147 Gianluigi COPPOLA In corso di pubblicazione.
2004, 3.148 Massimo Spagnolo
The Importance of Economic Incentives in Fisheries Management 2004, 3.149 F. Salsano
La politica monetaria in presenza di non perfetta osservabilità degli obiettivi del banchiere centrale.
2004, 3.150 A. Vita
La dinamica del cambiamento nella rappresentazione del territorio. Una mappa per i luoghi della Valle dell’Irno.
2004, 3.151 Celi
Empirical Explanation of vertical and horizontal intra-industry trade in the UK: a comment.
2004, 3.152 Amendola – P. Vitale
Self-Assessment and Career Choices: An On-line resource for the Univer-sity of Salerno.
2004, 3.153 A. Amendola – R. Troisi
Introduzione all’economia politica dell’organizzazione: nozioni ed applicazio-ni.
2004, 3.154 A. Amendola – R. Troisi
Strumenti d’incentivo e modelli di gestione del personale volontario nelle organizzazioni non profit.
2004, 3.155 Lavinia Parisi
La gestione del personale nelle imprese manifatturiere della provincia di Salerno.
2004, 3.156 Angela Spagnuolo – Silvia Keller
La rete di accesso all’ultimo miglio: una valutazione sulle tecnologie alterna-tive.
2005, 3.157 Davide Cantarelli
Elasticities of Complementarity and Substitution in Some Functional Forms. A Comparative Review.
2005, 3.158 Pietro Coretto – Giuseppe Storti
Subjective Sxpectations in Economics: a Statistical overview of the main findings.
2005, 3.159 Pietro Coretto – Giuseppe Storti
2005, 3.160 Massimo Salzano
Una simulazione neo-keynesiana ad agenti eterogeni.
2005, 3.161 Rosa Ferrentino
Su alcuni paradossi della teoria degli insiemi.
2005, 3.162 Damiano Fiorillo
Capitale sociale: uno o molti? Pochi.
2005, 3.163 Damiano Fiorillo
Il capitale sociale conta per outcomes (macro) economici?.
2005, 3.164 Damiano Fiorillo – Guadalupi Luigi
Attività economiche nel distretto industriale di Nocera inferiore – Gragnano. Un’analisi su Dati Tagliacarne.
2005, 3.165 Rosa Ferrentino
Pointwise well-posedness in vector optimization and variational inequalities. 2005, 3.166 Roberto Iorio
La ricerca universitaria verso il mercato per il trasferimento tecnologico e ri-schi per l’”Open Science”: posizioni teoriche e filoni di indagine empirica. 2005, 3.167 Marisa Faggini
The chaotic system and new perspectives for economics methodology. A note.
2005, 3.168 Francesco Giordano
Weak consistent moving block bootstrap estimator of sampling distribution of CLS estimators in a class of bilinear models
2005, 3.169 Edgardo Sica
Tourism as determinant of economic growth: the case of south-east asian countries.
2005, 3.170 Rosa Ferrentino
On Minty variational inequalities and increasing along rays functions. 2005, 3.171 Rosa Ferrentino
On the Minty and Stampacchia scalar variational inequalities 2005, 3.172 Destefanis - Storti
A procedure for detecting outliers in frontier estimation 2005, 3.173 Destefanis - Storti
Evaluating business incentives trough dea. An analysis on capitalia firm data
2005, 3.174 Nese – O’Higgins
In and out of the capitalia sample: evaluating attrition bias. 2005, 3.175 Maria Patrizia Vittoria
Il Processo di terziarizzazione in Campania. Analisi degli indicatori principali nel periodo 1981-2001
2005, 3.176 Sergio Destefanis – Giuseppe Mastromatteo
Inequality and labour-market performance. A survey beyond an elusive trade-off.
2006, 3.177 Giuseppe Storti
Modelling asymmetric volatility dynamics by multivariate BL-GARCH models 2006, 3.178 Lucio Valerio Spagnolo – Mario Cerrato
No euro please, We’re British! 2006, 3.179 Maria Carmela Miccoli
Invecchiamento e seconda transizione demografica 2006, 3.180 Maria Carmela Miccoli – Antonio Cortese
Stampa a cura della C.U.S.L. Cooperativa Universitaria Studio e Lavoro, Via Ponte Don Melillo, Fisciano per conto Del Diparti-mento di Scienze Economiche e Statistiche