THE USE OF RICA TO ESTIMATE
THE COST OF PRODUCTION
IN AGRICULTURE
APPLICATION OF ECONOMETRIC AND MATHEMATICAL
PROGRAMMING METHODOLOGIES
edited by Luca Cesaro and Sonia Marongiu
collana STUDI E RICERCHE
THE USE OF RIC
A T
O ESTIMA
TE THE COST OF PRODUC
TION IN A
GRICUL
TURE
2013
In the European Union, the Farm Accountancy Data Network (FADN) collects data with the aim of determining costs and incomes and doing a business analysis of agricultural holdings. FADN is used to reach two objectives: on the one hand it is a basis for agricultural sector analysis and on the other it is a fundamental instrument for agricultural policy analysis. One of the problems of the FADN is the lack of an analytical book-keeping system: standard farm accounting information are limited to aggregate farm input expenditures, and production costs per unit of output are not collected at the level of production process. Their estimation is possible only applying specific allocation coefficients or using statistical methodologies. Unlike other EU Countries, in the Italian FADN (RICA) some costs are allocated to each pro-duction process by the surveyors at the end of the accounting year. This is, clearly, an arbitrary allocation procedure that can be subject to inaccuracies if the farmer does not record the costs separately or if there are aggregate costs or joint costs for which it is difficult to make an objective attribution.
This book presents some important results of the FACEPA project (Farm Accountancy Cost Estimation and Policy Analysis of European Agriculture), a Small collaborative project (Grant agreement 212292) funded by the Seventh Framework Programme (KKBE-2007-1-4-14) which concerns the application of econometric (GECOM model) and mathematical programming methodologies (PMP) to estimate the cost of production in agriculture for the most important agricultural commodities. INEA was one of the involved partner and the leading partner of WP6 “Modelling farm technologies”.
The book is structured in five chapters. Initially a theoretical framework of analysis of the production cost in agriculture is presented, together with a description of FADN dataset. The second chapter presents the structure of the econometric model (GECOM) and the application to the Italian FADN. The model has been adapted modifying some variables and taking into ac-count the difference between areas and the characteristics of farm production at a local level. Three chapters are devoted to the PMP model application for arable crops in three northern regions (Lombardy, Piedmont and Veneto): unlike the econometric method, the PMP model produces information about the modification of farm technologies and farmer’s behaviour in case of changes in agricultural policies and prices.
THE USE OF RICA TO ESTIMATE THE COST OF
PRODUCTION IN AGRICULTURE
APPLICATION OF ECONOMETRIC AND MATHEMATICAL
PROGRAMMING METHODOLOGIES
Edited by
Luca Cesaro and Sonia Marongiu
The Volume is the result of the research activity of INEA in FACEPA (Farm Accountancy Cost Estimation and Policy Analysis of European Agriculture) project, a Small collaborative project funded by the Seventh Framework Programme (KKBE-2007-1-4-14)
The research leading to these results has received funding from the European Communi-ty’s Seventh Framework Programme (FP7/2007-2013) under grant agreement No 212292 (FACEPA).
Chapter 1: Sonia Marongiu, Luca Cesaro Chapter 2: Sonia Marongiu, Agostina Zanoli
Chapter 3: Michele Donati, Filippo Arfini, Quirino Paris Chapter 4: Michele Donati, Filippo Arfini
Chapter 5: Michele Donati, Filippo Arfini
Edited by Luca Cesaro and Sonia Marongiu
The Editors thank the referees for their helpful suggestions and comments.
Editorial coordination: Benedetto Venuto Editorial secretariat: Roberta Capretti
Graphic layout: Ufficio Grafico INEA (J. Barone, P. Cesarini, F. Lapiana, S. Mannozzi) Foto di copertina Massimo Zambon
Description of Facepa project 7
Introduction 9
Capitolo 1
Estimation and calculation of the cost of production in agricolture
1.1 Some general concerns about cost estimation in agriculture 13 1.2 Approaches to estimate and calculate cost of production 15 1.3 Principles and methodologies for cost accounting 17 1.4 The allocation of joint costs and overheads: a literature review 21 1.4.1 The allocation of indirect production joint costs (overheads) 22 1.4.2 The approach of the Directorate General of Agriculture
(European Commission) 24
1.4.3 The Integrated Direct Costing approach 27
1.4.4 Calculation of production cost in organic farming 29
1.4.5 Other approaches 31
1.5 The calculation of own resources: labour, capital and land 34
1.5.1 Own labour 35
1.5.2 Own capital 37
1.5.3 Own land 37
1.6 FADN accounting system: general concerns 38
1.6.1 The costs accounted in FADN structure 41
1.7 The International Accounting Standard for the agricultural sector
(IAS 41) and the FADN system 44
1.7.1 Some concerns about IAS 41 Agriculture and the Fair Value 45 1.7.2 Comparison between FADN and IAS 41 accounting system 48
1.8 Remarks 49
Chapter 2
The General econometric model (GECOM)
2.1 Objectives 51
2.2 Description of the production cost model 52
2.2.1 Outliers analysis 54
2.4 Specification of the Gecom model for the Italian FADN dataset 57 2.5 Description of input and output variables of the Italian FADN dataset 59
2.5.1 Sample size after the outliers analysis. 62
2.6 The results for Italy 63
2.6.1 Common wheat 64 2.6.2 Durum wheat 67 2.6.3 Maize 70 2.6.4 Apples 72 2.6.5 Quality Grapes 74 2.6.6 Quality Wine 78 2.6.7 Cows’ Milk 80 2.7 Remarks 84 Chapter 3
Positive Mathematical Programming to estimate specific costs of production
3.1 Introduction to the PMP approach 87
3.2 Mathematical structure of the PMP model 88
3.3 Deriving the cost function 90
3.4 PMP dual approach 94
3.5 PMP dual approach without exogenous costs 97
Chapter 4
Application of the PMP model to estimate specific cost in Italy
4.1 Objectives 110
4.2 Data entry description and quality control procedure 102 4.3 The specific accounting cost estimation for Italy 106 4.3.1 The estimation for the macro-area North of Italy (Veneto,
Lombardy and Piedmont as homogenous area) 107
4.3.2 The estimation of accounting costs for each region as
homogenous area 111
4.3.2.1 The case of Veneto region 111
4.3.2.2 The case of Lombardy region 114
4.3.2.3 The case of Piedmont region 117
4.3.3 Homogeneous group of farms identified through cluster analysis 121
5.1 Introduction: latent technologies and latent activities 129 5.2 Hypothesis adopted, assumptions and structure of the model 131
5.3 Latent information in the simulation schemes 133
5.4 Policy and market scenarios 135
5.5 Results obtained for the latent technologies 137
5.5.1 Entire sample (Veneto region, Farm Type 1, arable crops) 138
5.5.2 Results for original farm technologies 142
5.6 Results obtained for the latent crop 147
Conclusions 151
References 155
Annex 1
FACEPA (Farm Accountancy Cost Estimation and Policy Analysis of European Agriculture) was a Small collaborative project (Grant agreement 212292) funded by the Seventh Framework Programme (KKBE-2007-1-4-14). It extended over three years, starting in April 2008 and ending in April 2011. Nine Member States were involved in the project with Universities and National Research Institutes (Table A). Table A: List of beneficiaries of FACEPA project
Beneficiary name Short name Member State
Swedish University of Agricultural Sciences SLU Sweden
Swedish Institute for Food and Agricultural Economics SLI Sweden
Institut National de la Recherche Agronomique INRA French
Université Catholique de Louvain UCL Belgium
Istituto Nazionale di Economia Agraria INEA Italy
Johann Heinrich von Thunen Institut vTI Germany
Landbouw Economisch Instituut LEI Netherland
Corvinus University Budapest CUB Hungary
Estonian University of Life Sciences EMU Estonia
Ministry of Agriculture and Food Supply MAFS Bulgaria
The project was divided into ten work packages. All of them include several sub-tasks in order to optimize the organization of the research and to ensure that the different partners work together (in brackets, the partner leading the WP). Nine of them deal with research activities and one refers to management activities: • WP1 – Concepts (LEI)
• WP2 – Specification and development of a general production cost model (SLU) • WP3 – Implementation and validation of the general production cost model
(vTI)
• WP4 – Dissemination and valorization of the production cost model (INRA) • WP5 – Applications and extensions of the production cost model: performance
analysis (CUB)
• WP7 – Production cost and environment (SLI)
• WP8 – Methodological applications and improvements (SLU) • WP9 – Evaluation of public policies (UCL)
• WP10 – Project management (SLI)
The first four WPs deal with the development, implementation, validation and dissemination of an economic model for estimating the cost of production of various types of agricultural commodities using the FADN data. The next four WPs focus on applications and extensions of the cost model that are relevant for the study of performance, policy and farm structure in EU agriculture. The objective of WP9 is to evaluate public policies using cost estimates obtained in the previous work packages.
Every WP has been summarized in different deliverables (30 in total, see Annex 1) that describe the theoretical and practical framework of every task im-plemented by the partners. The objectives of the project can be summarized as follows:
• to address the usefulness and appropriateness of the present FADN (Farm Accountancy Data Network) system to measure cost of production for agricul-tural commodities;
• to study the feasibility of developing a “general” production cost model for EU agriculture, easy to use by practitioners and reliable in terms of generating relevant analysis for agricultural production and policy analysis;
• to test and implement this cost model in a European context with the idea of applying it on a large scale (several agricultural commodities in several Euro-pean countries);
• to assess the relationship between cost structure and farm performance, farm technology, environmental quality and farm heterogeneity with FADN datasets; • to provide methodological improvements to the “general” production cost
mo-del;
• to undertake the evaluation of agricultural policy measures using FADN indi-cators.
The FACEPA scientific coordinator was the
Swedish University of Agricultural Sciences (SLU, Prof. Yves Surry). The project results are available on a website
In spite of the trend towards increased specialization that has characterized farming in many European countries, most farms still have more than one pro-duction activity or enterprise. Standard farm-accounting information is typically restricted to aggregate farm input expenditure and, as a consequence, it is difficult to obtain indications about production costs per unit of each enterprise’s output or activities.
Why is it important to have information on the cost of production at farm level?
First of all, because the estimation of product cost is useful in the decision-making process at farm level: knowing the profitability of the individual products can help in the planning of future production. Product cost can be used for in-vestment justification, sourcing materials and services, new product introductions, market strategy and engineering process changes. Full costs and variable costs are also used to evaluate the profitability of a product, to determine the optimal production process to take pricing decisions. comparisons of product costs struc-ture between farms (in the same region or in different ones) could also lead to greater efficiency in the production process of individual farms. The benchmarking process could also be used for different time periods.
Secondly, the importance of using farm costs calculation and estimation for policy purposes is increasing, especially in Europe where farming systems have undergone important changes. Over time, policymakers have used the cost of pro-duction as a basis for farm policy (either directly or indirectly), and especially to take decisions about price support levels.
All these raise concerns about farm accounting data and the need to improve the cost data concept and other farm indicators have forced researchers to develop appropriate tools (models) to estimate the cost of production for agricultural com-modities in the European Union. The FACEPA project started in this context with the objective of implementing one approach to estimate cost of production using the FADN database (at the European or national level). As the FADN system is not based on analytical accounting, there is no separate recording of costs for the vari-ous activities or enterprises on the holding. The specific costs of crop products and
livestock are recorded separately (not by product but by group of products) and all other costs are recorded with respect to the whole farm. Given that the direct col-lection of farm level information is difficult, as it requires costly farm surveys and is often subjective, tools based on econometric techniques may offer an alternative for obtaining estimates of unit costs of production at a relatively lower cost.
Another method that can be implemented uses Positive Mathematical Pro-gramming (PMP) techniques, which can represent farm technologies and relative cost structures on the basis of the FADN database. One of the advantages of PMP models is that they permit different farm technologies in diverse territorial con-texts and their relative total variable cost at farm level to be considered.
These two methods have been tested and implemented in the FACEPA project. The econometric model (that follows the scheme initiated in France al-most twenty years ago by the Agricultural Division of INSEE and the research eco-nomists of INRA) was tested and developed in WP3, while the PMP model imple-mentation was the main task of WP6. INEA has been involved in both WPs and as leading partner of WP6 Modelling farm technologies.
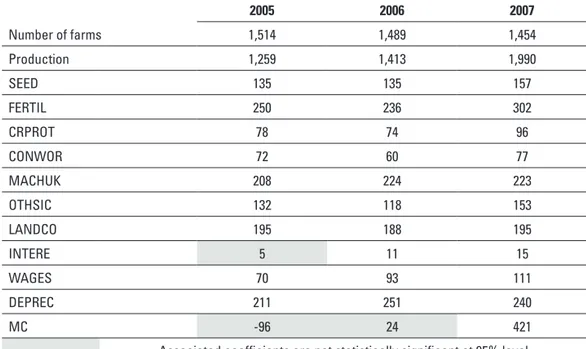
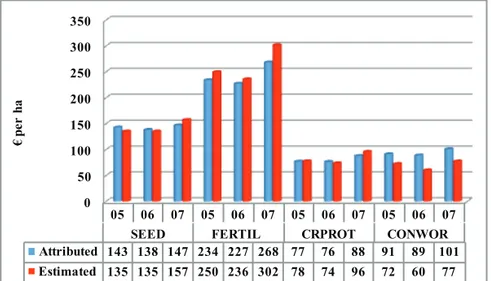
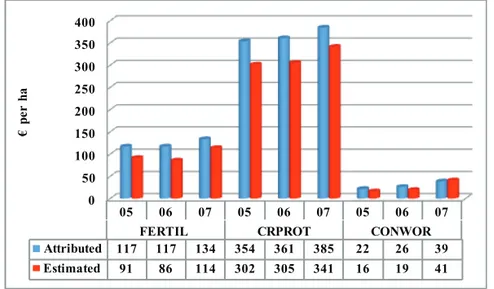
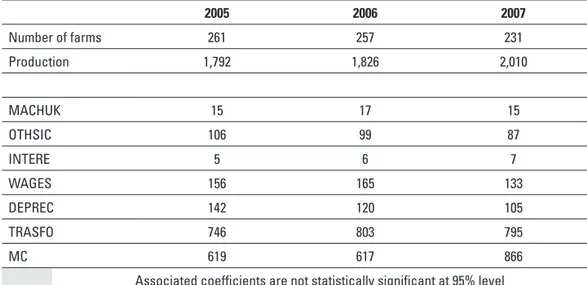
This book presents some important results of the FACEPA project. They concern the application of econometric and mathematical programming metho-dologies to estimate the cost of production in agriculture for the most important agricultural commodities in Italy. With respect to the original scheme of the mo-dels (structured to run with the European FADN dataset), further efforts have been made to adapt them to the Italian FADN dataset (RICA), which has a different va-riables aggregation. With respect to the European FADN dataset, the Italian FADN system includes information about the specific costs per production process. The allocation is made by the surveyors every year on the basis of farmers’ indications or their experience. These observed costs have been compared with the estimated costs resulting from the implementation of both models.
The book is divided into five chapters.
In the first one, a theoretical framework of analysis of the production cost concept is provided, describing the different approaches to calculate and estimate production costs in agriculture. In fact, there is a lack of analytical accounting in the agricultural sector that makes cost allocation very difficult and subjective. This is due to the presence of multiple activities or enterprises (so, many indirect and common costs) and to the presence of mixed farms where some costs are con-nected to one product (directly attributable) while others must be allocated using appropriate allocation keys. The FADN dataset is, consequently, characterized by the same lack: the costs are recorded but not allocated to different crops.
Knowledge about the FADN dataset is important to determine how these data should be used in the choice of the allocation approach. This choice is the main problem of every methodology and many studies have attempted to solve it. Some of them are widely described in the literature and are based on the applica-tion of allocaapplica-tion keys to the FADN dataset, determined in different ways depen-ding on the cost structure and final objectives of the analysis. Others are based on the use of the FADN dataset to run econometric and mathematical programming models, more accurate from a statistical point of view, applicable on a large sca-le, and which can also be used to carry out scenario analyses. The last section of the chapter deals with the International Accounting Standard 41 Agriculture, indicating some studies and analyses concerning the adoption of these standards in FADN. The chapter summarizes the contents of Deliverable 1.1.2 (Cost of pro-duction. Definition and contents) issued by INEA.
The second chapter presents the structure of the econometric model, na-med GECOM (General Cost Estimation Model). This model, tested and implemen-ted in WP3, has initially been applied on the FADN dataset to estimate cost of pro-duction of several agricultural commodities in several European Member States. Its flexibility has permitted a specific application to some national cases, such as the Italian FADN. The model has been adapted modifying some variables (input ag-gregation) and adding the most important Italian crops, taking into account the dif-ference between areas and the characteristics of farm production at a local level.
The chapter summarizes the contents of Deliverables 3.1 (Implementation, validation and results of the production cost model using national FADN databa-ses) and 3.2 (Implementation, validation and results of the production cost model using the EU FADN databases) of the FACEPA project and presents the results of the adaptation to the Italian FADN dataset.
The second part of the book deals with production cost estimation by means of Positive Mathematical Programming techniques. The activities have been car-ried out by INEA in WP6 (INEA was the leading partner). The objective of the work is the estimation of the cost for different production processes but also to offer a methodological framework that can analyze the impact of an environmental per-turbation (market price or agricultural policy) in terms of farmer’s technological adjustment. The traditional PMP models, in fact, provide results on the effect of al-ternative scenarios in terms of land allocation and farm economic performances; the model presented in this book also produces information about the modification of farm technology.
the difference between the standard and dual approach is explained in detail. The application of the model to the Italian FADN dataset and the validation procedure is described in chapter 4: the analysis has been restricted to arable crops (Farm Type 1) in three northern regions (Lombardy, Piedmont and Veneto) considering different levels of aggregation. In order to validate the procedure the estimated accounting costs are compared with the observed accounting costs through the t-test. Chapter 5 discusses application of the PMP model with the latent information, not revealed by the accounting books but considered a very important component of the farmer’s decision-making process. Different simulation scenarios (agricul-tural policies and prices) have been hypothesized in order to analyze changes in technology and farmer’s behaviour. The model has been applied only for farms specialized in arable crops in Veneto region, simulating the introduction of sor-ghum as latent crop for biomass production in the regional production plan.
The chapters summarize the contents of Deliverables 6.1 (Methodology to assess farm production costs using PMP farm models), 6.2 (Methodology for the definition of case study farms and model structure for each case study) and 6.3 (Effects of the single farm payment on cost function and production function) of FACEPA projects.
EsTIMATIOn AnD CALCuLATIOn OF ThE COsT OF
PRODuCTIOn In AGRICuLTuRE
1.1 some general concerns about cost estimation in agriculture
The last four decades have witnessed a major increase in research investi-gating product costing practices and production cost estimations. Starting from the industrial sector, the different methodologies have also been applied in other sectors, including agriculture (Ahern, Vasavada, 1992; Brierley et al., 2001). In the agricultural sector, the need to measure and estimate the cost of production had its roots in the agronomy discipline, with the emergence of farm management spe-cialists. The aim was the measurement of cost of production at farm level to im-prove farmers’ decisions by providing a means to assess their management strate-gies and achieve greater efficiency and higher profits. Over time, the measurement of farm costs has also been used for other purposes such as agricultural policies, comparisons between sectors, comparisons between countries or regions, etc.
Today’s agricultural inputs and outputs are more complex than in the past, so economic theory has become more sophisticated and precise. Although farms have usually been excluded from cost accounting research and since the proce-dures of record keeping and accounting appeared not to be necessary, empirical evidence has been found on the usefulness of accounting when aiming for a high performance level in farm management (Argilés and Slof, 2001; Argilés and Slof, 2003).
Notwithstanding the importance of collecting information on the cost of production, the accounting methods for agricultural activities have received lit-tle attention from accountants and regulators in many countries. Instead, some countries have developed sophisticated tools for specific accounting in the agricul-tural sector. For instance, the Agriculagricul-tural Resource Management Survey (ARMS) conducted by the United States Department of Agriculture is the primary source of
information on the financial condition, production practices, resource use and eco-nomic situation of America’s farming households. This survey is sponsored by the Economic Research Service and the National Agricultural Statistics Service and is the only national survey that provides observation at a farm level. Survey data used in estimates prior to the ARMS were collected as part of the annual Farm Cost and Returns Survey (FCRS) from 1984 to 1995 and the Cost of Production Sur-vey (COPS) prior to 1984. In Canada, the Farm Level Data Project (FLDP) provides data for monitoring the financial and economic conditions on farms. An essential component of this is the Whole Farm Database (WFDB), which integrates all the available agricultural data (physical and financial).
In the European Union, the Farm Accountancy Data Network (FADN), esta-blished by the European Commission in 1965, has developed general procedures and detailed guidelines for farm accounting. FADN collects data from farms with the aim of determining costs and incomes and doing a business analysis of agri-cultural holdings. This has produced a highly structured body of data collection rules and procedures designed to produce aggregated reports that are similar to a balance sheet and an income statement. FADN is the only source of micro-economic data for agriculture that is harmonised within the European Union: data are collected in every Member State following a common standardised guideline. FADN is used to reach two objectives: on the one hand it is a basis for agricultural sector analysis and on the other it is an instrument for agricultural policy analysis. It has also been used to make cross-country comparison (FADN-ARMS database) of cost of production estimates (Bureau et al., 1992).
One of the problems of the FADN dataset (and, in general, of the whole agri-cultural sector) is the lack of an analytical book-keeping system: standard farm accounting information is restricted to aggregate farm input expenditure, without revealing production costs per unit of output of each enterprise. Obtaining them is possible only applying specific allocation coefficients or using statistical metho-dologies.
The methodology that tracks, studies and analyzes all the costs accrued in the production and sale of a product is named product costing. The application of product costing methodologies in the agricultural sector presents some difficul-ties. Today, despite a higher specialization level, the fact that there is more than one enterprise on a farm makes it difficult to allocate all the costs among them. So, costs known at a farm level must be shared among the enterprises or recal-culated using estimation norms. Briefly, the difficulties of product cost estimation and calculation in the agricultural sector can be summarized as follows:
• in the agricultural sector, there are multiple activities and enterprises; • the common costs subject to allocation are usually a considerable component
of total costs;
• the determination of farm uses is complex;
• crop yields can change from year to year depending on the weather: a conse-quence is a change in the indirect costs and, so, a variation of the stock values; • on dairy farms, there are difficulties in the evaluation of stock and activities
connected with the animals born on the farm. In this case, it is necessary to take into account the expenses of purchasing breeding cattle and other gene-ral costs (veterinary fees, etc.);
• on farms there is usually not a developed use of book-keeping practices. There are, consequently, different methods to calculate or estimate produc-tion costs, depending on the costs, farm type, accounting approach, final objectives and uses, etc.. Each methodology follows a specific theoretical framework and has a justification within a specific modelling context. The way in which costs are ana-lyzed depends on the final objective and on the use of the analysis. Measurement of the cost of production at farm level can improve farmers’ decisions by provid-ing a mean for assessprovid-ing management strategies in order to achieve greater ef-ficiency and a high profit. Moreover, the use of production cost estimates has been extended and today regards not only farm management specialists, but also the policymakers who use the estimates to set prices, subsidies, agricultural policies, etc.. Cost estimating is a precursor to cost accounting: it is done prior the produc-tion of goods and services while cost accounting is done after their producproduc-tion. In the next paragraphs both aspects will be analysed in detail.
1.2 Approaches to estimate and calculate cost of production
There are different methodologies to estimate and calculate cost of pro-duction. In general the approaches may be grouped into three categories (French, 1992).
The first one is the descriptive analysis approach based on accounting data, which mainly involves combining point estimates of average costs into various classes for comparative purposes. The descriptive approach was the first method used to study farm marketing efficiency. The computational procedures involved in this approach are very simple, being based on average accounting cost records for a particular time period obtained from a sample of crops farms. This approach is
very popular because it is relatively cheap (compared to the other approaches) and easily understood by managers, providing a means to relate their own cost expe-rience to the expeexpe-rience of others. The limitation is that it needs a high standardi-zation of the book-keeping system among farms. Moreover costs are influenced by different factors that cannot be separated. It provides no quantitative measures of parameters and few general clues regarding the types of functional relationships between costs and production factors.
The second is the statistical analysis approach (survey approach), which at-tempts to estimate functional relationships by econometric methods starting from the accounting data. This approach uses the same data as descriptive analysis but develops quantitative estimates of production and cost functions. Differently from the previous approach, data defects may be of great importance because of the po-tential for biasing quantitative functional estimates. The most important limitation of this approach is connected with the data because, even with uniform accounting sy-stems, it is impossible to eliminate every degree of distortion. The estimates can be made using cost functions from time-series data, average regressions from cross-section data, frontier function and so on. However, lengthy time series may reflect variations in the farm physical structure and in this case, it is necessary to have some measure of the nature of this change. A problem also arises in the presence of arbitrary and variable systems for allocating common costs among enterprises.
Lastly, the economic-engineering approach represents production and cost relationships from engineering data or other estimates of the components of the production function. This method requires much greater familiarity with technical aspects of production than the typical analysis of accounting data. It is necessa-ry to understand the production system, the nature and sequence of operations, the links among them, etc. The input-output relationships may be determined by engineering formulas and studies of the different processes. For example, the specification of requirements per hour of machinery operation. This approach en-compasses studies ranging from simple descriptive comparisons of labour time requirements to detailed estimates of short- and long-term cost functions. Once the production functions have been specified, the cost functions are determined by applying factor prices. The economic-engineering approach avoids many pro-blems highlighted for statistical studies. Moreover it can be applied in cases where accounting data are not available. It is usually the only approach possible when the objective is to compare operating methods or develop improved methods. A major limitation is the high research cost: the amount of technical data required to synthesize cost functions can be very expensive compared with the analysis of
accounting data. Another shortcoming is the use of constant input coefficients that makes it impossible to measure or account for coordination problems such as crop farm increases in scale.
Obviously, two or more approaches are frequently combined. For example, economic-engineering studies may rely on statistical estimation based on ac-counting data for some components. Moreover, many descriptive comparisons of costs rely mainly on data generated by quasi-engineering types of measurement.
Generally speaking, there are separable objectives which are achievable only using a particular approach. For example: if the analysis focuses on the de-scription and comparison of costs on farms that operate in different ways and with different practices, the descriptive and statistical analysis of accounting data could be sufficient. If the objective is to measure the short-term cost function to provide managerial tools for decision-making, then the statistical and economic-enginee-ring approaches can be combined. Other purposes of cost estimation are: budge-ting, measurement of performance efficiency, preparation of financial statements, estimation of the sale prices of products, etc..
1.3 Principles and methodologies for cost accounting
While cost estimation is the process of pre-determining the cost of a certain production, cost accounting is the process of determining costs on the basis of actual data and it is done after the production of goods and services.
Cost accounting1 is defined as the methodology by which all elements of cost incurred in an activity are collected, classified and recorded. These elements are summarized and analyzed to determine a selling price or to discover where savin-gs are possible. Cost accounting is one of the main aims of analytical accounting.
With respect to general accounting, where elementary costs are collected
1 Cost accounting methodology originated during the industrial revolution in the 19th century when the complexity of business led to the development of a system for recording and tracking costs in order to help owners and managers in the decisional process. Initially, most of the costs were variable costs, varying directly with the amount of production and not difficult to allocate. Over time, overheads and fixed costs became more important, especially in the cost accounting practices of American industry where different cost accounting systems were formulated (over all the standard costing). Many of the-se concepts are uthe-sed today (including the cost opportunity) together with a large literature concerning the aspects of cost behaviour. With the increase of complexity in cost accounting, new tools and quan-titative methodologies have been developed to solve planning and control problems. For example: linear regression techniques, linear and non-linear programming, Bayesian estimation techniques, probability theory, and so on. However, the problems are the same as in the past: determination of fixed and variable costs, assessment of profitability, allocation to costs, etc.
and classified according to their nature or origin, in analytical accounting the costs are allocated to the different enterprises, according to the destination when con-sumed or used.
What is a production enterprise? Following the report of the AAEA (Ame-rican Agricultural Economics Association) Commodity Cost and Returns Estima-tion Handbook (2000), a producEstima-tion enterprise is any porEstima-tion of the general input-output structure of the farm business that can be separated and analyzed as a distinct entity. This entity uses inputs (and incurs costs) to produce an output (re-turns) or some fixed set of resources. So, a farm can be divided into enterprises in several different ways, depending on the production, technology, etc. A common delineation of enterprises is made considering the commodity lines (i.e. the barley enterprise, dairy enterprise, etc.) but in many cases, a neat division is not possible or not desirable. In other cases, it is necessary to estimate the detail of the costs of some enterprises.
Considering this definition, the aim of analytical accounting is to determine the costs of every farm activity or enterprise, to define the right evaluation rules for the different elements of the balance and to verify the correspondence betwe-en the estimated and realised values. Figure 1.1 summarizes the links betwebetwe-en general and analytical accounting: cost accounting is an analytical methodology that uses the original information coming from general accounting and returns the inventories and internal production evaluations to general accounting.
Figure 1.1 - Links between general and analytical accounting systems
The allocation of costs to the activity or products can be made in different ways. GENERAL ACCOUNTING
classification of costs with respect to their nature
activity 3 activity 2
activity 1
ANALYTICAL ACCOUNTING classification of costs with respect
to their destination
Inventories and internal production evaluations
The Direct Costing (DC) procedure considers only variable costs and permits an easy determination of the final product cost. It is the preferred cost estimation procedure because it does not require any assumptions about prices or quanti-ties: the majority of costs are direct and traceable. However it works well when the farmer has commodity specific records or can recall the amount spent for the commodity. For example: in the case of crop fertilizer and chemicals, it is sufficient to take into account how much was paid per hectare for the inputs used to produce the crop. In the case of other costs, such as livestock customs services, it is ne-cessary to define how much of the total farm expenditures for each input was for production of the livestock commodity.
Indirect Costing (IC) also considers indirect costs. It is used to allocate these costs among the farm enterprises. As previously stated, farms are characterised by the presence of different productive processes and an allocation of common and fixed costs (recorded as a whole) among them is required. In this case it is important to define the right cost allocation rule in order to make the product costs truly representative of the production factors used to obtain them. there are no problems for direct and traceable costs because quantity and prices are clearly identified. For indirect costs it is more difficult. Usually, it is assumed that there is a relation between the rate of indirect costs allocated for a product and its quota on the whole production. Another way to allocate overhead costs is the volume-based allocation method: the costs are allocated to the enterprises in accordance with the volume of direct labour hours, direct labour costs or contract amount. So, a percentage of direct costs is considered.
Activity Based Costing (ABC) applies an attribution of all costs to the acti-vities, depending on the amount of activities that are needed to produce that pro-duct. Traditional cost accounting reports fail to report the cost of activities and processes. In particular, the methodology to allocate the indirect costs (overheads) using an arbitrary percentage of expenses deriving from the consideration of direct costs, causes distortions. For example: let us suppose that the direct cost taken into account is the direct labour and materials and there are two products with dif-ferent needs for a particular machine. In this case the amount of direct labour and materials is the same and this causes distortion in the allocation of fixed cost of machinery between the two products. So, when multiple products share common costs, there is a danger of one product subsidising another. ABC is an approach useful to solve the problems of traditional cost management systems, that appe-ars to be inaccurate in the case of multiple products. ABC seeks to identify cause and effect relationships to assign costs. Once costs have been identified, the cost
of each activity is attributed to each product to the extent that the product uses the activity. Because this method needs a lot of information (for example, hours of labour and machines used for different activities) that is not collected in FADN, this method is not possible using this network.
Standard Costing (SC) is the system in which actual costs are compared to predetermined costs in order to generate cost variances, whose analysis is useful to improve control of the business and increase efficiency. It provides the basis for the concept of accounting control. different studies have been done on the effi-ciency of the standard costing system and its ability to provide effective managerial control. Initially (from the late 18th to the late 19th century), cost information was used for a wider range of planning and control decisions and standard costs were used in the form of norms or targets. The standards represented actual results that had been obtained for similar activities or in prior periods, so they were the results of an archive-based research (deriving from an objective view of historical knowledge). Cost variances from the standard were neither computed nor used to evaluate managerial performance: for example, individual employees were eva-luated according to quality, quantity and other criteria but cost data were not taken into account in the calculation. Anyway, in the past, this system was largely used to measure waste and inefficiency: the traditional environments with clear goals and stable product lines made the firms able to use currently attainable standards as a benchmark to evaluate performance. Standard costs were used to set the prices. Over time, things have changed as international competition forces to innovate, improve quality and reduce costs. Today, the ultimate objective of a firm is not to make a cost control because global competition and customers demand much more, such as for example, greater value and better performance. There is a shift from cost control to cost reduction: standard costs better serve as long-term tar-gets of cost reduction rather than as static benchmarks for cost control. This new role derives from the intense competition as well as from the inability of firms to use cost-based pricing strategies. The new concept of standard is the value-added standard that will not be achieved immediately but represents a longer-term goal that may be flexible and only achieved through continuous improvement and cost reduction. Value-added standards are the norm in Japanese accounting systems and are the antithesis of past American and British practices.
Historical Costing (HC) is a method that uses historical costs for direct ma-terials and direct labour while overheads and indirect costs are charged using a predetermined overhead rate per activity measure. The amount of overheads is obtained multiplying this rate by the quantity of activity measure.
1.4 The allocation of joint costs and overheads: a literature
re-view
As previously mentioned, one of the main problems in cost accounting is to allocate the cost among different enterprises or productions. The analytical ac-counting system enables specific costs for every single activity or enterprise to be separated and provides some parameters to allocate overhead costs. There are different methods for this and they depend on the management information used on the farm. If a farmer keeps detailed records of the use of various farm re-sources, those records will likely form a sufficient basis for allocation. However, it is difficult to record and track data in agricultural holdings and, so, other allocation indicators must be used.
An important distinction in agricultural accounting is made between direct and indirect costs on the basis of the relation and reference to the final objective. The direct costs are traceable, specific and directly attributable to the final objec-tive. The indirect costs require an arbitrary procedure to be allocated, being com-mon to different objectives.
In the agricultural sector, the presence of more than one enterprise leads to the recording of the joint production costs, which are incurred on groups of pro-ducts rather than on individual and separate ones (AAEA CAR Estimation Handbo-ok, 2000). Joint production costs exist in three different situations:
• expenses incurred in the production of joint products;
• expenses for inputs that affect the production of more than one independent enterprise (capital inputs or fixed inputs: for example the allocation of fertili-zer total cost among several different crops or the division of the total number of tractor hours between crop and livestock activities);
• expenses that are incurred on the farm as a whole (general farm overheads). These three cases may give rise to joint costs that occur as either direct or indirect costs. In the case of joint direct costs, when there is a need to estimate costs for individual enterprises, the allocation may be made on an objective basis and using objective data (for example, land allocation, hours of use, etc.). For indirect joint costs (overheads) there are different procedures that, in any case, are implemented in an arbitrary manner. The following scheme (Figure 1.2) explains the methodology. Choosing a specific activity or enterprise, the production cost will be the sum of spe-cific costs and farming overheads, allocated using appropriate allocation keys.
Figure 1.2 - Allocation of joint costs and overhead costs
There is not just one allocation key. The existence of different kinds of joint costs makes the choice of the appropriate allocation key necessary.
1.4.1 The allocation of indirect production joint costs (overheads)
Generally speaking, the methods developed to allocate overheads are refe-rable to two common methodologies (AAEA CAR Estimation Handbook, 2000): • allocation on the basis of gross value of farm production
• allocation on the basis of other allocated costs
With regard to the first methodology, enterprises are impacted relative to their importance to overall farm profit. Moreover, decisions about enterprise se-lection and management are neutral to general farm overhead expenses. Howe-ver, when an enterprise has a negative margin, this method creates a mathemati-cal problem. In this case, it is recommended that an allocation is made on the basis of long-term expected gross margins or other allocated costs.
This can lead to a relatively low profitability of products with relatively high (variable) costs already allocated (for instance, on a farm with cereals and pigs, ce-reals have relatively low variable costs with respect to pigs. Following this method, the profitability of the pig sector could result as relatively low).
To solve this problem on mixed farms, there is a method that takes the cost of fully specialized farms and uses the level of those costs to divide the costs of the mixed farms between the products. Obviously, this is possible only if there are
C1 C2 C3 C4 C5
P P P
Joint costs and overheads Total specific costs
P
enough specialized farms for the different products produced in a mixed farming system. The criticism is that the cost per product on the specialized farms differs from the cost of that product on mixed farms because of economies of scale and the results will consequently just be approximations.
A mix of these two approaches has been used by the LEI Wageningen Re-search Unit, which has developed two simple methods to allocate overheads. The first one assumes that in the long run every product has the same profitability (expressed as revenues/costs) because otherwise the farmer would change his product composition. So, the common costs are allocated in such a way that every product has the same profitability. This method can be a reasonable approximation of production costs only if based on several years and for fairly specialized farms. Otherwise, the approximation would be too rough. The second method can be used for products which are necessarily produced together and it supposes that the by-product is only produced because of the main by-product. So, the by-by-product forms only a small part of the total production (for example, milk and beef on farms spe-cialized in milk production). This scheme is similar to the theory of Proni (1940), used in different Italian analyses. Following this approach, the production cost of the prevalent output can be calculated in two steps:
• first of all, the whole farm costs are calculated, without distinction among the different productions. The total cost can be obtained simply using the farm balance sheet.
• in the second step, the by-product cost is subtracted from the total cost and the difference is the cost of the main production. The cost of secondary pro-duction can be assimilated to the market price in the hypothesis of a perfect competition market.
Ghelfi (2000) also proposes two kinds of procedures to allocate the costs to the different farm enterprises or activities. In the case of predominance of specific costs, the direct costing procedure may be adopted: the cost of the final product is obtained summing all the specific costs of the single activity. The simplest cases are monocultures and farms with one kind of livestock rearing. When the farms have more than one production or continuous production (so a predominance of common costs) the allocation is made using indirect costing methods. Following this procedure, the costs are distributed in intermediate cost centres and then allocated among the single products of every centre. The cost centres are basic accounting units which are defined depending on the technical and productive fun-ction of the farm. In the agricultural sector, they usually correspond to the main production activity of the farm: for example, milk and meat production on a
live-stock farm or crop and milk production on a mixed farm.
Another way to allocate overheads is described in research done in the UK by Drury and Tales (1995) concerning the accounting systems used by a sample of firms in the manufacturing industry. The authors did a pilot survey to examine what kind of allocation processes are used by the sample. Some organizations simplify the allocation process by not assigning manufacturing overheads to cost centres but calculating an overhead rate for a factory:
Overhead Rate = IndirectDirect
This rate becomes the basis for allocating overheads to all products pro-duced, regardless of the production department where the products were made. Obviously, the overhead rate is suitable for allocating overheads among products that consume resources in the same proportions. It is not suitable when these proportions differ. So, in the case of the agricultural sector, this method could be used to allocate overheads among activities with similar technical coefficients. To calculate overhead rates, direct labour hours and volume-based allocation proce-dures could be adopted: direct labour cost, direct labour hours, machine hours, material cost, units produced, production time, selling price, etc.
It is important to highlight that the volume of production can be used but it cannot be the only allocation key. The cost is also influenced by structural (size and vertical integration of the farm, experience, technology and complexity of the pro-duction process) and operative variables (management quality, propro-duction type, etc.). This is the reason why it is necessary to understand the behaviour of the costs by also considering other variables. Moreover, the use of volume-based methods to allocate the indirect costs causes an overcharge of a product with higher volu-mes in favour of those with low volume or those with highly complex production.
1.4.2 The approach of the Directorate General of Agriculture (European Com-mission)
A study concerning analysis of the costs allocation system comes from the Directorate General of Agriculture of the European Commission. As regards ara-ble crops, a program named ARACOST for estimating the costs of production has been developed (EC DGAGRI, 1999). This program defines some rules for allocating
costs to different enterprises using a volume-based allocation model. All costs (joint costs and overheads) are allocated on the basis of the percentage of the specific crop output on the total output of arable crops. For instance, seed and seedlings purchased, fertilizers, crop protection, motor fuel, lubricants, farming overheads, depreciation are allocated considering
Output of the crop X Total output of arable crops
While motor fuel, lubricants, farming overheads and depreciation
Output of the crop X Total output of the farm
With regard to the milk sector, the study focuses on the development of a methodology that takes into account the co-existence of beef production on farms for which costs of milk production are estimated (EC RI/CC 1342, 2001; EC RI/CC 1331, 2001; EC RI/CC 1436, 2006; EC G3/EL, 2007). In particular, the methodology defines the allocation key for farming overheads, depreciation and other non-spe-cific inputs of specialized dairy farms at EU level (TF 41). The aim is to estimate the cost of production for milk on farms with different levels of specialization in milk production.
The allocation of the charges to milk production is based on three criteria depending on the kind of costs taken into account:
• specific costs (purchased feed for grazing livestock) • other specific livestock costs (e.g. veterinary fees)
• all other costs (farming overheads, depreciation, external factors)
The share of dairy livestock units on the grazing livestock unit is used to al-locate grazing livestock feed costs, while for the other livestock specific costs the share of dairy livestock units on the total livestock units is used. In the analysis the dairy livestock units are defined as dairy cows and a share of total breeding heifers and young females. This share is equal to the proportion of dairy cows in the total number of cows (dairy cows, cull dairy cows and others).
The specific costs of the crops (seed and seedlings, fertilizers and soil im-provers, crop protection products) are shared according to the percentage of fod-der crops, forage crops and temporary grass in the total Utilizable Agricultural
Area (UAA). This method permits an estimation to be made of the value of fodder plants, which is necessary because in some European Union countries (especially in the north), the value of fodder areas is not indicated in FADN.
A similar analysis was done of production costs for the beef sector (EC RI/ CC 1342, 2001). Using the same methodology, the model has been limited to farms with suckler cows, making a distinction between those who just rear the young calves and those who fatten the animals on the farm. European typology does not allow a beef production system to be precisely identified, so the analysis uses an INRA study that created a Typology of Grazing Livestock System in the European Union. Table 1.1 displays the allocation keys used for every kind of cost used in the analysis:
Table 1.1 - Allocation keys used for the milk and beef sector costs.
Kind of costs Allocation keys Milk sector Allocation keys Beef sector Specific costs (purchased
feed for grazing livestock)
Dairy livestock units Beef livestock units Total grazing livestock units Total grazing livestock units
Other specific livestock costs Dairy livestock units Beef livestock units Total livestock units Total livestock units Other indirect costs (farming
overheads, depreciation, ext. factors)
Milk and milk pr . output & subs. Beef livestock subsidies Total output & subsidies Total output & subsidies Specific forage costs
(farm-use of forage crops)
Dairy livestock units Beef livestock units Total grazing livestock units Total grazing livestock units Seeds and seedlings % area of fodder crops, other forage crops and temporary grass in
the total UAA
Fertilizers and soil improvers % area of fodder crops, other forage crops, temporary grass and meadows in the total UAA Crop protection products % area of fodder crops and other forage crops in the total UAA
Source: DG Agri – European Commission
In the past, the indirect costs were allocated taking into account only the output. Due to the increasing importance of direct subsidies compared to market price support in beef production, the previous key has been replaced by the one in the table, which also considers subsidies (EC RI/CC 1331, 2001).
1.4.3 The Integrated Direct Costing approach
An interesting contribution to the application of analytical accounting sy-stems in the dairy sector is provided by Arfini (1997). His analysis starts with the definition of the Cost Centre (CC) as a unit in which costs can be segregated and allocated. More specifically, using the principles of an analytical (or industrial) ac-counting system, Arfini breaks up the farm activity of a specialized dairy farm into more CCs in order to allocate the costs in the single enterprises, using various allocation keys. the methodology is thus not completely different from the one previously described. One difference is that there is greater detail concerning the division of the livestock farming activity, depending on the age and functions of the different kinds of animals. The division of farm activities has been made following a “functionality criteria”, on the basis of the role of every CC in the farm production and the links between them (Figure 1.3).
Three kinds of CC have been distinguished for the specialized dairy farm: Primary CCs: bring together all the activities that represent the final step of farm production and that generate an output, in part sold on the market and in part used to guarantee internal continuity (remount). Following this scheme, the animals are divided into three Primary CCs. The most important one is the Dairy Cows, which includes the females that produce two kinds of output: one destined for the market (milk and non-dairy cows) and one used for the internal remount (calves for farm use). This last output originates the Calves Cost Centre in which the animals stay until they become Breeding Heifers, in the next Cost Centre. Both of these CCs produce output for the market (male calves and heifers), with most heifers destined for the Dairy Cows CC.
Auxiliary CCs: this group includes the specific costs of livestock farming whose output constitutes the input for the Primary CCs. Three CCs are distingui-shed: Purchased feedstuffs, feedstuffs produced on the farm and other specific livestock costs. All the costs are allocated using specific allocation keys. feedstuffs are allocated on the basis of a “consumption criteria” considering the food re-quirement of every kind of animal in the Primary CCs. So, the methodology uses a technical coefficient to express consumption; multiplying prices and quantities consumed it is possible to have an indication of the feed costs. For the specific live-stock costs (veterinary, products for cleaning livelive-stock equipment, etc.), the supply services invoices are taken into account
Service CCs: are fictitious CCs useful to allocate the costs of the fixed as-sets, in particular the depreciation of agricultural land, farm buildings, machinery
and equipment, and milk quotas. this group also includes the cost of labour (wages of fixed and seasonal workers). With regard to the fixed assets cost (depreciation), the allocation among the three primary CCs is in proportion to the use of the pro-duction factor by the animals. To do this, a technical parameter (LSU)2 has been used to obtain a homogeneous measure of the entire livestock. Labour costs are allocated taking into account the hours effectively dedicated to the activities of pri-mary CCs. The quotas are linked only with the Dairy Cows CC and the allocation is made on the basis of the number of cows.
Figure 1.3 - Arfini’s scheme for dairy farms
The scheme shows the application of the method for the Dairy Cows Cost Centre. The same scheme is applied to obtain the cost for calves and breeding heifers.
The methodology follows a “cascade scheme”: the output of Auxiliary and Service CCs is the input for the Primary CCs. With regard to the Auxiliary CCs and Services CCs it is necessary to identify the produced (or available) quantities and the production (or purchase) costs, while for the Primary CCs it is necessary to de-fine the input requirements (that depend on the technologies). The methodology is
2 LSU = Livestock Unit. This is a system used to compare or aggregate animals of different species or categories. Equivalences are based on the food requirements of animals. LSU = 1 dairy cow; calves < 6 months = 0.25 LSU; calves 1-2 years = 0.60-0.70 LSU; breeding heifers > 2 years = 0.70-0.90 LSU. The ranges depend on the sex of animals and the function (for fattening or calving).
Purchased feedingstuffs Feedingstuffs produced on the farm Other specific livestock costs Depreciation Quotas Wages (fixed and seasonal work
Auxilary CCs (Specific Costs) Service CCs (Indirect an Direct fixed costs)
Food Requirement (Technical Coefficient)
Price x Quantity (Effective
Consumption) N° of Dairy Cows units % of Dairy Cows Units
on the Total livestock
units (UGB) N° of hours of work
DAIRY COWS CALVES BREEDINGHEIFERS
Primary CCs (Main activities of Farm)
Output for the market (Milk and
Meat) ALLOCATION
named Integrated Direct Costing (IDC) and considers the variable direct costs and specific fixed costs, both directly imputable to the single activities or enterprises. This makes it possible to calculate the margin of profit and the capacity to generate revenues of each single activity on the farm.
1.4.4 Calculation of production cost in organic farming
Public financial support for organic farmers was introduced in many Euro-pean countries at the end of 1980s to cover economic losses incurred during the conversion period. During the 1990s, political interest in organic farming moved to the European Union level with the EU Reg. 2092/91, which introduced a com-mon set of production standards for organic plant production. In 1999 this regu-lation was supplemented by common standards for livestock production (EU Reg. 1804/99). In the following years Member States implemented various organic far-ming policies according to this legislative framework, receiving further support under the agri-environmental programmes granted under the rural development regulations. Over time, the number of organic farms and organic production areas have increased and today this sector has become very important. Notwithstan-ding this, before 2000 none of the most important statistical surveys at farm le-vel in European Union (Eurostat Farm Structure Survey and FADN) provided an explicit identification of organic holdings. During the preparation of the Agenda 2000 Reform, new issues were taken into account: reinforcement of the Rural De-velopment aspects of CAP, sustainable and environmentally-friendly agricultural practices, food quality and food safety. As a result, organic farming acquired in-creasing importance and an identification code was implemented in FSS (Farm Structure Survey) and FADN. Moreover, the quality of data collected for organic farms was improved with an action named EISfOM (European Information System for Organic Markets), developed under the key action 5 (Sustainable agriculture) of the 5th Framework Programme for Research and Technological Development.
FADN began to collect information on organic farming from 15 Member States in the accounting year 2000/01, following the recommendation of a study concerning the modernisation of farm returns (LEI, 1999). The following codes were added:
• non-organic farms • purely organic farms
Although FADN is one of the key instruments for evaluating the income of farm holdings, some studies have underlined its limitations for the analysis of or-ganic farms (Gleirscher, 2005). First of all there are problems with the correct identification of organic farms. Where organic holdings are 100% organic (certified according to EU Reg. 2092/91) there are no problems, although there is still a need to separate the holdings in conversion. Many problems arise where holdings have mixed organic, conventional and in conversion management.
The second problem concerns the classification based on the European Size Units derived from the Standard Gross Margins for agriculture in general. For agri-culture with different prices and gross margins and with a high presence of mixed farms, this basis for the classification may lead to the exclusion of smaller organic holdings, because they fall below the inclusion threshold.
Generally speaking, the cost structure in organic farming differs from the conventional one. In crop production, soil fertility and biological activity should be maintained by the use of green manure (fertilization), leguminous plants and an ample crop rotation scheme. For crop protection against diseases and pests, besi-des ample crop rotation schemes, natural enemies are used. Livestock production focuses on animal welfare and health care and organic feeding. For each animal, minimum indoor and outdoor room should be available. Natural and homeopathic medicines have preference and the feedstuffs should be organically produced (only a restricted number of additives is allowed).
These characteristics of organic farming management lead to a different costs and incomes modelling and structure with respect to conventional farming (Offermann, 2004; Acs et al., 2005; Anderson, 1994; Firth, 2002). On the costs side, there is an increase due to the need for special soil improvement and special pro-pagation material during the change of production system. So, the costs of plant protection and artificial fertilization decrease. Moreover, organic farming requires more intensive labour. There are more expenses for certification and administra-tion and for activities on organic markets. On the income side, organic premiums and subsidies play an important role in the compensation for lower yields and lo-wer marketable volume.
Notwithstanding some limitations in the FADN database, the inclusion of information about organic farming in FADN permits the database to be used to analyze economic results of organic farms and makes possible a comparison with conventional farms or between organic farms in different countries.
An EU research project named EU-CEEOFP (Further Development of Orga-nic Farming Policy in Europe with particular emphasis on EU Enlargement) sets
the guidelines for harmonization of income comparison between organic and con-ventional farms. The approach is to select a group of similar concon-ventional farms to compare with organic farms in order to minimise differences in management ability. Organic and conventional farms must have similar natural production con-ditions, the same type of location, similar production factor resources and similar farm types.
With regard to the analysis by country, the FADN database has been used in two important studies in ten countries:
• DG Environment commissioned a study in 2002 to analyze the effect of the CAP on environmentally-friendly farming systems using organic farming as exam-ple (analysis on direct payments based on data 2000)
• European Environmental Agency commissioned a study on the IRENA3 indica-tor Organic price and incomes (analysis on income indicaindica-tors based on data 2001)
Considering the second analysis on financial performance, the study made a comparison between the Farm Net Value Added per unit of farm labour (FNVA/ AWU, Agricultural Work Units) and Farm Family Income per Family Work Unit (FFI/ FWU) of organic and conventional farms. On average, the two kinds of farms achie-ved similar incomes. In six out of ten countries FNVA/AWU was similar or slightly higher on the organic farms. Overall, 56% of organic farms had higher incomes than their comparable conventional farm group.
In Italy, an important analysis of the organic farming sector based on the use of the Italian FADN dataset was carried out by INEA in the SABIO project (Carillo, 2008), the main aim of which was to estimate the added value generated by the or-ganic farming system in different political and market scenarios. More specifically, the FADN data were used to analyze the income and profitability of organic farms.
1.4.5 Other approaches
De Roest et al. (2004) refer to the calculation of milk production costs. The procedure is based on analytical accounting and uses data from a farm survey, according to a scheme formulated by the European Dairy Farmers.
The costs are divided into specific costs (exclusively concerning dairy pro-duction) and general costs (sustained for different activities on the farm). Both cost
3 Indicators reporting on the integration of environmental concerns in agricultural policy. There are 35 indicators and two of these (no.5 and no.7) specifically address organic farming.
types can be implicit or explicit. In this study, the overheads allocation is made using these coefficients:
Fodder Crop Surface Utilised Agricultural Area
Revenues from milk Total Revenues Revenues from meat
Total Revenues
These coefficients may also be used with FADN but it can be difficult to obtain the fodder crop surfaces in some European Union countries.
Another analysis was done by Pretolani (2004), who started from the FADN data related to specialized dairy farms to make a comparison between Italy and other European Regions. In this analysis, all farm costs are referred to the main production (milk), including the costs of other activities, considered as joint pro-duction. The total cost is the sum of implicit and explicit costs and is compared with the Equivalent Milk Production to obtain the unitary cost:
Total Cost
Equivalent Milk Production
The Equivalent Milk Production is obtained dividing the total farm revenues (without subsidies) by the price of milk produced on the farm. So, the value of milk is equal to the selling price. With this method, the farm is considered as one activi-ty (milk) and all the secondary productions are “translated” into milk. So, the total farm cost coincides with the milk cost.
Salghetti and Ferri (2005) use the previously described theory of Proni to compare a conventional and an organic dairy farm. The total cost includes explicit and implicit costs. The former are costs effectively incurred by the farm so they derive from the accountancy, while the latter concern the holder’s own production factors and need an estimation procedure, generally conducted with cost opportu-nity estimation methods.
To determine the secondary production costs, the sales invoices are taken into account, under the hypothesis of a perfect competition on the market that makes the costs equal to the income. Subtracting this cost from the total costs, an estimate of the total cost of principal production is obtained (in this case, milk). The unit cost is obtained dividing by the quantity of production.
Specific studies of the economics of milk production have been done by Col-man et al. (2004). These authors use the record of a representative sample of dairy units to generate estimates of the factors that influenced the economics of milk production in England and Wales. As concerns the cost allocation, the fixed costs are divided into two categories: direct costs (directly attributable to the dairy herd) and indirect costs (i.e. overheads). This latter category has been calculated using known levels of these costs on dairy farms from the Farm Business Survey, fol-lowing a costing procedure adopted by the Department for Environment Food and Rural Affairs (DEFRA) in its studies. This study is interesting because it applies a procedure to record and allocate the forage variable costs, taking into account grassland and fodder crops. These costs are allocated to the dairy enterprise on the basis of Livestock Unit Grazing Weeks (LUGWs). The LUGWs are calculated ta-king into account the total number of weeks that different classes of livestock were at grass during the year (additionally, quantities of conserved grass made during the year are converted into LUGWs).
Boone and Wisman (1998) refer to the calculation of production costs in the pig sector and the methodological problems encountered when comparing pro-duction costs within an international perspective. They start with FADN data and make some integrations with Eurostat prices. More specifically, in FADN, only the value of the purchases and sales of pigs is given. There is no information on the number of pigs or the weight of pigs traded. Moreover, FADN does not indicate technical data and so nothing can be said about the costs per kilogram. To solve this problem, they use the Eurostat price, in particular the price per kg live weight of fattened pigs to obtain the amount sold in terms of kilograms:
Amount sold (kg) = total sales (€)
Price (€/Kg)
They only consider those farms with no sales other than fattened pigs and with no purchases of piglets. Moreover, on these farms the revenues from pig sa-les are at least 75% of the total farm revenue.