Journal of Physics: Conference Series
PAPER • OPEN ACCESS
Modelling the pressurization induced by solar
radiation on above ground installations of LPG
pipeline systems
To cite this article: M Leporini et al 2017 J. Phys.: Conf. Ser. 923 012023
View the article online for updates and enhancements.
Related content
Python and Matplotlib Essentials for Scientists and Engineers: Downloading and installation
M A Wood
-Astronomical and Meteorological Conditions of a Solar System Operation
Danuta Proszak- Misik, Maria Bukowska, Krzysztof Nowak et al.
-A comparison of exhaust emissions from vehicles fuelled with petrol, LPG and CNG
P Bielaczyc, A Szczotka and J Woodburn
1234567890
35th UIT Heat Transfer Conference (UIT2017) IOP Publishing
IOP Conf. Series: Journal of Physics: Conf. Series 923 (2017) 012023 doi :10.1088/1742-6596/923/1/012023
Modelling the pressurization induced by solar radiation on
above ground installations of LPG pipeline systems
M Leporini1, A Terenzi2, B Marchetti3, G Giacchetta1, F Polonara1, F Corvaro1
and R Cocci Grifoni4
1Dipartimento di Ingegneria Industriale e Scienze Matematiche (DIISM), Università
Politecnica della Marche, via Brecce Bianche, Ancona, Italy
2Saipem S.p.A., via Toniolo 1, 61032, Fano (PU), Italy
3Facoltà di Ingegneria, Università degli Studi E-Campus, via Isimbardi 10, 22060
Novedrate (CO), Italy
4 School of Architecture and Design, Università di Camerino, Camerino (MC), Italy
E-mail:[email protected]
Abstract. Pipelining Liquefied Petroleum Gas (LPG) is a mode of LPG transportation more
environmentally-friendly than others due to the lower energy consumption and exhaust emissions. Worldwide, there are over 20000 kilometers of LPG pipelines. There are a number of codes that industry follows for the design, fabrication, construction and operation of liquid LPG pipelines. However, no standards exist to modelling particular critical phenomena which can occur on these lines due to external environmental conditions like the solar radiation pressurization. In fact, the solar radiation can expose above ground pipeline sections at pressure values above the maximum Design Pressure with resulting risks and problems. The present work presents an innovative practice suitable for the Oil & Gas industry to modelling the pressurization induced by the solar radiation on above ground LPG pipeline sections with the application to a real case.
1. Introduction
Liquefied Petroleum Gas (LPG) is a mixture of light hydrocarbons (simply propane or butane), gaseous at standard conditions (15°C and 1 bara) and maintained in the liquid state by increased pressure or lowered temperature [1]. Because of its high heating values, high purity, cleanness of combustion and easy of handling, it is used as a multipurpose material in the industrial chemical, commercial, residential, transportation and other sectors of economy [2].
A high-pressure pipeline system is an environmentally friendly way of transporting large volumes of LPG. In fact, it is characterized by less energy consumption and exhaust emissions than other modes of transportation (such as road and ship). In 1940, it was constructed the first LPG pipeline from the Panhandle field to other regions of Texas and other regions of the USA in association with the Phillips Petroleum Company [3]. Worldwide, there are over 350000 kilometres of pipelines transporting refined petroleum products (including LPG) and about 8000 kilometres of single phase pipelines what transport LPG (propane or butane) fluids. The advantage of pipeline transportation of LPG is that it can deliver a constant and steady supply of LPG without the need for intermediate storage along the distribution route. Conveyance of LPG by pipelines continues to grow in the world as the policy recognizes the environmental benefits of this type of transportation. Knowledge of the flow behaviour of the fluid under different operating conditions will assist researchers and engineers in designing these pipelines [4].
2 1234567890
35th UIT Heat Transfer Conference (UIT2017) IOP Publishing
IOP Conf. Series: Journal of Physics: Conf. Series 923 (2017) 012023 doi :10.1088/1742-6596/923/1/012023
The literature relating to pipelines transporting fluids similar to LPG from a thermodynamic point of view suggests that the hydraulics of the gas phase transport is much less efficient with respect to liquid/dense phase, since it is disadvantaged by the low density (and consequently large pipe diameter) and high pressure drops. To transport LPG efficiently by pipeline, the fluid must be transported in dense phase (which is defined by pressure values greater than cricondenbar). From a safety point of view, LPG is intentionally aromatized by refineries in order to detect gas leaks [5]. In fact, though LPG is non-toxic, it can be very dangerous if a partial or complete rupture of an LPG pipeline occurs. Pinhole or full-bore leaks can result in an accidental release, which can cause issues related to evaporation, vapour cloud propagation and dispersion. An enormous amount of gasification and energy release occurs with a pressure drop if an LPG pipeline is damaged for any reason, with possible catastrophic consequences for both the line and the surrounding [6]. In fact, when LPG pipeline ruptures occur, two conditions can manifest simultaneously: a particular flow behavior within pipeline and the formation of a vapour cloud extending beyond the leak location. For what concerns the flow after the rupture, in a LPG fluid pipeline (which is a HVP, i.e. high vapor pressure pipeline), differently from what happens for low vapor pressure fluid pipeline (LPV), all the fluid within the line drains off irrespective of elevation profile. Unlike LVP, for which the elevation profile helps to prevent the total fluid drainage, all the LPG contained in a section of a pipeline boils and vaporizes upon pipeline like. Instead, the second condition can lead to a boiling liquid expanding vapour explosion (BLEVE). Boiling liquid expanding vapor explosion (BLEVE) is the most dangerous scenario in the transportation of LPG [7]. BLEVE occurs when LPG (or other similar liquid) in a damaged pipeline gasifies quickly, causing extensive damage. The released gas ignites if this occurs in a quick and intense manner. Furthermore, BLEVE can create widespread fires or flares by a source and the resulting explosions can cause thermal radiation disasters [8]. Concerning the mechanism by which a BLEVE occurs, several authors have analyzed it and proposed theoretical treatments ([9][10][12]) but very few studies investigate the causes of initiation of leaks. In addition, there are different codes that industry follows for the design, construction and operation of LPG facilities. The codes used by the Oil & Gas industry are the main standards related to the pipeline transmission, such as ANSI/ASME B31.4 and B31.8, CSA (Canadian Standard Association) Z662-03 and BS-EN (BSI/European Code) 1442, BS-EN12252 and other practices for engineers provided by the UL International Institution of Gas Engineers and Managers (IGEM).According to the aforementioned international standards, the main consideration to be done during the design and operation of LPG pipelines are the same for the other HVP product pipelines: hydraulics, material fracture control properties, pumping, operation procedures, etc. However, no practices are provided in order to take into account phenomenon that can lead to a formation of leaks and fractures. In fact, various mechanisms can cause the initiation of fractures in a LPG pipeline: operating scenarios that lead the fluid pressure above the Design Pressure (such as water hammer, restart after a shut-down or ramp-up, pigging), the depressurization which can determine temperatures of the pipeline construction material too low (lower than the minimum design temperature) as consequence of liquid pools accumulation within dips (as normally is in hilly terrains) [11], corrosion, the heat radiation from a fire, the pressurization induced by the solar heat radiation, and other phenomenon. In particular, the pressurization induced by the solar radiation can lead the pipeline to operating pressures above the Design Pressure (DP) and this can generates leaks, fractures and most catastrophic scenarios. The design of a LPG pipeline depends on the characteristics of the product it contains and takes into account the fluid vapour pressure at the maximum temperature within the line. This is particularly important in hot countries where heat from solar radiation can cause the liquid within the pipeline to expand, exerting greater pressure [13]. The pipe construction material and the pipeline wall thickness are chosen also in function of the maximum allowable operating pressure; also for this reason, it is very important in the Oil & Gas industry to properly calculate the maximum pressures experienced by the transported fluid and then by the pipeline.
In the present paper, the effect of the solar radiation on the heat transfer on above ground pipeline sections is investigated. The solar radiation on the pipeline sections is modelled in the 1-D thermo-hydraulic simulator OLGA (version 2014.4) through a new method that can be used as standard in Flow Assurance studies. In the past, this method has been validated against field data for a natural gas system
1234567890
35th UIT Heat Transfer Conference (UIT2017) IOP Publishing
IOP Conf. Series: Journal of Physics: Conf. Series 923 (2017) 012023 doi :10.1088/1742-6596/923/1/012023
and it has been extended to an LPG system in the present study [14]. OLGA is a transient one-dimensional commercial multiphase flow simulator, which is used by the Oil & Gas industry for the multiphase flow design of wells and pipelines. The thermodynamics of the fluid is modelled by the commercial code PVTsim Nova version 3 and Peng-Robinson equation of state is used [15].
2. Governing Equations and Methodology
The pipeline hydraulic calculations are carried out trough OLGA code by solving a set of coupled first-order, nonlinear, one-dimensional partial differential equations. OLGA is a modified two-fluid model, which is able to treat water as a separate third phase in addition to oil and gas phases. In fact, separate continuity equations for the gas (Eq. 1), oil in liquid layer (Eq. 2) and liquid droplets (Eq. 3) are applied; these are coupled through interfacial mass transfer. Only two momentum equations are used, one for the continuous liquid phase (Eq. 4) and one for the combination of gas and possible liquid droplets (Eq. 5). The velocity of any entrained liquid droplets in the gas phase is given by a slip relation. One mixture energy-conservation equation is applied (Eq. 6); both phases are at the same temperature. This yields six conservation equations to be solved (if the water option is not taken into account): three for mass, two for momentum, and one for energy [16].
A u ρ V
Ψ Gg z A 1 ρ V t g g g g g g (1)
e d l d l l g l l l l l Ψ Ψ G V V V Ψ V ρ u A z A 1 ρ V t (2)
Ψ Ψ Gd V V V Ψ V ρ u A z A 1 ρ V t l d e d d g d l d l d (3)
sin z V g ρ ρ d V u Ψ u Ψ u V V V Ψ g.cos ρ V 4A P u u ρ 2 1 λ 4A P u u ρ 2 1 λ u V ρ A z A 1 z p V u ρ V t l g l l d d i e a d l l g l l i r r g i l l l l l 2 l l l l l l l (4)
a e i d d d l d g l d g g i r r g i g g g g g 2 d d l 2 g g g d g d l d g g g u Ψ u Ψ u V V V Ψ g.cos ρ V ρ V 4A P u u ρ 2 1 λ 4A P u u ρ 2 1 λ u V ρ A u V ρ A z A 1 z p V V u ρ V u ρ V t (5) U H gL H m gL H m gL H m gL e m z gL e m gL e m s d d l l g g d d l l g g 2 d d 2 l l 2 g g 2 d 2 l 2 g u 2 1 u u 2 1 u u 2 1 u z u 2 1 u 2 1 u 2 1 t (6)where the subscripts g, l, i, and d indicate gas, liquid, interface, and droplets, respectively. The subscript e indicates the droplet entrainment. In addition, ρ is the fluid density, u the fluid velocity, z the longitudinal coordinate, p the pressure, A the pipe cross-sectional area, Ψg is the mass transfer rate
between the phases, Ψe and Ψd are the entrainment and deposition rates, V is the volume fraction, Gf is
the possible mass source of the phase f, ϑ is the pipe inclination with the vertical and P is the wetted perimeter by each phase. e is the internal energy per unit mass, L the elevation, Hs the enthalpy from
mass sources, and U the heat transfer from pipe walls. OLGA uses a finite difference scheme on a staggered grid for the spatial discretization.
The basic thermal coupling in OLGA considers radially symmetric heat transfer between the fluid inside a section of a flowpath and the ambient through a set of concentric wall layers (which can
4 1234567890
35th UIT Heat Transfer Conference (UIT2017) IOP Publishing
IOP Conf. Series: Journal of Physics: Conf. Series 923 (2017) 012023 doi :10.1088/1742-6596/923/1/012023
represent the pipe wall, insulation material, etc). The inner pipe wall temperature Tiw is related to the
environment temperature Tamb and can be calculated based on the heat flux through the pipe wall and to
the environment. OLGA sets up a system of dynamic equations describing the heat flow and heat storage in the pipe wall, which determine the average temperature in each wall layer. The heat transfer process between the pipeline internal fluid and the environment is due to different contributions:
• internal convection between fluid and pipe wall; • conduction through pipe wall layers;
• external conduction through soil for pipeline buried sections, or external convection for the above ground sections.
The temperature time trend during a transient calculation and/or along the pipeline length is obtained, starting from specified initial conditions, by considering both the fluid cooling by expansion (Joule-Thompson effect) and the heat exchange between fluid inside the pipeline and the external environment through the pipe wall. The heat transfer coefficient between a pipe wall surface and a fluid is calculated by recognized engineering relations and the Nusselt number, Nu, is calculated by the following equations (where Re is the Reynolds number and Pr is the Prandlt number):
• for turbulent flow, Re>104, according to Sieder-Tate correlation [17]:
3 1 8 . 0 (Pr) Re 027 . 0 Nu (7)
• for transition zone, 2300<Re<104, according to Ramm [17]:
3 1.85 1 8 . 0 Re 10 6 1 (Pr) Re 027 . 0 Nu (8)
• for laminar flow (natural convection), Re<2300: max 0.184( Pr)3,3.66 1 Gr Nu (9)
where Gr is the Grashof number and the equations to calculate Gr number depend on the pipe orientation (vertical or horizontal). If the inequality (Gr/Re2) << 1 is satisfied, free convection effects
may be neglected and Nu =f(Re, Pr). Conversely, if (Gr/Re2) >>1, forced convection effects may be
neglected and Nu= f(Gr,Pr). The combined effects of free and forced convection is considered when (Gr/Re2) ≈1. The transient conduction through the pipe wall layers is simulated integrating the Fourier’s
equation for a cylindrical geometry, along the radial direction:
r T rk t r t T cp w w w 1
(10)where r is the radial coordinate, ρw the density of w-th pipe wall layer, cpw the heat capacity of w-th
pipe wall layer, kw the thermal conductivity of w-th pipe wall layer. The equation system for
temperatures in the wall layers is solved simultaneously with the energy balance equation (Eq. 6), thus ensuring an implicit coupling between the fluid temperature and the temperature in the wall layers.
The external heat transfer coefficient depends on the considered environment. Modelling for above ground segments is implemented by simulating the external forced convection through an outer wall heat transfer coefficient, hamb, computed by OLGA for convection in water or air or user given and based
on the type of ambient medium (in this case fluid properties and velocity of the ambient fluid must be provided). Of course, above ground pipeline sections are subjected also to the thermal radiation effects but OLGA does not implement a model for the simulation of the solar radiation. Maybe the reason is that under normal operating conditions, the exposure of the above ground portions of the pipeline to high intensity solar radiation does not pose any major design problems. In fact, the flowing fluid in the pipeline, by carrying away most of the incident heat flow, will level down the temperature peaks and
1234567890
35th UIT Heat Transfer Conference (UIT2017) IOP Publishing
IOP Conf. Series: Journal of Physics: Conf. Series 923 (2017) 012023 doi :10.1088/1742-6596/923/1/012023
the subsisting differential thermal expansion is easily accommodated by well-established design techniques. However, other operating scenarios like routine maintenance, emergency repairs or pumping power loss, may require that pipeline valves be shut off to isolate specific sections of the pipeline. As a consequence, the fluid enclosed in these sections, if subject to high heat fluxes, may experience considerable temperature rises [18]. The expanding fluid may cause internal pressures close to the pipeline design pressures with risks of leaks and bursts. This is particular set of conditions for pipeline operation, often not considered by conventional design analyses and neglected by most current specifications. Here below, the methodology developed to simulate this condition is presented.
OLGA implements a model to simulate the electrical heating of the lines (ELECTRICHEAT option). Electric heat tracing or electrical heating, is in fact a system widely used in the Oil & Gas field to maintain or raise the temperature of pipes, to prevent hydrate formation and wax deposition in oil production, to protect pipes from freezing, etc. [19]. The types of electric heat trace cables are four[20]: self-regulating (the cables vary their heat output based on the heat requirements of the system and can be cut to the exact length needed), constant wattage (the cables are used when high heat output or high temperature exposures are required; they can maintain temperatures up to 300°F), mineral insulated trace (it is used when there is even higher heat output, higher exposure temperatures, or resistance to environmental corrosives or abrasives), and series resistance and skin tracing (they are typically used in pipeline applications requiring long runs of pipe). OLGA allows the simulation of fourth kind of electric heat tracing method, with a constant heat absorbed along the pipeline. In order to simulate by OLGA the pressurization induced by the solar heat radiation, the authors suggest a method that uses the aforementioned “ELECTRICHEAT” option in OLGA. The solar radiation impact is simulated by imposing the relevant thermal power input over the pipeline exposed surface, and assuming an absorption coefficient function of the relevant paint colour. As the ELECTRICHEAT option takes heat absorbed by thermal radiation in terms of W/m, heat absorbed by the pipe is calculated as follows:
e
D
(11)
where Ω is the absorbed solar radiation power per unit length, β the pipeline external coating absorption coefficient, α the solar radiation power. Solar radiation impact calculations must be carried out by considering daily variation of absorbed radiation power per unit length.
3. Results and Discussion
The model presented by the authors for simulating the pressurization induced by thermal solar radiation through OLGA code is applied to a practical case in order to show the useful practice that can be adopted in flow assurance studied.
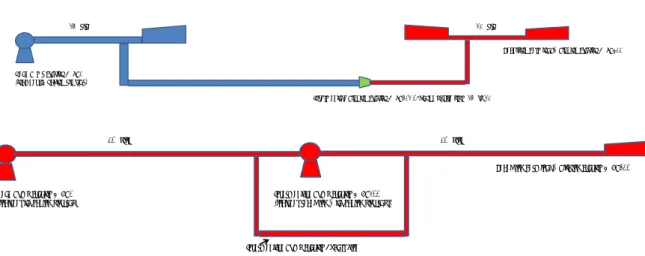
A LPG consortium planned a large-scale development to import Liquefied Petroleum Gas from the American market in an Asian country. A LPG transmission pipeline, called the "LPG Pipeline", is a major component of the development; it is about 500km long. During the design phase of the line, two possible hydraulic configurations have been studied; they are shown in
Figure 1. The first one (Alternative 1) presents a first 24” pipeline long approximately 402km, running from KP0 to a tie-in where LPG is delivered to a plant for direct usage while the remaining LPG is transported through a 20” line to the delivery point. The second one (Alternative 2) considers a 20” constant diameter pipeline with one intermediate pumping station. The pipeline is considered buried and only some above ground sections are subjected to the solar thermal radiation.
With reference to the hydraulic configurations reported in
Figure 1, the following above ground pipe sections are studied for pressurization induced by solar radiation, with reference to a long term shutdown: 24” pump suction pipe at head pumping station, 24” pump discharge pipe at head pumping station, 24” pipe at intermediate pigging station, 20” pipe at intermediate pigging station, bypass lines in one 24” MLV (Mainline Valve Station) station, bypass lines in one 20” MLV station, 20” pump suction pipe at head pumping station, 20” pump discharge pipe at head pumping station, 20” pipe at intermediate pump station (pump suction and discharge sides) and
6 1234567890
35th UIT Heat Transfer Conference (UIT2017) IOP Publishing
IOP Conf. Series: Journal of Physics: Conf. Series 923 (2017) 012023 doi :10.1088/1742-6596/923/1/012023
bypass lines in one 20” MLV station. Based on the above, 6” and 8” above ground pipe sizes can be analyzed to evaluate pressurization induced by solar radiation.
Figure 1. LPG Pipeline. Hydraulic Configurations Investigated.
Alternative 1 (upper) and Alternative 2 (lower).
The above pipes are considered isolated sections. Simulations must be performed to verify the investigated sections in terms of maximum fluid pressure induced by solar radiation, in order to avoid values above the maximum Design Pressure and the possibility of initiation of ruptures. The study is performed considering two reference external air temperatures [21]: 40°C (relevant to the warmest day of the year) and 50 °C (verification for extreme maximum ambient temperature scenario). Starting from these values two different daily temperature trends are developed according to a typical day air temperature evolution, while an average wind velocity equal to 2 m/s has been assumed. The solar radiation trend has been developed considering the following input data [22]: a peak value at noon equal to 1200 W/m2, a monthly average direct normal irradiance of 7.5 kWh/m2/day, a sunshine at 6:00 am
and the sunset at 8:00 pm. The absorption coefficient, β, is assumed 0.75 for bare pipe and 0.3 for pipes with white painting [23].
Simulations must be performed to verify the investigated sections in terms of maximum fluid pressure induced by solar radiation, in order to avoid values above the maximum design pressure on the basis of the technical data and ambient conditions. Pressurization can be studied in general starting from the maximum operating pressure, i.e. 101 bar (except for the head pumping station suction pipe, for which the maximum operating pressure is 31 bar at 0 °C). Carbon steel is considered as pipe construction material. Initial temperatures are:
• -5°C for the suction pipe of head pumping station (in this case the initial pressure is 31 bar) • 0°C for the discharge pipe of head pumping station
• 35°C for the discharge pipe of intermediate pumping station • 25°C for the suction pipe of intermediate pumping station
The LPG fluid studied is composed mainly by propane (60.6 molar percentage) plus small fractions of ethane, butane and pentane. Figure 2 shows the phase envelope of fluid used, obtained by PVTsim Nova code by Calsep.
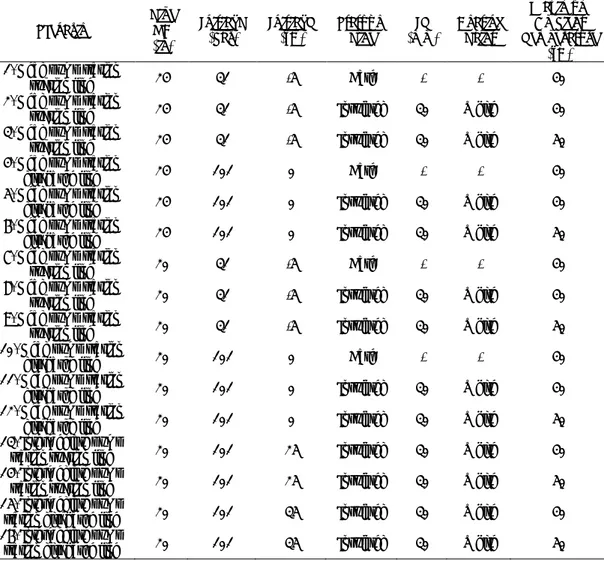
The summary of the solar radiation simulation scenarios for the isolated sections investigated is reported in Table 1. Polyisocyanurate is considered as insulation material and an insulation thickness (IT) of 30 mm has been calculated in order to avoid sweating.
16" + 12" Main Pipeline Configuration - 1 Head pump station
24" pipe 20" pipe
Receiving Terminal & Pigging Station @ KP500
Head Pump Station @ KP0 (includes launching pig trap)
Intermediate Pigging Station @ KP402 - Change of size from 24" to 20"
20" pipe 20" pipe
Receiving Terminal & Pigging Station @ KP500 Head Pump Station @ KP0 Intermediate Pump Station @ KP300
(includes launching pig trap) (includes receiving & launching pig traps)
1234567890
35th UIT Heat Transfer Conference (UIT2017) IOP Publishing
IOP Conf. Series: Journal of Physics: Conf. Series 923 (2017) 012023 doi :10.1088/1742-6596/923/1/012023
Figure 2. LPG Fluid Used in the Present Study.
Table 1. Summary of Above Ground Sections Calculation Scenarios.
Scenario
Pipe ND (in)
Initial P
(bar) Initial T (°C) Status of Pipe (mm) IT Coating Paint
Maximum Ambient Temperature
(°C)
1. Head pump station
suction line 24 31 -5 Bare - - 40
2. Head pump station
suction line 24 31 -5 Insulated 30 White 40
3. Head pump station
suction line 24 31 -5 Insulated 30 White 50
4. Head pump station
discharge line 24 101 0 Bare - - 40
5. Head pump station
discharge line 24 101 0 Insulated 30 White 40
6. Head pump station
discharge line 24 101 0 Insulated 30 White 50
7. Head pump station
suction line 20 31 -5 Bare - - 40
8. Head pump station
suction line 20 31 -5 Insulated 30 White 40
9. Head pump station
suction line 20 31 -5 Insulated 30 White 50
10. Head pump station
discharge line 20 101 0 Bare - - 40
11. Head pump station
discharge line 20 101 0 Insulated 30 White 40
12. Head pump station
discharge line 20 101 0 Insulated 30 White 50
13. Intermediate pump
station suction line 20 101 25 Insulated 30 White 40
14. Intermediate pump
station suction line 20 101 25 Insulated 30 White 50
15. Intermediate pump
station discharge line 20 101 35 Insulated 30 White 40
16. Intermediate pump
8 1234567890
35th UIT Heat Transfer Conference (UIT2017) IOP Publishing
IOP Conf. Series: Journal of Physics: Conf. Series 923 (2017) 012023 doi :10.1088/1742-6596/923/1/012023
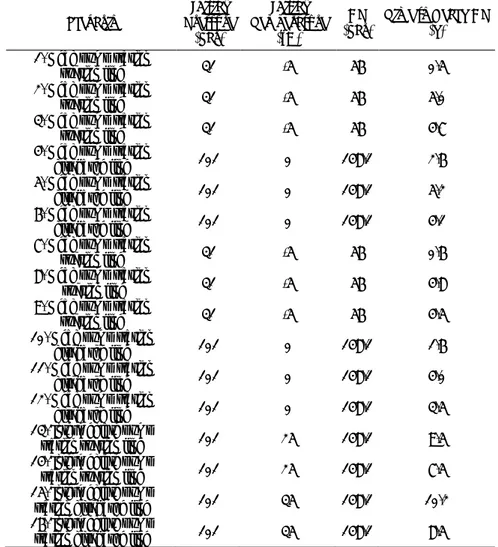
Table 2 shows the results of the study in terms of time needed to reach the design pressure in the above ground pipe sections and fluid temperature at Design Pressure (DP) condition, with reference to a long-term shutdown.
Table 2. Solar Radiation Study Results. Time to Reach Design Pressure and Fluid Temperature at
Design Pressure Condition.
Scenario Initial Pressure (bar) Initial Temperature (°C) DP
(bar) Time to Reach DP (h)
1. Head pump station
suction line 31 -5 56 0.5
2. Head pump station
suction line 31 -5 56 5.0
3. Head pump station
suction line 31 -5 56 4.7
4. Head pump station
discharge line 101 0 148.1 2.6
5. Head pump station
discharge line 101 0 148.1 5.2
6. Head pump station
discharge line 101 0 148.1 4.1
7. Head pump station
suction line 31 -5 56 0.6
8. Head pump station
suction line 31 -5 56 4.8
9. Head pump station
suction line 31 -5 56 4.5
10. Head pump station
discharge line 101 0 148.1 1.6
11. Head pump station
discharge line 101 0 148.1 4.0
12. Head pump station
discharge line 101 0 148.1 3.5
13. Intermediate pump
station suction line 101 25 148.1 9.5
14. Intermediate pump
station suction line 101 25 148.1 7.5
15. Intermediate pump
station discharge line 101 35 148.1 10.2
16. Intermediate pump
station discharge line 101 35 148.1 8.5
From the previous results referred to solar radiation induced pressurization in isolated sections, it can be concluded that during a prolonged shutdown, all the investigated above ground sections could have a pressure raised up to the maximum limit of the rating sizing. The isolated sections subject to an excessive pressurization must be protected by Thermal Relief Valves (TSV) which have a set pressure equal to the rating sizing design pressure.
It has been shown that the modelling of the solar radiation effect proposed by authors can help engineers to properly design safety equipment, by investigating all the technical solutions before and during the engineering phase of a pipeline (and process equipment) project. In fact, if the investigated pipeline sections are not protected by TSVs, the pressure can reach values above the design pressure and the mechanical integrity of the pipe can be compromised.
1234567890
35th UIT Heat Transfer Conference (UIT2017) IOP Publishing
IOP Conf. Series: Journal of Physics: Conf. Series 923 (2017) 012023 doi :10.1088/1742-6596/923/1/012023
4. Conclusions
The present work examines a particular set of conditions for pipeline operation, often not considered by conventional design analyses: the pressurization induced by solar radiation which can lead above ground pipeline sections to operating pressures above the design pressure and consequent leaks, fractures and most catastrophic scenarios. The solar radiation on the pipeline sections is modelled in the 1-D thermo-hydraulic simulator OLGA through a new method that can be used as standard in Flow Assurance studies. Through the application of the above model to a practical pipeline design case, it was shown how it works, the steps to follow and the various capabilities. The target of this study is to provide indications for the engineering analysis of such kind (HVP fluids) of pipelines.
5. References
[1] Mohitpour M, Jenkins A and Babuk T 2006 Proc. Int. Pipeline Conference ASME (Calgary) pp 531-538
[2] World LP Gas Association (WLPGA) 2015 Guidelines for Good Safety Practices in the LP Gas Industry
[3] TSHA (The Texas State Historical Association) 2002 The Handbook of Texas Online
[4] Lasode OA, Popoola TO and Prasad B 2013 Proc. World Academy of Science, Engineering and Technology n° 78 p 386
[5] Zhang ZX, Wang GX, Massarotto P, Rudolph V 2006 Energy Convers. Manage 47 pp 702-715 [6] Bozkurt M, Kulahci Y, Zor F, Kapi E 2008 J Burn Care Res 29 p 897-901
[7] Stawczyk J 2003 J. Hazard. Mater. B96 pp 189-200 [8] Birk A M 1996 J Loss Prevent Proc 9 pp 173-181 [9] Kumar P 2013 Burns 39 1479–87
[10] Casal J, Arnaldos J, Montiel H, Planas-Cuchi E and Vı´lchez J A 2001 In M. Fingas (Ed.), Handbook of hazardous spills (New York: McGrawHill)
[11] Terenzi A, Bonato E, Maggiore L 2016 Proc PSIG Annual Meeting (Vancouver) pp 1-13 [12] Reid R C 1979 Science 203 pp 1263-65
[13] Abbasi T, Abbasi S A 2007 Journal of Hazardous Materials 141 pp 489-519 [14] Terenzi A, 2010 Journal of Pipeline Engineering 9 p133-143
[15] Peng DY and Robinson DB 1976 Ind. Eng. Chem. Fundam. 15 pp 59-64 [16] Bendiksen K H, Malnes D, Moe R, Nuland S 1991 SPE Prod Eng 6 pp 171-180
[17] Bird RB, Stewart WE, Lightfoot E N 1960 Transport Phenomena (New York: John Wiley & Sons)
[18] Murat Tunç M, Taner Özkaynak F 1985 Appl Math Model 9 pp 16-20
[19] Urdahl O, Boernes A H, Kinnari K J, and Holme R Proc. Offshore Technology Conference (Houston) pp 161-167
[20] Baen PR 1993 Proc. Petroleum and Chemical Industry Conference (St Louis) pp 65-73 [21] DeMenocal PB, Rind D 1993 J GEOPHYS RES 98 pp 7265-72
[22] Perry RH, Green DW 1973 Perry’s Chemical Engineers’ Handbbok (McGraw-Hill Book Company)
[23] Siegel R, Howell JR 1992 Thermal Radiation Heat Transfer (Hemisphere Publishing Corporation)