Survival and divergence in a small group: The
extraordinary genomic history of the endangered
Apennine brown bear stragglers
Andrea Benazzoa,1, Emiliano Trucchia,b,1, James A. Cahillc, Pierpaolo Maisano Delserd,e,f, Stefano Monad,e, Matteo Fumagallig, Lynsey Bunnefeldh,i, Luca Cornettij, Silvia Ghirottoa, Matteo Girardik, Lino Omettol,m, Alex Panzieraa, Omar Rota-Stabellil, Enrico Zanettia, Alexandros Karamanlidisn, Claudio Groffo, Ladislav Paulep, Leonardo Gentileq, Carles Vilàr, Saverio Vicarios, Luigi Boitanit, Ludovic Orlandou, Silvia Fusellia, Cristiano Vernesik, Beth Shapiroc, Paolo Ciuccit, and Giorgio Bertorellea,2
aDepartment of Life Sciences and Biotechnology, University of Ferrara, 44121 Ferrara, Italy;bCentre for Ecological and Evolutionary Synthesis, Department of Biosciences, University of Oslo, Oslo 1066, Norway;cDepartment of Ecology and Evolutionary Biology, University of California, Santa Cruz, CA 95064; dInstitute de Systematics, Evolution, Biodiversite, UMR 7205-CNRS, Muséum National d’Histoire Naturelle, Université Pierre et Marie Curie, École Pratique des Hautes Études (EPHE), CP39, 75005 Paris, France;eEPHE, Paris Sciences & Lettres Research University, 75005 Paris, France;fSmurfit Institute of Genetics, Trinity College, University of Dublin, Dublin 2, Ireland;gDepartment of Life Sciences, Imperial College London, Ascot SL5 7PY, United Kingdom;hInstitute of Evolutionary Biology, University of Edinburgh, Edinburgh EH9 3FL, United Kingdom;iBiological and Environmental Sciences, University of Stirling, Stirling FK9 4LA, United Kingdom;jZoological Institute, University of Basel, 4051 Basel, Switzerland;kDepartment of Biodiversity and Molecular Ecology, Fondazione Edmund Mach, 38010 San Michele all’Adige, Italy;lDepartment of Sustainable Agro-Ecosystems and Bioresources, Fondazione Edmund Mach, 38010 San Michele all’Adige, Italy;mIndependent Researcher, 38016 Mezzocorona, Italy;nProtection and Management of Wildlife and the Natural Environment, ARCTUROS, 53075 Aetos, Florina, Greece;oForest and Wildlife Service, Provincia Autonoma di Trento, 38100 Trento, Italy;pDepartment of Phytology, Faculty of Forestry, Technical University, 96053 Zvolen, Slovakia;qVeterinary Service, National Park of Abruzzo Lazio and Molise, 67032 Pescasseroli, Italy;rDepartment of Integrative Ecology, Doñana Biological Station, Consejo Superior de Investigaciones Científicas, 4102 Seville, Spain;sInstitute of Atmospheric Pollution Research and Technologies, National Research Council, 70126 Bari, Italy;tDepartment of Biology and Biotechnologies“Charles Darwin,” University of Rome La Sapienza, 00185 Rome, Italy; anduCentre for GeoGenetics, Natural History Museum of Denmark, University of Copenhagen, 1350 K Copenhagen, Denmark
Edited by Stephen R. Palumbi, Stanford University, Pacific Grove, CA, and approved October 3, 2017 (received for review May 30, 2017) About 100 km east of Rome, in the central Apennine Mountains, a
critically endangered population of∼50 brown bears live in com-plete isolation. Mating outside this population is prevented by sev-eral 100 km of bear-free territories. We exploited this natural experiment to better understand the gene and genomic conse-quences of surviving at extremely small population size. We found that brown bear populations in Europe lost connectivity since Neo-lithic times, when farming communities expanded and forest burn-ing was used for land clearance. In central Italy, this resulted in a 40-fold population decline. The overall genomic impact of this decline included the complete loss of variation in the mitochondrial genome and along long stretches of the nuclear genome. Several private and deleterious amino acid changes were fixed by random drift; pre-dicted effects include energy deficit, muscle weakness, anomalies in cranial and skeletal development, and reduced aggressiveness. Despite this extreme loss of diversity, Apennine bear genomes show nonrandom peaks of high variation, possibly maintained by balanc-ing selection, at genomic regions significantly enriched for genes associated with immune and olfactory systems. Challenging the par-adigm of increased extinction risk in small populations, we suggest that random fixation of deleterious alleles (i) can be an important driver of divergence in isolation, (ii) can be tolerated when balancing selection prevents random loss of variation at important genes, and (iii) is followed by or results directly in favorable behavioral changes. balancing selection
|
genetic drift|
genetic load|
Ursus arctos|
Neolithic impact
L
iving in complete isolation at very small population size can drive a species to extinction because of several processes: (i) inbreeding, which unmasks recessive deleterious mutations, be-comes unavoidable when only few potential mates are available (1); (ii) genetic drift tends to prevail over natural selection, limiting ad-aptation and allowing deleterious variants to increase in frequency, possibly until fixation (2, 3); and (iii) low levels of variation are ex-pected, reducing the chances for an individual and for a population to have the genotypes best matching the environmental challenges (4). This conservation paradigm, strictly related to the extinction vortex metaphor (5), is supported by empirical evidence (6–8),but it is challenged by studies showing that selection can be powerful also at small population sizes (9, 10) and that survival and even demographic expansion can occur with almost no genomic variation (11). Interestingly, if extinction does not occur, drift in small isolated groups can produce, or contribute to, genetic and phenotypic divergence, possibly leading to speciation (12, 13).
To explore the pattern of genomic variation and divergence in a large mammal living in isolation at small population size but
Significance
A small and relict population of brown bears lives in complete isolation in the Italian Apennine Mountains, providing a unique opportunity to study the impact of drift and selection on the genomes of a large endangered mammal and reconstruct the phenotypic consequences and the conservation implications of such evolutionary processes. The Apennine bear is highly in-bred and harbors very low genomic variation. Several delete-rious mutations have been accumulated by drift. We found evidence that this is a consequence of habitat fragmentation in the Neolithic, when human expansion and land clearance shrank its habitat, and that retention of variation at immune system and olfactory receptor genes as well as changes in diet and behavior prevented the extinction of the Apennine bear.
Author contributions: A.B., E.T., L. Boitani, P.C., and G.B. designed research; J.A.C., M.G., A.K., C.G., L.P., L.G., C. Vilà, S.F., C. Vernesi, and G.B. performed research; A.B., E.T., J.A.C., P.M.D., S.M., M.F., L. Bunnefeld, L.C., S.G., L. Ometto, A.P., O.R.-S., E.Z., S.V., L. Orlando, S.F., and G.B. analyzed data; A.K., C.G., L.P., L.G., and C. Vilà provided samples; and E.T., B.S., P.C., and G.B. wrote the paper.
The authors declare no conflict of interest. This article is a PNAS Direct Submission. Published under thePNAS license.
Data deposition: The sequences reported in this paper have been deposited in GenBank’s sequence read archive (accession nos.PRJNA395974andMF593957–MF593987). 1A.B. and E.T. contributed equally to this work.
2To whom correspondence should be addressed. Email: [email protected].
This article contains supporting information online atwww.pnas.org/lookup/suppl/doi:10. 1073/pnas.1707279114/-/DCSupplemental.
EVOLUTI
ON
PNAS
attention on the last population of native Italian brown bear, the Apennine bear.
The Apennine bear consists of a critically endangered pop-ulation of ∼50 individuals living in the Apennine Mountains in central Italy (Fig. 1A and SI Appendix, Fig. S1) and is usually classified as the endemic subspeciesUrsus arctos marsicanus (14– 16). Several 100 km preclude any opportunity for natural gene flow between the Apennine bear and the closest brown bear populations in the Alps, even considering the peripheral area of occasional occurrence (SI Appendix, section S1.1). Human perse-cution has consistently reduced the geographic range and number of Apennine bears in the last few centuries. Even after the es-tablishment of the Abruzzo Lazio and Molise National Park in 1923 and the introduction of legal protection of this species since 1939, the population failed to increase, with reported mortalities mainly caused by deliberate or accidental killing (14). mtDNA data support a strict genetic affinity of the Apennine bear with the geographically closest brown bear populations in the Alps and the Balkans (17–19). Nevertheless, some level of morphological di-vergence, caused by drift or possibly associated with a diet shift, was inferred from the analyses of skull traits (16). How long the Apennine bear has lived in isolation is not known, but historical
at least four to five centuries (40–50 generations).
In this paper, we produced and analyzed whole genomes from brown bears sampled in the Apennine and in other European regions. We reconstruct the demographic history of fragmenta-tion and populafragmenta-tion size reducfragmenta-tion within Europe. We then take advantage of the Apennine bear as the result of a unique natural experiment designed to infer the effects of genetic drift on the genomes and phenotypes of a small and isolated population. As the Apennine bear is an iconic taxon of great interest for con-servation but the extinction risks are still unknown, our data will provide a genomic view into the current debate on the best strategy to protect this population.
Results and Discussion
We performed whole-genome sequencing of six Apennine bears and six additional European brown bears from Greece (two in-dividuals), Slovakia (two inin-dividuals), the Alps (one individual), and western Spain (one individual) (Fig. 1A and SI Appendix,
Table S1). The Alpine individual was born in south Slovenia but
sampled about 400 km west in the Adamello National Park in Italy, where it was released in the year 2000 during a reintro-duction project (21). Paired end Illumina sequences were aligned
A
D
B
E
C
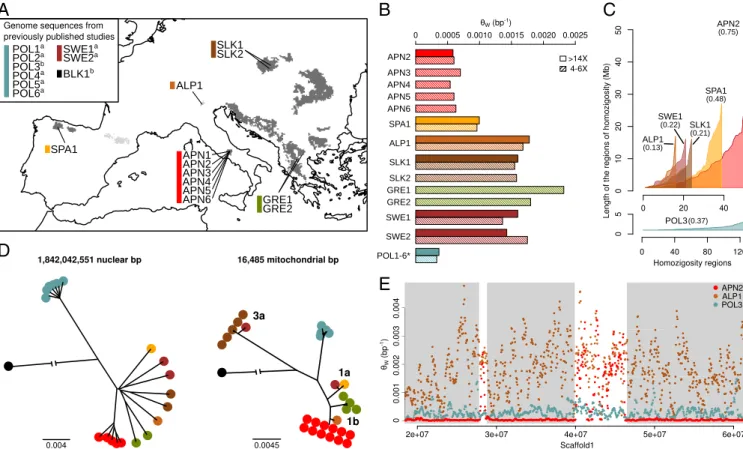
Fig. 1. Phylogenetic relationships and patterns of homozygosity of the European brown bear. (A) Geographic distribution of the brown bear samples se-quenced in this study: SLK (brown), ALP (light brown), SPA (yellow), APN (red), and Greece (GRE; green). Samples from previous studies: polar bear from Greenland (POL; light blue), brown bear from SWE (dark red), and black bear from Alaska (BLK; black). The European brown bear range is shown as dark gray (wild) and light gray (reintroduced in recent times).aRef. 22.bRef. 27. (B) Average heterozygosity per site (θW) in brown bear individuals sequenced at different depths. Genome sequences from two Swedish brown bears and one polar bear individual (* indicates that all 6 polar bears have very similar levels of variation) from previously published studies are also included. Analyses are also replicated in high-coverage individuals after down-sampling the raw reads (striped bars). (C) Long regions of homozygosity (>1 Mb with more than 99.95% of homozygous calls in contiguous 50-kb windows) in ascending length order. Note that brown bear (Upper) and polar bear (Lower) tracks are on different x- and y-axes scales. The area under each plot is proportional to the fraction of the genome (shown in parentheses) that can be assigned to these fragments. (D) Neighbor-joining tree using the whole-genome sequence (Left) or the whole-mitochondrial genome sequence (Right). The mitochondrial genome has also been sequenced in 11 additional samples (SI Appendix, section S6). Note that Swedish samples have two different mitochondrial haplotypes clustering with the Slovakian samples and the Spanish sample. (E) Examples of the genomic variation along>40 Mb of scaffold 1 in an Apennine brown bear individual (red), an Alpine brown bear (brown), and a polar bear (blue). Long windows of homozygosity in the Apennine sample are shaded in gray.
to the polar bear reference genome (22), and data analyses were performed on these and other available whole-genome data (SI
Appendix, Table S1) from two Swedish brown bears, six polar
bears, one black bear, and the panda. Four individuals (one from the Apennine, one from the Alps, one from Slovakia, and one from Spain) were sequenced at an average depth of coverage of ∼15× vs. ∼5× for all other individuals. One Apennine individual was excluded from downstream analysis of nuclear sequences because of lower depth of coverage (2.4×). Genetic variation statistics and downstream statistical analyses, when based on ∼5× genomes, were computed using genotype likelihoods. Pattern of Variation and Inbreeding Estimates.All of the Apennine bears in our sample show the same mitochondrial genome se-quence. Their nuclear genome has∼2/3 and 1/3 of the hetero-zygous sites observed in the Spanish bear and the other brown bears, respectively, and twice as much variation as the polar bear (Fig. 1B and SI Appendix, Tables S3 and S4). Direct estimates on>15× genomes and likelihood-based estimates on ∼5× ge-nomes produced very similar values. Apennine bears show strong patterns in the amount of variation along the nuclear genomes, with long stretches of several megabases of no or almost no variation alternating with regions characterized by levels of variation similar to those observed in other brown bears (Fig. 1E). Long regions of homozygosity, identified as genomic re-gions>1 Mb where the number of heterozygous sites is never larger than 25 every 50 kb, cover approximately three-quarters of the Apennine genome (Fig. 1C) and have, on the average, five heterozygous sites every 200 kb. This pattern is not seen in other brown bear or polar bear genomes.
The distribution of genetic variation along individual genomes is informative of recent inbreeding (23, 24). In particular, inbred individuals are expected to have long genomic fragments with both average and low heterozygosity values, producing a bimodal distribution of variation when estimated in windows across the genome (25). While all analyzed brown bear individuals pro-duced a bimodal distribution of heterozygosity estimates, the estimated inbreeding coverageF, which is based on estimates of the proportion of the genome with low heterozygosity, varied significantly across individuals (SI Appendix, section S2). Apen-nine bears are highly inbred, with F values between 0.69 and 0.77, with the Spanish bear as the next most inbred (F = 0.57). All other brown bears showF values lower than 0.29. Two points should be noted here. First, inbreeding coverage is known to be correlated with the inbreeding coefficient estimated with pop-ulation genetics methods or from pedigrees (26), meaning that theF values estimated in the Apennine bears correspond to the value expected in a large population after six generations of full sibling mating. Second,F values are not solely a consequence of the average variation levels. Polar bears have lower genetic variation than Apennine bears, but they also have very different distribution of variation along the genome (Fig. 1C and E), with either zero or close to zero estimated inbreeding coefficients (SI
Appendix, Fig. S4). This is probably a consequence of a longer
history at low density and high connectivity in polar bear com-pared with Apennine bear (22, 27). Apennine bear genomes likely accumulated the effects of strong inbreeding occurring recently, but the fraction of their genomes at high variation still reveals a past history at much higher effective population size. Demographic Dynamic.The inferred demographic trajectory of the Apennine bear before 10 kya is similar to what is observed in other areas in Europe (Fig. 2A andSI Appendix, Fig. S6) and in Alaska (27). We observe a long-term effective population size fluctuating around 20,000–40,000 individuals followed by a drastic decline by approximately one order of magnitude starting ∼100 kya. The simplest explanation for this decline is the cli-matic cooling associated with the last glacial period, which began
after∼110 kya (28). We find evidence for two different dynamics in brown bear populations at the onset of Holocene warming ∼15–10 kya (Fig. 2A and SI Appendix, Fig. S6): (i) the “conti-nental pattern,” where the decline stops and the effective pop-ulation sizes remain constant at around 2,000–3,000 individuals in central and northern Europe [Slovakia (SLK1), Italian Alps (ALP1), and Sweden (SWE1) inSI Appendix, Fig. S6]; and (ii) the “peninsular pattern” with a transitory expansion, which is evident in Spain but possible also in the Apennine bear based on the bootstrap analyses, followed by an additional and final de-cline to a very small population size [Spain (SPA1) and Italian Apennine (APN2) inSI Appendix, Fig. S6].
Demographic dynamics reconstructed from single genomes using pairwise sequentially Markovian coalescent (PSMC) proved very reliable under some simulation scenarios (29) but tend to smooth out steep changes (30) and should be considered with caution when the inference refers to recent events (31–33) or coverage is low (34). We, therefore, further explored the main demographic process that shaped the Apennine genomic varia-tion by performing two addivaria-tional analyses based on different statistical approaches and exploiting different information in the data. First, we used the approximate Bayesian coalescent ap-proach (35), with site frequency spectra as summary statistics (SI
Appendix, section S3.2). This analysis supported a rapid and
∼40-fold decline of the Apennine bear effective size at ∼2,500– 8,800 y ago (peak probability 4 kya), starting from a population size of several tens of thousands of individuals (Fig. 2B). Second, we simulated single genomes under different bottleneck sce-narios and compared the variation in 50-kb fragments with that observed in the Apennine high-coverage genome. The best fit model assumed that population decline began a few thousand years ago, starting from several thousand individuals and de-clining to a few hundred individuals (Fig. 2C). Considering these results and the shared demographic dynamics inferred among all brown bears before 10 kya, we conclude that the low level of genetic variation found in the Apennine bear is a consequence of its rapid and recent decline in population size. As discussed below, we believe that this result does not necessarily imply a large Apennine bear population in the past, but it is instead the signature of the process of fragmentation of a previously con-nected pan-European population.
Divergence and Fragmentation History. We estimated a whole-genome neighbor-joining tree (Fig. 1D), which shows an almost instantaneous split separating brown bears originating in differ-ent geographic areas. This topology implies that Apennine bears are differentiated to the same degree from all of the other Eu-ropean brown bears, regardless of their geographic distance from those bears. The tree also indicates that Apennine bears are very similar to each other, more than what is observed among indi-viduals from other geographic areas (see also the STRUCTURE analysis inSI Appendix, Figs. S12 and S13).
We next inferred the history of connectivity among European bear populations using an Approximate Bayesian Computation (ABC) approach under a nonequilibrium island model (SI
Ap-pendix, section S5.2) (35). We assumed that a metapopulation
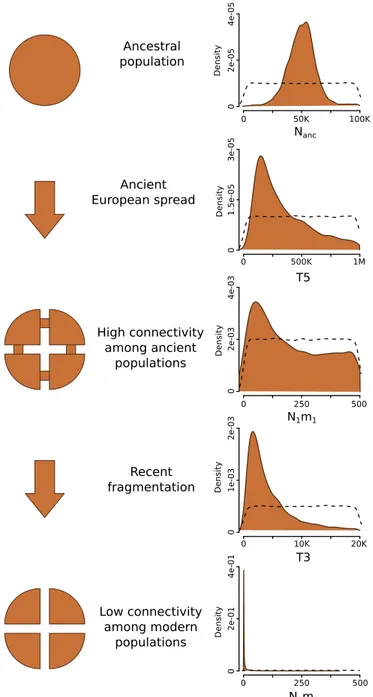
with a large number of demes originated from a single panmictic population. The connectivity parameterNm (N = effective size, m = migration rate) controls the genetic divergence among demes, and we allowed it to vary in three time intervals. In our model, one of the demes represents the Apennine bear pop-ulation, and this deme becomes completely isolated at some point in the past. Allele frequency spectra were computed from ∼5,000 noncoding loci with a length of 4,000 bp each and used as summary statistics to compare observed and simulated data, to estimate the posterior densities of Nm, and to estimate the timing of evolutionary events. The results of this analysis (Fig. 3) suggested that (i) an ancestral population split occurred a few
EVOLUTI
ON
PNAS
100 kya, compatible with the estimated arrival of the brown bear in Europe (36); (ii) a constant and high migration rate, not lower than several dozen animals per generation, existed between demes since the ancestral split and until a few thousand years ago, when the migration rate dropped to a few individuals; and (iii) the Apennine bear has been completely isolated from other European bear populations since∼1,500 y ago (SI Appendix, Table S6), but the uncertainty interval for the estimated timing of this event and the timing of disruption of global connectivity overlap.
The switch from very high to very low (or zero) population connectivity can be seen as a fragmentation event with an age that corresponds approximately to the divergence time between groups. We, therefore, applied theF statistic approach used to study the human–Neanderthal split (37) to validate our results. This analysis, which is based on the fraction of derived alleles shared among individuals, suggests that the Apennine bear diverged between 2 and 3 kya, a date very close to the estimated fragmentation age
(SI Appendix, Fig. S15). An additional ABC analysis based on the
pairwise comparison among genomes supports the view that the Apennine bear has not exchanged genes with other populations since a few thousand years (SI Appendix, section 5.3).
In summary, our results (Figs. 1–3) jointly support the following scenario for the brown bear in Europe. After initial colonization, a large and still panmictic population was severely affected by the last glacial interval in terms of effective size but not connectivity. Population decline ceased at the onset of Holocene warming, when population sizes possibly increased in southern areas of Europe. In the last few thousand years, extreme contractions in habitat and
population size occurred in Spain and in the Apennine bear, and fragmentation increased among bear populations across Europe. The estimated timing of this fragmentation is compatible with the trend of forest clearance and land cover change related to the in-troduction and diffusion of agricultural technologies (38–40). In particular, the ice core levoglucosan flux (a biomarker of fire emissions) started to slowly increase in the Holocene, reached two peaks at around 5.5 and 2.5 kya, and then, began to decline (40), consistent with the drop in the forest clearance rate in Europe (41). It seems, therefore, that this second demographic decline was caused mainly by the contraction of habitat caused by farming, which profoundly modified the genetic structure among bear pop-ulations. Humans have further impacted bear populations in more recent times, driving this species to extinction in several regions (42). mtDNA Genomes. The unique and identical mtDNA sequence observed in all Apennine bears is differentiated from the mtDNA genomes found in the Alps (∼20 mutations), Greece (∼70), Spain (∼100), and Slovakia (∼300). Our data are com-patible with the known phylogeographic structure in mtDNA found in Europe (Fig. 1D): three major clades can be identified, usually called 1a (Spain and southern Sweden), 1b (Italy, Balkans, and southern Carpathians), and 3a (northeastern Europe), that are usually associated with different glacial refugia and post-glacial recolonization processes (36). This pattern was not ob-served in the nuclear genomes, and it implies a strong genetic barrier in Sweden and a strict affinity between Apennine and Alpine bears. The discrepancy between nuclear and mitochondrial data is
B
Fig. 2. Inferred demographic history of the Apennine brown bear. (A) Demographic dynamics reconstructed applying the PSMC approach to the APN2 genome (solid line) with bootstrap-based uncertainty regions (shade). (B) Demographic dynamic of the Apennine brown bear estimated using the ABC skyline approach based on∼20 Mb of noncoding regions from five individuals (median as a solid line; 95% confidence intervals are shaded). (C) Examples of patterns of the genomic distribution ofθWper site in 1,000 fragments of 50 kb in 20 simulated individuals subjected to different bottlenecks (sketched, not to scale, in gray within each figure; width of the boxes is proportional to population size; time moves downwards). Gray lines represent each simulated indi-vidual, withθWvalues in ascending order, whereas red lines represent the pattern in the observed APN2 genome in 50 Mb of the longest scaffold (scaffold 1). N0and Nacorrespond to the modern and the ancient population size, respectively, whereas Tbrepresents the time of the bottleneck (in years). The most supported scenario is reported in Upper, whereas three additional illustrative examples are reported in Lower (SI Appendix, section S3.3 and Fig. S10has details and more examples).
likely explained by male-biased dispersal (43–46), and the pattern of low genetic structure that we observed at the Y chromosome fur-ther supports this view (47) (SI Appendix, section S7). Until recent times, bear populations were geographically homogenized by males, but female philopatry resulted in some level of mtDNA structuring. Interestingly, habitat destruction and fragmentation have been suggested as a general factor that favors the increase of female philopatry (48, 49). Considering also the wide geographic
distribu-tion of mtDNA lineages in the past (50), it is possible that sex differences in the dispersal rate increased a few thousand years ago. Adaptation and Maladaptation. The pattern of genomic variation in coding regions is informative on the functional impact of the isolation history of the Apennine bear. We found evidence of two evolutionary processes with opposite outcomes: active mainte-nance of variation at specific families of genes and fixation by drift of several deleterious alleles.
Three lines of evidence support active maintenance of varia-tion: the comparison between nonsynonymous and synonymous polymorphisms, the comparison between variation erosion along the genome, and the enrichment of specific pathways in the genomic regions that preserved higher variation than expected.
First, the Apennine bear retained more variation at non-synonymous than at non-synonymous sites (SI Appendix, section S8.1). In particular, when the heterozygous sites observed in a single non-Apennine genome are used as reference,∼40% of nonsynonymous variants are still polymorphic in five Apennine bears in contrast with 30% of synonymous variants (SI Appendix, Tables S12 and S13). This difference reflects a higher probability of retaining nonsynonymous than synonymous polymorphisms, and it is not expected under neutrality (similar fractions are predicted), under positive selection during divergence (more nonsynonymous fixa-tions are predicted), or assuming reduced purifying selection caused by drift (very few heterozygous sites under negative selec-tion are expected in a single non-Apennine reference genome).
Second, in the genomic regions where variation is very high in non-Apennine bears, which may be because of functional or structural reasons, the loss of variation in the Apennine bears was less intense than in other regions (Fig. 4F). In fact, the fraction of 50-kb genomic windows where the Apennine bears reached a level of variation similar to the value observed in the non-Apennine bears was 10 times higher for windows with high compared with windows with average variation levels (SI
Ap-pendix, section S8.2).
Third, high-variation windows fall in regions enriched for coding loci, and the significantly overrepresented pathways within these windows include 6 genes related to the adaptive immune system, 39 genes related to the olfactory signaling pathways, and 2 genes related to the digestion of dietary car-bohydrate (Fig. 4A–D andSI Appendix, Table S14). These genes are present in several copies (51–53), and most of them have been suggested to be under balancing selection (54, 55). It seems, therefore, likely that evolutionary processes, such as heterozy-gote advantage, assisted by a genetic mechanism, such as non-allelic homologous recombination among multiple copies (56, 57), maintain high variation at relevant loci even under strong genetic drift, preserving their role in the interaction with the environment and pathogens. Direct sequencing of twoMHC loci in additional individuals confirmed that the level of variation observed in the Apennine population is as high as in other Eu-ropean regions (SI Appendix, section S8.3).
Our results thus support the view that, even in small pop-ulations, the random loss of variation does not affect all sites in the same way, and we further contribute to the general debate about the relative role of drift and selection when the effective population size is very small (9–11, 58).
We also find that Apennine and the non-Apennine bear ge-nomes show fixed differences at∼1,000 nuclear genic positions. Even considering the possible underestimation of rare variants because of low sample sizes and the∼5× coverage of most of our genomes, these are genomic positions showing extreme di-vergence in the Apennine population. Of these fixed differences, 411 produce nonsynonymous changes in 360 genes, 40 of which are predicted to be deleterious in the Apennine bear (none in the non-Apennine group), and 4 others result in a premature stop codon (Fig. 4A–D and SI Appendix, section S9.1). Several of the fixed
Ancestral population Ancient European spread High connectivity among ancient populations Recent fragmentation Low connectivity among modern populations Density 0 2e-05 4e-05 Density 0 1 .5e-05 3e-05 Density 0 2e-03 4e-03 Density 0 1e-03 2e-03 T3 10K 20K 0 Density 0 2 e-01 4e-01 N1m1 250 500 0 500K 1M 0 T5 Nanc 50K 100K 0 N2m2 250 500 0
Fig. 3. Inferred fragmentation scenario for the European brown bear. Posterior distributions in Right refer to the ABC metapopulation model (SI Appendix, section S5.2has details); connectivity refers to Nm as the product of the effective population size of a deme, N, and the migration rate, m, per generation. Nanc(in individuals) is the ancestral population size before any fragmentation. T5 (in years) is the time of brown bear spread in Europe. N1m1 is migration parameter among European brown bear populations before T3. T3 (in years) is the time of the decrease in connectivity among European brown bear populations. N2m2 is migration parameter among European brown bear populations after T3. Dashed lines represent prior distributions.
EVOLUTI
ON
PNAS
D
F
E
Fig. 4. Active maintenance and random loss of genetic diversity. Boxplot of the average genetic diversity [estimated with ANGSD (74)] within five Apennine brown bears (A), within five European (EUR) brown bears (B), and between these two groups (C) per gene categories and including 10 kb upstream and downstream of each gene. The categories are as follows. High indicates genes in high-diversity genomic windows (SI Appendix, section S8.2). Del indicates genes with nonsynonymous deleterious mutations fixed in the Apennine population (SI Appendix, section S9.1). TA indicates candidate genes associated with TA behavior (SI Appendix, section S9.3). All indicates all of the other genes. (D) Scatterplot of genetic diversity within and between groups in single genes of different categories; gray shades correspond to different numbers of All genes with specific combinations of within and between differentiation. The most divergent gene for each category is indicated (High: RNPC3, Del: CMA1, and TA: GLTSCR2) as well as most of the genes with high diversity in the APN population: immune response (HLA and IG-like), carbohydrates digestion (AMY1B/2B), aflatoxin detoxification (AKR7A1), control of DNA damage (HUS1), lipid transporter activity (APOL2/3), and olfactory receptors (marked with asterisks). Note that some of the genes at high diversity in the APN population (e.g., APOL2/3) are not included in the High category, as they were excluded because of marginally overlapping TopWi windows with unusual coverage (SI Appendix, section S8.2). (E) Proportion of fixed differences in genes related to TA behavior is significantly higher (yellow line) than expected at random (gray bars). (F) Genomic windows in the 99th percentile (dashed lines) considering the genetic diversity in the European brown bear are also characterized by high diversity in the Apennine population and are enriched for immune system and olfactory receptor genes (brown shaded boxes).θWin the two groups along scaffold 118 and scaffold 80 is shown as an illustration. Positions of five MHC and six olfactory receptor genes are shown.
mutations were found in genes directly related to or associated with human monogenic disorders: severe anemia, craniofacial and ocu-lar anomalies, small body size, proteinuria, cardiac and skeletal muscle-related diseases, lactate dehydrogenase B deficiency, and problems related to low levels of proteins in the blood. In the Apennine mtDNA genome, three nonsynonymous substitutions occur in theNADH dehydrogenase subunit 5 (ND5) with one of these never observed in a large database of brown and polar bears
(SI Appendix, section S9.2). Several ND5 changes have been shown
to reduce the activity of complex I, causing different health prob-lems, including muscle weakness. Finally, considering the popular belief and some observations regarding the rather docile tempera-ment of the Apennine bear (no attacks on humans have ever been recorded in the last century), we tested the pattern of divergence between Apennine and non-Apennine bears at 22 genes that were associated with tame/aggressive (TA) behavior (SI Appendix,
sec-tion S9.3). Interestingly, we found a significant enrichment for fixed
differences in these genes (Fig. 4E), suggesting that genetic drift or hunting of the more aggressive or bold individuals (59, 60) may have led to a genetically mediated shift in Apennine bear behavior. In summary, random fixation of deleterious mutations prob-ably increased the genetic load in the Apennine bear, with negative consequences, such as a reduced ability to produce energy. These genetic changes also produced phenotypic di-vergence at traits usually used to identify this population, such as the small size, unique cranial morphology, and a less aggressive behavior. Additional behavioral and functional assays will be necessary to prove these hypothetical gene–phenotype links. Conclusions and Conservation Perspectives. Why do a handful of Apennine bear stragglers survive given their extremely low genomic variation, high inbreeding, and large number of fixed deleterious mutations? Despite the difficulty in assessing the role of genetic factors in past extinctions of small populations, the causative link between low genetic and genomic variation, fitness reduction, and high extinction risk is supported by theoretical arguments and empirical evidence (24, 61–64). Still, the long-term persistence of species at extremely low levels of genomic variation has also been documented (11, 65). We believe that our study, even if based on a limited number of whole genomes, can help explain this apparent contradiction between expectation and observation. We identify an active process of maintenance of variation at crucial genes for pathogen defense and chemical perception. We hypothesize that the lack of competitors reduced the impact of many deleterious mutations (66) and that the highly diversified diet of the brown bear may have compensated for the energy production problems in the Apennine population by facilitating a switch from omnivory to an almost completely vegetarian diet (67, 68). In addition, we inferred a genetic component related to a behavioral change to-ward a less aggressive temperament, which potentially reduced the risk perceived by local human communities and thus limited per-secution and attempts to eradicate the Apennine bear. Do these results imply that the extinction risk of the Apennine bear caused by genetic factors is low and therefore that invasive management options, such as genetic rescue via translocation of unrelated in-dividuals (69), are unnecessary?
On the one hand, the benefits of such interventions to reduce inbreeding and favor demographic expansion, even when fitness decay is not reported and only a few individuals are introduced, are well-documented and supported (70). Also, considering that the Apennine bear has been isolated from other bear populations for only several thousand years, adverse outbreeding effects re-lated to hybridization among different populations should be mi-nor if they were to occur at all. Plausible candidates for the genetic rescue of the Apennine bear are the geographically and maternally (mtDNA) closer bear individuals from Slovenia or the Italian Alps. Alternatively, more adaptively similar individuals from Mediterra-nean areas could be introduced with even larger outbreeding
ben-efits, an outcome supported by a recent study of experimental translocations in fish (71). If implemented, however, we warmly suggest additional genomic and nongenomic analyses for a careful choice of rescuers.
On the other hand, the recognition of the Apennine bear as an Italian iconic endangered taxon, the possible risk of introducing aggressiveness genes and deteriorating the relatively peaceful hu-man–bear coexistence in central Italy, and the current levels of variation at relevant immune and olfactory genes suggest avoiding genetic rescue. We call instead for an increase in conservation ac-tions, such as reducing incidental killing and poaching, securing food resources (e.g., protecting local wild fruit plants), and favoring natural dispersal in unoccupied but suitable areas. If direct evidence of inbreeding depression will be reported in the future, the genetic rescue option should be reconsidered. This approach would allow the maintenance and the monitoring of this ongoing natural ex-periment of evolution and divergence at small population size that produced, rephrasing the work in ref. 72, a cherished group, pre-cisely because it represents a divergent evolutionary lineage. Methods
Sequencing, Mapping, SNPs, and Genotype Calling. Genomic DNA was extracted from blood and muscle tissue of 12 individuals: 6 from central Italy, 1 from northern Italy, 2 from Slovakia, 2 from Greece, and 1 from Spain. Samples were prepared for paired end (2× 100) Illumina sequencing following the protocol described in ref. 73. In total,∼2.14 billion reads were uniquely mapped (SI Appendix, section S1.3) to 357 autosomal scaffolds (∼2.16 Gb: 95.3% of the whole assembly) of the polar bear reference genome (22) with high confidence (Q≥ 25). We included in our analyses data from two European brown bears from Sweden, six polar bears, and one black bear from previously published studies (22, 27). Eight individuals were sequenced at low coverage with an average sequencing depth of 2.4–6.3×, whereas the four remaining individuals were sequenced at higher coverage (from 14.4 to 16.5×). One sample from central Italy (APN1) was excluded because of too low coverage. Single-nucleotide variants and indels were jointly discovered in the 13 high-coverage individuals (SI Appendix, section S1.4) using the UnifiedGenotyper algorithm implemented in GATK, and the software ANGSD (74) was used to compute several measures of genetic variation in low-coverage samples in-tegrating the genotype uncertainty (SI Appendix, section S1.5).
Long Regions of Homozygosity and Inbreeding Estimates. We calculated the Watterson estimator ofθ in 50-kb overlapping windows, with 10-kb steps, over the 357 autosomal scaffolds, excluding windows with more than 30% missing sites. To quantify the proportion of the genome characterized by long regions of homozygosity in each individual, we explored the hetero-zygosity profile along the scaffolds (SI Appendix, section S1.6) to identify long regions (≥1 Mb) composed of contiguous windows with less than 25 segregating sites (heterozygosity constantly lower than 0.0005). To quantify and compare the level of inbreeding across all individuals (SI Ap-pendix, section S2), we adopted the methodology presented in ref. 25.
Demographic Analyses. To study the past population size variation through time, we first applied the PSMC method (29) to the high-coverage samples (SI Appendix, section S3.1). We further studied the recent demographic dy-namic of the Apennine brown bear population by ABC skyline (35) using the genomic data from the five Apennine individuals (SI Appendix, section S3.2). To identify the strength of the population contraction that could have produced the accumulation of homozygosity regions in the Apennine brown bear, we then performed coalescent simulations modeling the expected patterns of homozygosity regions in the genome under different de-mographic conditions (SI Appendix, section S3.3).
Neighbor-Joining Tree on Nuclear and Mitochondrial Whole-Genome Distances. We used ANGSD to compute pairwise genomic distances between individuals (without calling genotypes) over 1,842,042,551 bp, and a neighbor-joining tree was also computed (SI Appendix, section S4). To reconstruct the mtDNA phylogeny, one Illumina MiSeq lane (2× 75-bp kit) was used to se-quence 11 additional samples (6 from the Apennine, 3 from Slovakia, and 2 from Greece), producing∼20 million paired end reads. After aligning to the reference mitochondrial genome and quality filtering, 16,409 bp were used to reconstruct a neighbor-joining tree based on Hasegawa, Kishino, and Yano (HKY) pairwise distances (SI Appendix, section S6).
EVOLUTI
ON
PNAS
structure using the Bayesian population model implemented in STRUCTURE 2.3.4 (75) and including only SNPs at least 50 kb away from any known gene, not in repeated regions, separated by at least 150 kb to minimize linkage disequilibrium (7,971 unlinked SNPs) (SI Appendix, section S5.1). To further explore the evolutionary history of the Apennine brown bear population and estimate the posterior density of relevant demographic parameters, we built a complex metapopulation model relating all European populations followed by an ABC approach simulating a nonequilibrium 100 demes finite island model (SI Appendix, section S5.2). A two-population isolation with migration model was also explored through an ABC approach to exclude recent or ongoing gene flow to or from the Apennine population (SI Ap-pendix, section S5.3). Using the same statistical approach used to date the interruption of gene flow between modern humans and Neanderthals (37), we estimated the time since complete isolation of the Apennine population from the central European population, counting the number of polymor-phisms in one European individual for which an allele sampled at random from one Apennine individual was the derived one (F). To translate from F to time since population divergence, a calibration curve was built using coalescent-based simulations under a demographic scenario derived from previous analyses (SI Appendix, section S5.4).
Genomic Retention of Nonsynonymous SNPs. In coding regions, we selected all heterozygous sites in a single non-Apennine reference individual genotyped at high coverage, and we categorized them in nonsynonymous (n-syn) and synonymous (syn) sites. We then estimated the fraction of sites that were also polymorphic (Pn-synand Psyn) in the five Apennine samples for syn and n-syn sites separately. Assuming that heterozygous sites in the reference genome are a proxy for the polymorphism in the Apennine ancestral population, Pn-synand Psynare estimates of the probability of retaining a polymorphism during the Apennine population divergence (SI Appendix, section S8.1). This is a McDonald and Kreitman-like test (76) on all genes during the Apennine population divergence. We predict that Pn-synand Psynshould be the same if drift is mainly driving the fixation of n-syn substitutions in the Apennine brown bear genomes. However, if balancing selection played an important role during the divergence of the Apennine brown bear, we predict that Pn-synshould be higher than Psyn. On the contrary, if directional selection is a major force, we expect that Pn-synshould be lower than Psyn.
Genomic Windows at High Variation. We analyzed the distribution ofθW along the genome using 50-kb overlapping windows (with 10-kb steps) in the alignment of five non-Apennine brown bears, identifying the windows with averageθ values (AveWi) and the windows with top θ values (TopWi), which are the 50-kb windows with aθWwithin 10% of the global mean and with a θWhigher than the 99th percentile, respectively. We then analyzedθWin the same windows with respect to the alignment of the five Apennine individuals, thus identifying regions overlapping with the TopWi in the non-Apennine dataset (i.e., where high variation is retained more than expected by
pathways for genes in such regions using the software REACTOME (77). Fixed Differences Between Apennine and Non-Apennine Brown Bear Individuals. The whole nuclear genome was screened for fixed differences (i.e., sites where all five Apennine genomes and all eight non-Apennine genomes are mono-morphic for a different allele) (SI Appendix, section S9.1). Fixed differences in the Apennine population in genes implying nonsynonymous substitutions were tested for deleterious effect using two different bioinformatic tools [Panther (78) and Polyphen (79)], and relationship with human diseases was identified using the Online Mendelian Inheritance in Man (OMIM) database. A similar analysis was performed on the mtDNA genome, comparing the unique Apennine population haplotype with 45 European sequences from public repositories and from our non-Apennine samples. In the case of the mtDNA, we looked for amino acids fixed in the Apennine sequence and present in the non-Apennine group at low frequency (SI Appendix, section S9.2).
Enrichment of Fixed Differences in Candidate Genes for Tame/Aggressive Behavior. Considering the behavioral differences suggested for the Apennine bear, we blindly tested if candidate genes previously associated with TA in other mammals showed a higher than expected signal of genetic divergence in comparison with other populations (SI Appendix, section S9.3). We analyzed 19 genes suggested as candidate determinants of a recent shift from an ag-gressive to a more docile temperament. For each gene, we counted the number of sites with fixed differences between the five Apennine bears ge-nomes and five non-Apennine bears in a genomic region including the gene and two 10-kb windows upstream and downstream the gene (FDTA). To sta-tistically verify if FDTA is larger than expected, we randomly sampled 10,000 sets of 19 genes and computed the FD value for each random set. ACKNOWLEDGMENTS. We thank coworkers at the State Nature Conser-vancy of Slovakia for tissue samples from legally culled brown bears. We also thank Anna Mazzarella for revising the manuscript. We thank the re-gional governments of Asturias and Castilla y León in Spain for providing tissue samples of Cantabrian bears. We thank the genotoul bioinformatics platform Toulouse Midi-Pyrenees (Bioinfo Genotoul) for providing comput-ing resources. We also thank the Abruzzo Lazio and Molise National Park for permissions and assistance with logistics and the Istituto di Ecologia Appli-cata for financial support of genomic analyses. Apennine bear samples were obtained during a live-trapping and telemetry project funded by a US pri-vate citizen through the Wildlife Conservation Society. The samples were exported from Greece with Convention on International Trade in Endan-gered Species (CITES) Permit 86731. Financial support for the collection of the samples was provided by Vodafone Greece and the Vodafone Group Foundation. Fondo Ateneo Ricerca (FAR) grants from the University of Fer-rara supported the study. P.M.D. was funded by Agence Nationale de la Recherche Demochips Grant ANR-12-BSV7-0012.
1. Charlesworth D, Willis JH (2009) The genetics of inbreeding depression. Nat Rev Genet 10:783–796.
2. Lande R (1994) Risk of population extinction from fixation of new deleterious mu-tations. Evolution 48:1460–1469.
3. Wright S (1931) Evolution in mendelian populations. Genetics 16:97–159. 4. Bürger R, Lynch M (1995) Evolution and extinction in a changing environment: A
quantitative-genetic analysis. Evolution 49:151–163.
5. Gilpin ME, Soulé ME (1986) Minimum viable populations: Processes of species ex-tinction. Conservation Biology: The Science of Scarcity and Diversity, ed Soulé ME (Sinauer, Sunderland, MA), pp 19–34.
6. Fagan WF, Holmes EE (2006) Quantifying the extinction vortex. Ecol Lett 9:51–60. 7. Blomqvist D, Pauliny A, Larsson M, Flodin LA (2010) Trapped in the extinction vortex?
Strong genetic effects in a declining vertebrate population. BMC Evol Biol 10:33. 8. Norén K, Godoy E, Dalén L, Meijer T, Angerbjörn A (2016) Inbreeding depression in a
critically endangered carnivore. Mol Ecol 25:3309–3318.
9. Aguilar A, et al. (2004) High MHC diversity maintained by balancing selection in an otherwise genetically monomorphic mammal. Proc Natl Acad Sci USA 101:3490–3494. 10. Wood JLA, Yates MC, Fraser DJ (2016) Are heritability and selection related to population
size in nature? Meta-analysis and conservation implications. Evol Appl 9:640–657. 11. Robinson JA, et al. (2016) Genomic flatlining in the endangered island fox. Curr Biol
26:1183–1189.
12. Butlin R, et al.; Marie Curie SPECIATION Network (2012) What do we need to know about speciation? Trends Ecol Evol 27:27–39.
13. Wang L, Wan ZY, Lim HS, Yue GH (2016) Genetic variability, local selection and de-mographic history: Genomic evidence of evolving towards allopatric speciation in Asian seabass. Mol Ecol 25:3605–3621.
14. Ciucci P, Boitani L (2008) The Apennine brown bear: A critical review of its status and conservation problems. Ursus 19:130–145.
15. Ciucci P, et al. (2015) Estimating abundance of the remnant Apennine brown bear population using multiple noninvasive genetic data sources. J Mammal 96:206–220. 16. Colangelo P, et al. (2012) Cranial distinctiveness in the Apennine brown bear: Genetic
drift effect or ecophenotypic adaptation? Biol J Linn Soc Lond 107:15–26. 17. Randi E, Gentile L, Boscagli G, Huber D, Roth HU (1994) Mitochondrial DNA sequence
divergence among some west European brown bear (Ursus arctos L.) populations. Lessons for conservation. Heredity (Edinb) 73:480–489.
18. Taberlet P, Bouvet J (1994) Mitochondrial DNA polymorphism, phylogeography, and conservation genetics of the brown bear Ursus arctos in Europe. Proc Biol Sci 255: 195–200.
19. Swenson JE, Taberlet P, Bellemain E (2011) Genetics and conservation of European brown bears Ursus arctos. Mammal Rev 41:87–98.
20. Febbo D, Pellegrini M (1990) The historical presence of the brown bear in the Apennines. Aquilo (Zool) 27:85–88.
21. Preatoni D, et al. (2005) Conservation of brown bear in the Alps: Space use and set-tlement behavior of reintroduced bears. Acta Oecol 28:189–197.
22. Liu S, et al. (2014) Population genomics reveal recent speciation and rapid evolu-tionary adaptation in polar bears. Cell 157:785–794.
23. Schubert M, et al. (2014) Prehistoric genomes reveal the genetic foundation and cost of horse domestication. Proc Natl Acad Sci USA 111:E5661–E5669.
24. Xue Y, et al. (2015) Mountain gorilla genomes reveal the impact of long-term pop-ulation decline and inbreeding. Science 348:242–245.
25. Prüfer K, et al. (2014) The complete genome sequence of a Neanderthal from the Altai mountains. Nature 505:43–49.
26. Der Sarkissian C, et al. (2015) Evolutionary genomics and conservation of the en-dangered Przewalski’s horse. Curr Biol 25:2577–2583.
27. Miller W, et al. (2012) Polar and brown bear genomes reveal ancient admixture and demographic footprints of past climate change. Proc Natl Acad Sci USA 109:E2382–E2390.
28. Brauer A, et al. (2007) Evidence for last interglacial chronology and environmental change from Southern Europe. Proc Natl Acad Sci USA 104:450–455.
29. Li H, Durbin R (2011) Inference of human population history from individual whole-genome sequences. Nature 475:493–496.
30. Bunnefeld L, Frantz LAF, Lohse K (2015) Inferring bottlenecks from genome-wide samples of short sequence blocks. Genetics 201:1157–1169.
31. Schiffels S, Durbin R (2014) Inferring human population size and separation history from multiple genome sequences. Nat Genet 46:919–925.
32. Liu X, Fu Y-X (2015) Exploring population size changes using SNP frequency spectra. Nat Genet 47:555–559.
33. Terhorst J, Kamm JA, Song YS (2017) Robust and scalable inference of population history from hundreds of unphased whole genomes. Nat Genet 49:303–309. 34. Nadachowska-Brzyska K, Burri R, Smeds L, Ellegren H (2016) PSMC analysis of
effec-tive population sizes in molecular ecology and its application to black-and-white Fi-cedula flycatchers. Mol Ecol 25:1058–1072.
35. Maisano Delser P, et al. (2016) Population genomics of C. melanopterus using target gene capture data: Demographic inferences and conservation perspectives. Sci Rep 6: 33753.
36. Davison J, et al. (2011) Late-Quaternary biogeographic scenarios for the brown bear (Ursus arctos), a wild mammal model species. Quat Sci Rev 30:418–430.
37. Green RE, et al. (2010) A draft sequence of the Neandertal genome. Science 328: 710–722.
38. Kaplan JO, et al. (2011) Holocene carbon emissions as a result of anthropogenic land cover change. Holocene 21:775–791.
39. Marlon JR, et al. (2013) Global biomass burning: A synthesis and review of Holocene paleofire records and their controls. Quat Sci Rev 65:5–25.
40. Zennaro P, et al. (2015) Europe on fire three thousand years ago: Arson or climate? Geophys Res Lett 42:5023–5033.
41. Fyfe RM, Woodbridge J, Roberts N (2015) From forest to farmland: Pollen-inferred land cover change across Europe using the pseudobiomization approach. Glob Change Biol 21:1197–1212.
42. Curry-Lindahl K (1972) The brown bear (Ursus arctos) in Europe: Decline, present distribution, biology and ecology. Bears Their Biol Manage 2:74–80.
43. Greenwood PJ (1980) Mating systems, philopatry and dispersal in birds and mammals. Anim Behav 28:1140–1162.
44. Støen O-G, Zedrosser A, Saebø S, Swenson JE (2006) Inversely density-dependent natal dispersal in brown bears Ursus arctos. Oecologia 148:356–364.
45. Costello CM, Creel SR, Kalinowski ST, Vu NV, Quigley HB (2008) Sex-biased natal dispersal and inbreeding avoidance in American black bears as revealed by spatial genetic analyses. Mol Ecol 17:4713–4723.
46. Jerina K, Adamiˇc M (2008) Fifty years of brown bear population expansion: Effects of sex-biased dispersal on rate of expansion and population structure. J Mammal 89: 1491–1501.
47. Bidon T, et al. (2014) Brown and polar bear Y chromosomes reveal extensive male-biased gene flow within brother lineages. Mol Biol Evol 31:1353–1363.
48. Henry RC, Coulon A, Travis JMJ (2016) The evolution of male-biased dispersal under the joint selective forces of inbreeding load and demographic and environmental stochasticity. Am Nat 188:423–433.
49. Stow AJ, Sunnucks P, Briscoe DA, Gardner MG (2001) The impact of habitat frag-mentation on dispersal of Cunningham’s skink (Egernia cunninghami): Evidence from allelic and genotypic analyses of microsatellites. Mol Ecol 10:867–878.
50. Valdiosera CE, et al. (2008) Surprising migration and population size dynamics in ancient Iberian brown bears (Ursus arctos). Proc Natl Acad Sci USA 105:5123–5128. 51. Perry GH, et al. (2007) Diet and the evolution of human amylase gene copy number
variation. Nat Genet 39:1256–1260.
52. Young JM, et al. (2008) Extensive copy-number variation of the human olfactory receptor gene family. Am J Hum Genet 83:228–242.
53. Flajnik MF, Kasahara M (2010) Origin and evolution of the adaptive immune system: Genetic events and selective pressures. Nat Rev Genet 11:47–59.
54. Bernatchez L, Landry C (2003) MHC studies in nonmodel vertebrates: What have we learned about natural selection in 15 years? J Evol Biol 16:363–377.
55. Alonso S, López S, Izagirre N, de la Rúa C (2008) Overdominance in the human ge-nome and olfactory receptor activity. Mol Biol Evol 25:997–1001.
56. Ohta T (1982) Allelic and nonallelic homology of a supergene family. Proc Natl Acad Sci USA 79:3251–3254.
57. Ottaviani D, LeCain M, Sheer D (2014) The role of microhomology in genomic struc-tural variation. Trends Genet 30:85–94.
58. Radwan J, Biedrzycka A, Babik W (2010) Does reduced MHC diversity decrease via-bility of vertebrate populations? Biol Conserv 143:537–544.
59. Ciuti S, et al. (2012) Human selection of elk behavioural traits in a landscape of fear. Proc Biol Sci 279:4407–4416.
60. Steyaert SMJG, et al. (2016) Ecological implications from spatial patterns in human-caused brown bear mortality. Wildl Biol 22:144–152.
61. Frankham R (2005) Genetics and extinction. Biol Conserv 126:131–140.
62. Palomares F, et al. (2012) Possible extinction vortex for a population of Iberian lynx on the verge of extirpation. Conserv Biol 26:689–697.
63. Abascal F, et al. (2016) Extreme genomic erosion after recurrent demographic bot-tlenecks in the highly endangered Iberian lynx. Genome Biol 17:251.
64. Rogers RL, Slatkin M (2017) Excess of genomic defects in a woolly mammoth on Wrangel island. PLoS Genet 13:e1006601.
65. Milot E, Weimerskirch H, Duchesne P, Bernatchez L (2007) Surviving with low genetic diversity: The case of albatrosses. Proc Biol Sci 274:779–787.
66. Agrawal AF, Whitlock MC (2012) Mutation load: The fitness of individuals in pop-ulations where deleterious alleles are abundant. Annu Rev Ecol Evol Syst 43:115–135. 67. Ciucci P, Tosoni E, Di Domenico G, Quattrociocchi F, Boitani L (2014) Seasonal and annual variation in the food habits of Apennine brown bears, central Italy. J Mammal 95:572–586.
68. Bojarska K, Selva N (2011) Spatial patterns in brown bear Ursus arctos diet: The role of geographical and environmental factors. Mammal Rev 42:120–143.
69. Whiteley AR, Fitzpatrick SW, Funk WC, Tallmon DA (2015) Genetic rescue to the rescue. Trends Ecol Evol 30:42–49.
70. Frankham R (2015) Genetic rescue of small inbred populations: Meta-analysis reveals large and consistent benefits of gene flow. Mol Ecol 24:2610–2618.
71. Kronenberger JA, et al. (2017) Testing the demographic effects of divergent immi-grants on small populations of Trinidadian guppies. Anim Conserv 20:3–11. 72. Tallmon DA (2017) Get a move on: The value of rescue. Anim Conserv 20:16–17. 73. Meyer M, Kircher M (2010) Illumina sequencing library preparation for highly
mul-tiplexed target capture and sequencing. Cold Spring Harb Protoc 2010:pdb.prot5448. 74. Korneliussen TS, Albrechtsen A, Nielsen R (2014) ANGSD: Analysis of next generation
sequencing data. BMC Bioinformatics 15:356.
75. Falush D, Stephens M, Pritchard JK (2003) Inference of population structure using multilocus genotype data: Linked loci and correlated allele frequencies. Genetics 164: 1567–1587.
76. McDonald JH, Kreitman M (1991) Adaptive protein evolution at the Adh locus in Drosophila. Nature 351:652–654.
77. Fabregat A, et al. (2016) The Reactome pathway knowledgebase. Nucleic Acids Res 44:D481–D487.
78. Thomas PD, et al. (2003) PANTHER: A library of protein families and subfamilies in-dexed by function. Genome Res 13:2129–2141.
79. Adzhubei IA, et al. (2010) A method and server for predicting damaging missense mutations. Nat Methods 7:248–249.
EVOLUTI
ON
PNAS

![Fig. 4. Active maintenance and random loss of genetic diversity. Boxplot of the average genetic diversity [estimated with ANGSD (74)] within five Apennine brown bears (A), within five European (EUR) brown bears (B), and between these two groups (C) per gen](https://thumb-eu.123doks.com/thumbv2/123dokorg/4762152.47507/6.877.102.780.115.901/maintenance-diversity-boxplot-genetic-diversity-estimated-apennine-european.webp)
