1
Costs associated with the management of waste from healthcare facilities: an
analysis at national and site level
Mentore Vaccaria, Terry Tudorb, Andrea Perteghellaa
a Department of Civil, Environmental, Architectural Engineering and Mathematics, University of
Brescia, Brescia, Italy, via Branze 43, 25123 Brescia, Italy
b The School of Science and Technology. University of Northampton. Northampton. NN2 7JD. UK
Corresponding author:
Mentore Vaccari, University of Brescia, via Branze 43, 25123 Brescia, Italy e-mail: [email protected]
Abstract
Given rising spend on the provision of healthcare services, the sustainable management of waste from healthcare facilities is increasingly becoming a focus, as a means of reducing public health risks and financial costs. Using data on per capita healthcare spend at the national level, as well as a case study of a hospital in Italy, this study examined the relationship between trends in waste generation and the associated costs of managing the waste. At the national level, healthcare spend as a percentage of gross domestic product positively correlated with waste arisings. At the site level, waste generation and type were linked to department type and clinical performance, with top three highest generating departments of hazardous healthcare waste being anesthetics (5.96 kg/day/bed), pediatric and intensive care (3.37 kg/day/bed) and gastroenterology-digestive endoscopy (3.09 kg/day/bed). Annual overall waste management costs were $US5,079,191, or approximately $US2.36/kg, with the management of the hazardous fraction of the waste being highest at $US3,707,939. In Italy, reduction in both waste arisings and the associated costs could be realized through various means including improved waste segregation, and linking the TARI tax to waste generation.
Keywords: Gross domestic product, Healthcare waste costs, Italy, Medical waste generation, Waste segregation
2 1. Introduction
The global financial costs associated with the provision of healthcare services are significant and growing. For example, as illustrated in Figure 1, the % spend of gross domestic product (GDP) on healthcare in one of the largest countries (the United States of America (USA)), accounted for around 17.4% of its’ entire GDP in 2014. This figure was up from around 15.3% in 2006 (World Bank, 2016). While the rates globally and across the Organisation for Economic Cooperation and Development (OECD) countries are lower, and have slowed since the 2008 financial crisis, they are nevertheless generally rising. In Italy, however, where this study was undertaken, it has decreased marginally since 2009, falling from 9.4% in 2009, to 9.2% in 2014.
Figure 1: Comparison of percentages spend of GDP on healthcare in selected countries and globally (World Bank, 2016)
In providing these services, healthcare facilities produce waste. The majority of the waste generated is non-hazardous and is similar to that from households, with only a small percentage being potentially hazardous (WHO, 2011). However, the potential presence of hazards such as infections, sharps, and chemicals can pose significant risks and lead to higher costs (WHO, 2014). For example, there has been an increasing shift in many developed countries towards the use of disposable and single use medical items as a means of addressing concerns about the risks of infections (World Bank,
0 2 4 6 8 10 12 14 16 18 2006 2007 2008 2009 2010 2011 2012 2013 2014 % spe nd of G D P on hea lt hca re Year USA World Italy OECD
3
2016; Nichols et al., 2016). At the same time, there is evidence that this shift can lead to increased financial costs (Swensen et al., 2011; Campion et al., 2015; Viani et al., 2016).
Given the potential risks to public health and the environment, there has been an increasing focus on identifying suitable approaches (e.g. effective segregation of hazardous and non-hazardous waste), as a means not only of reducing these risks, but also the costs associated with managing the waste, (Ibbotson et al., 2013; Mosquera et al., 2014; Windfeld and Brooks, 2015; Castellani et al., 2015; Ghisellini et al., 2015). For example, in the United Kingdom (UK), a 20% reduction in hazardous healthcare waste was estimated to produce savings of approximately $US11.8 million (RCN, 2011). This study therefore sought to understand the nature of the relationship between generation patterns of healthcare waste and the associate costs. Using data at the country level, it specifically set out to examine whether there was a relationship between the income levels of countries and their healthcare expenditure, and healthcare waste generation rates. Secondly, using a case study approach, of a hospital from Italy, it also sought to understand the nature of the healthcare waste generation patterns and the associated waste management costs.
1.1 Factors affecting the generation of healthcare waste
The determination of factors such as the sources, composition and generation patterns of the healthcare waste (HCW) is crucial to understanding how best to manage the associated costs and risks (Askarian et al., 2010; Voudrias et al., 2012).
Liberti et al. (1996) found that the majority of hazardous HCW arose from short-term patients in rehabilitation service (52%), with analytical laboratories (23%), and surgeries (14%), being the next highest. While Cheng et al. (2009) noted that dialysis (23%), the intensive care unit (17%) and emergency care unit and outpatients (12% each), were the highest producers of HCW.
Healthcare waste generation patterns have been shown to be dependent on various factors, including department type and levels of patient activity (Ozbek and Sanin, 2004; Da Silva et al., 2005; Tudor, 2007; Moreira and Günther, 2013), GDP and healthcare spend per capita (Windfield and Brooks, 2015), and diagnosis-related group (that is a measure of classification based on the principal and secondary diagnoses, patient characteristics and the procedures performed) (Mathausera and Wittenbecherb, 2013; Xin, 2015) .
Measurement of waste generation rates from healthcare facilities is generally based on kg/bed/day (Bazrafshan and Kord Mostafapoor, 2011; Bdour et al., 2007; Cheng et al., 2009; Caniato et al., 2015; Farzadkia et al., 2009). However, other units include kg/day (Moreira and Günther, 2013), kg/clinical
4
performance (Moreira and Günther, 2013) and kg/month/person (Tudor, 2007). Table 1 demonstrates the variation in hazardous HCW generation rates across selected countries.
Table 1: Comparison of hazardous healthcare waste generation rates in selected countries Country Hazardous healthcare waste (kg/bed/day) Reference
South Africa 1.24 UNEP (2012)
United States 2.79 UNEP (2012)
France 4.8 EC (2016)
Italy 2.4 EC (2016)
Taiwan 0.6 Cheng et al. (2009)
Korea (Rep) 0.14 – 0.49 Jang et al. (2006)
Jordan 0.61 Abdulla et al. (2008)
Turkey 0.63 Birpinar et al. (2009)
Bulgaria 0.4 Spasov (2003)
Iran 0.4 – 1.9 Taghipour and Mosaferi (2009)
Vietnam 0.3 UNEP (2012)
Bangladesh 0.25 Patwary et al. (2009a;b)
Germany 0.06 EC (2016)
Tanzania 0.08 UNEP (2012)
Data on the costs associated with managing HCW are limited, primarily due to commercial sensitivity. However, Windfield and Brooks (2015) report a rate of around $US741/tonne in the USA, and Komilis et al. (2011) state costs of $US1,800/tonne for incineration and $US1,165/tonne for sterilisation, in Greece. Alagöz and Kocasoy (2008) note that the collection and transport of the waste can constitute around 80 – 95% of expenditure.
In Europe, the classification of HCW is based on the European Waste Catalogue (EWC) (EC, 2008). According to the EWC, codes specific for HCW start with the number 18. There are several different sub-categories, which can be hazardous (marked with an asterisk) or non-hazardous (EC, 2008). Table 2 provides examples of common healthcare waste and their EWC classifications.
Table 2: Classifications of some common healthcare waste (adapted from EC, 2008)
Waste type Waste status Human healthcare
Healthcare waste not contaminated with bodily fluids (e.g. masks, gowns and gloves), and sterilised laboratory waste
Non-hazardous 180104
Plaster and similar wastes (e.g. from fracture clinics) Non-hazardous 180104
Cytotoxic and cytostatic medicines Hazardous 180108*
Other medicines Non-hazardous 180109
5
Hazardous chemicals Hazardous 180106*
Other chemicals Non-hazardous 180107
According to the Italian legislative decree DLgs. 152/2006, as amended by the DLgs. 205/2010, the first objective of effective HCW management is the protection of the health of patients, operators and all people involved (Italian Government, 2010). The legislation explicitly includes the safeguarding of the environment and the reduction of wastefulness as essential recommendations that operators should follow. Indeed, there is a focus on ensuring that the most efficient and cost effective waste treatment should be chosen, favouring reduction, recovery and recycling of materials (APAT, 2008; Testa et al., 2012; ISPRA, 2014).
2. Methods
2.1 GDP and healthcare spend per capita rates
In order to determine the healthcare expenditure per capita, the gross domestic product (GDP) per capita and the percentage spend on healthcare were first sourced from World Bank (2016) for 2014 (as this was the year of the study). The choice of the countries was based on the availability of data. The World Bank was used as it is a credible and publically available source of comparable global data. Based on Windfield and Brooks (2015), the healthcare spend per capita GDP was calculated by taking the percentage GDP spent on healthcare and multiplying this value by the per capita GDP. The value for the healthcare expenditure per capita was then used as a proxy for ‘wealth’, to determine whether there was a link between the wealth of the country and generation rates of HCW. For Korea (Rep) and Iran, the average of the range reported in Table 1 was used for the waste generation rates. The Spearman rank correlation test was used to measure the statistical relation between healthcare spend per GDP and hazardous healthcare waste arisings.
2.2 Waste generation rates
A hospital in Italy was used as the case study site. The hospital is a public healthcare facility located in the Lombardy region. It is the largest hospital in the region, and at the time of the study had 933 beds. The study was undertaken during 2014.
Based in part on Tudor (2007), the quantity of non-hazardous HCW produced by the hospital was determined by analyzing the records of the local company in charge of waste collection and disposal.
6
The data for a two year period (2013 – 2014) were collected from the records. These data were used to calculate the monthly average waste production [kg/month], the monthly average waste production for each fraction [kg/month] and average waste separation ratio [%].
Similarly to the non-hazardous HCW, the total quantity of hazardous HCW produced by the hospital was collected by analyzing the records of the company which collected the waste. These data were then crosschecked with the quantity of waste produced by each hospital department. This provided the monthly total number of hospitalization days (major clinical procedures), the day hospital (DH) activities (minor clinical procedure), and the monthly number of occupied beds. The Management Control Office at the hospital provided the monthly number of clinical performances carried out by the hospital. The analysis involved a determination of the:
- hospital department’s specific HCW production for 2013 and 2014 [kg/year]
- monthly HCW generation per hospitalization for 2013 and 2014 [kg/day] per hospital ward - monthly HCW production per clinical procedure for 2013 and 2014 [kg/procedure] per
hospital ward
- daily HCW production per occupied bed during 2013-2014 [kg/day/bed] per hospital ward.
Generation rates for 180103* (hazardous HCW), were correlated with the number of: (1) days patients stayed in the hospital, which included the ordinary hospitalization days and DH activities; (2) clinical procedures (i.e. specialist visits, laboratory analyses and rehabilitation therapies); and (3) occupied beds for each considered hospital ward. Occupied bed refers to patients who underwent a simple surgical intervention which required spending at least one day in bed, excluding DH procedures. Therefore, for the calculation only the hazardous HCW produced during the stay was considered because of a major clinical procedure.
2.3 Waste management costs
The costs were calculated for 2014 only, due to the hospital moving from the old building to the new one, which did not allow data collection for 2013. All the economic data were collected by reviewing the hospital’s official payment documents and receipts. In addition, informal interviews were held with technical staff and directors to fill any gaps in the data. The analyses were focused on the:
- HCW disposal costs;
- non-hazardous HCW fee (the hospital paid a yearly fee which was dependent on the area occupied by the department, rather than the quantity of waste produced);
7
- internal depot management and internal waste transportation costs;
- operations and maintenance cost of the waste transportation remote control system.
The sum of all these costs enabled the calculation of the overall waste management costs. This overall cost was shared between the two waste streams based on the functioning of the internal waste management system. The hospital used a remote control transportation system and the internal waste depot for all its waste. It had a centralized and remote controlled transportation system for all waste produced, which were temporary stored at the internal waste depot, before their transport to the final disposal treatment/site. The type of waste management system employed at the site did not allow for systematic division of all the costs according to the different types of treated waste. In particular, the common cost for the non-hazardous and hazardous HCW referred to the internal waste depot management, internal goods transportation and the remote control system for waste and good transportation running, and management costs. The internal depot management and internal waste transportation costs were shared as 30% for the non-hazardous HCW and 70% for the hazardous HCW, as the Halipack® bins had a higher cost when compared with the plastic bags used for the non-hazardous HCW. Moreover, each Halipack® was weighed when it arrived at the internal waste depot. In order to determine the overall costs’ split, the running and management costs for the waste remote transportation system was shared between the hazardous and non-hazardous HCW as 60.3% and 39.7%, respectively. The percentages were calculated based on the average number of trips carried out by the remote control system during a typical working day, which were 494 trips every day, 196 (39.7%) trips for the non-hazardous HCW and 298 (60.3%) trips for the hazardous HCW.
3. Results
3.1 Healthcare expenditure per GDP and waste arising
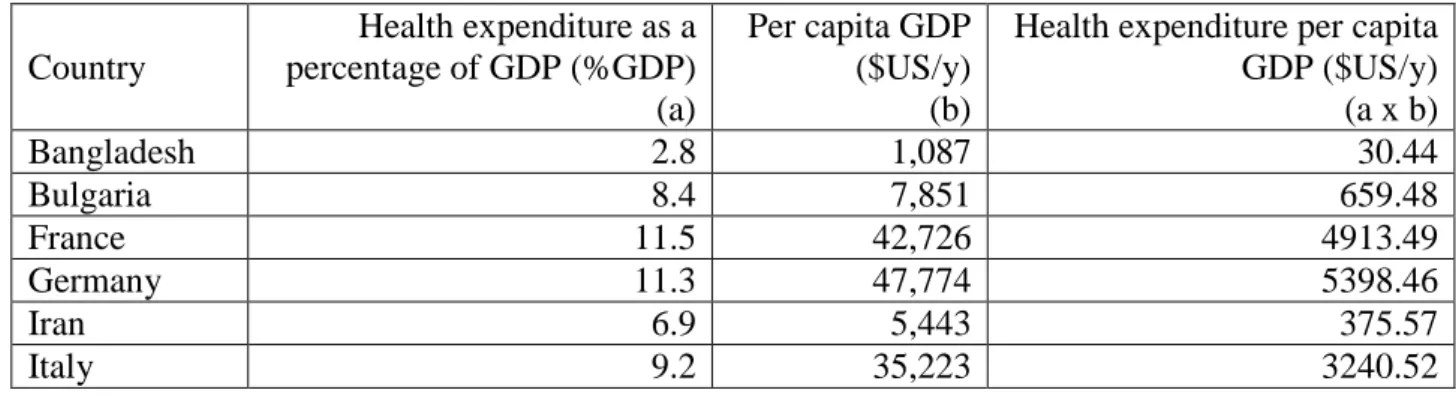
Table 3 suggests that generally the more developed countries (USA, Germany, France, Italy) had a higher per capita health expenditure.
Table 3: Healthcare expenditure per capita GDP (World Bank, 2016)
Country Health expenditure as a percentage of GDP (%GDP) (a) Per capita GDP ($US/y) (b)
Health expenditure per capita GDP ($US/y) (a x b) Bangladesh 2.8 1,087 30.44 Bulgaria 8.4 7,851 659.48 France 11.5 42,726 4913.49 Germany 11.3 47,774 5398.46 Iran 6.9 5,443 375.57 Italy 9.2 35,223 3240.52
8 Jordan 7.5 5,443 408.23 Korea (Rep) 7.2 27,971 2013.91 South Africa 8.8 6,484 570.59 Tanzania 5.6 955 53.48 Turkey 5.4 10,515 567.81 United States 17.1 54,630 9341.73 Vietnam 7.1 2,052 145.69
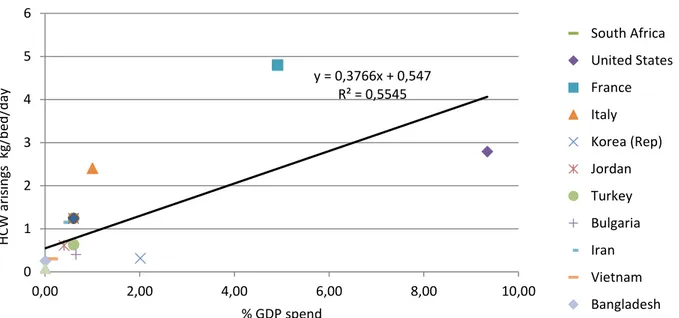
Figure 2 illustrates a positive correlation between healthcare spend per GDP and hazardous HCW arisings (0.746, p<0.05). This trend is particularly true for the USA. Most countries fell within the range. In Germany, waste generation rates fell well below the trend, while France and to a lesser extent Italy produced more waste than expected.
Figure 2: Correlation between healthcare spend as a percentage of GDP (World Bank, 2016) and hazardous healthcare waste arisings
3.2 Waste generation rates
The monthly average non-hazardous HCW production for the period 2013 - 2014 was primarily comprised of unsorted municipal waste (71.4 tonnes/month), organic waste (14.4 tonnes/month) and paper/cardboard (12.76 tonnes/month). The average waste segregation ratio for non-hazardous HCW was 34.3%.
The main type of hazardous HCW produced was infectious (180103*), with a total waste production of 1,279 tonnes and an average monthly rate of 53.3 tonnes. Figure 3 illustrates that the main sources
y = 0,3766x + 0,547 R² = 0,5545 0 1 2 3 4 5 6 0,00 2,00 4,00 6,00 8,00 10,00 H CW a ris in gs k g/b ed /d ay % GDP spend South Africa United States France Italy Korea (Rep) Jordan Turkey Bulgaria Iran Vietnam Bangladesh
9
of 180103* waste for 2013-2014 were the operating theatre, followed by the medicine department (which included the nephrology, hematology and gastroenterology wards), anesthetic and intensive care, and pediatrics.
Figure 3: Production of 180103* waste for each hospital department during 2013 - 2014
As shown in Figure 4 the average monthly HCW production and number of hospitalization days for the period were 25.36 tonne and 25,032 days, respectively. Thus the average per capita waste production rate was 1.01 kg/day.
Cardiovascular; 2.9% Surgical; 4.1% Neuroscience; 3.4% Anesthetic and intensive care; 13.2% Emergency; 4.5% Medicine; 15.1% Oncology and hematology; 9.2% Mental health; 0.1% Radiology; 1.7% Pediatric department; 10.9% Laboratory medicine; 9.6% Operating theatre; 24.2% Outpatients; 1.2%
10
Figure 4: Generation of 180103* waste and the number of hospital days
The departments with the highest average monthly average waste generation per hospitalization day were anesthetic and intensive care 3 (6.57 kg/day), anesthetic and intensive care 2 (4.57 kg/day), and pediatric and intensive care (3.45 kg/day).
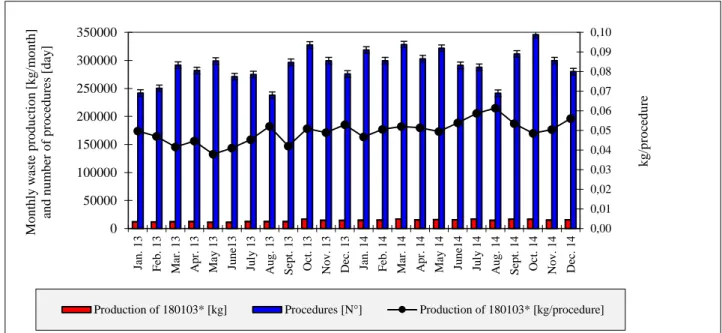
Figure 5 illustrates that the monthly average HCW production and number of clinical procedures for the period 2013 – 2014 were 14.35 tonnes and 290,676 procedures respectively. Thus the average monthly healthcare waste production per procedure was 0.046 kg/clinical procedure. The monthly number of procedures fluctuated, nevertheless the number of procedures fell during August for both years due to the Italian summer holiday period.
0 1 2 3 4 5 6 7 8 0 5000 10000 15000 20000 25000 30000 Jan . 1 3 Feb . 1 3 Ma r. 1 3 Ap r. 1 3 May 1 3 Ju n e1 3 Ju ly 1 3 Au g . 1 3 Sep t. 1 3 Oct. 1 3 No v . 1 3 Dec . 1 3 Jan . 1 4 Feb . 1 4 Ma r. 1 4 Ap r. 1 4 Ma y 1 4 Ju n e1 4 Ju ly 1 4 Au g . 1 4 Sep t. 1 4 Oct. 1 4 No v . 1 4 Dec . 1 4 [k g /s ta y ing da y ] M o nthly w a st e pro du ct io n [k g /m o nth] a nd n ° o f da y [ da y ] Month
11
Figure 5: Link between the 180103* waste produced and the number of clinical procedures The departments with the highest average monthly waste generation rates per clinical procedure were radiology (0.67 kg/procedure), gastroenterology – digestive endoscopy (0.50 kg/procedure), and plastic surgery (0.44 kg/procedure).
The hospital had an average occupation ratio of 82.4%, therefore the average daily HCW generation per activated bed and per occupied bed rates were 0.9 kg and 1.09 kg, respectively. The highest generating departments of hazardous HCW per daily occupied bed were anesthetics 3 (5.96 kg/day/bed), anesthetics 2 (4.3 kg/day/bed), pediatric and intensive care (3.37 kg/day/bed), and gastroenterology 2 – digestive endoscopy (3.09 kg/day/bed).
3.3 Waste management costs
The overall annual costs of disposing of the wastes (i.e. waste collection and transportation from the internal waste depot to the final treatment plant - e.g. incineration plants for 180103* and wastewater treatment plants for liquid hazardous waste - operated by a private enterprise), was $US2,274,980 (i.e. €1,710,897 since the average rate of exchange in 2014 was 1.3297 €/$US; Board of Governors of the Federal Reserve System, 2017). Of these costs, that for 180103* was highest at $US1,604,085, while $US661,770 were spent to dispose 263.5 tonne of 180106* (i.e. chemicals consisting of or containing hazardous substances).
The site paid a yearly national fee (called TARI) for the non-hazardous HCW of $US704,051, which was based on the physical space occupied and not the quantity of waste produced. The overall costs of the internal depot management, Halipack® and bags furniture, as well as the internal waste
0,00 0,01 0,02 0,03 0,04 0,05 0,06 0,07 0,08 0,09 0,10 0 50000 100000 150000 200000 250000 300000 350000 Jan . 1 3 F eb . 1 3 M ar . 1 3 A p r. 1 3 M ay 1 3 Ju n e1 3 Ju ly 1 3 A u g . 1 3 S ep t. 1 3 O ct . 1 3 N o v . 1 3 D ec . 1 3 Jan . 1 4 F eb . 1 4 M ar . 1 4 A p r. 1 4 M ay 1 4 Ju n e1 4 Ju ly 1 4 A u g . 1 4 S ep t. 1 4 O ct . 1 4 N o v . 1 4 D ec . 1 4 k g /p ro ce d u re M o n th ly w aste p ro d u cti o n [ k g /m o n th ] an d n u m b er o f p ro ce d u re s [d ay ]
12
transportation were $US1,087,397/year and $US629,039/year, respectively. While the operating and maintenance costs for the remote controlled waste transportation system were $US284,485/year and $US99,240/year, respectively. Table 4 outlines that the overall waste management costs for 2014 were $US5,079,191, or approximately $US2.36/kg.
Table 4: Overall waste management costs for 2014
Item cost
Final cost (+ 22% VAT) ($US/y)
Healthcare waste disposal cost 2,274,980
Non-hazardous HCW cost 704,051
Internal depot management and internal goods transportation 1,716,435 Remote control system for waste and good transportation running and
management costs
383,725
Total 5,079,191
Table 5 lists that the overall unit costs for the non-hazardous HCW and hazardous HCW were approximately $US1.14/kg and $US3.93/kg, respectively.
Table 5: Overall unit waste management costs for the two waste streams in 2014
Item cost Unit Non-hazardous
HCW
Hazardous HCW
Managing the internal depot, Halipack® bags
and used furniture [$US/year]
326,219 761,177
Internal goods transportation [$US/year] 188,711 440,327
Remote control transportation system and lift [$US/year] 112,873 171,612
Operating and management [$US/year] 39,398 59,842
Non-hazardous HCW costs [$US/year] 704,051
-Hazardous HCW costs [$US/year] - 2,274,980
TOTAL costs [$US/year] 1,371,252 3,707,939
Waste amount [kg] 1,206,136 944,611
Unit costs [$US/kg] 1.14 3.93
4. Discussion
Generally, more developed countries had a higher per capita health spend (Table 3). Similarly to Winfield and Brooks (2015), GDP and the percentage spend on healthcare correlated positively with HCW generation rates at the national level. Thus generally, higher income countries that spent more on healthcare provision also produced more waste. This is instructive, as it suggests that given that spend on healthcare provision is rising, waste quantities will also rise. It also indicates the urgent need for higher income countries to do more as it relates to decoupling spend and waste generation rates
13
and recovery value from that produced. An important point to note though is that there were exceptions to the general rule. For example, Germany, despite its high GDP, had a significantly lower rate compared to the other countries that spent a ‘high’ percentage of their GDP on healthcare, while France and Italy were above the expected levels (Figure 2). These deviations from the expectations may have been due to various reasons including more stringent enforcement of regulations and greater efficiency in processes. However, based on the findings from the site, a key factor may relate to levels of waste segregation. The non-hazardous waste contained high levels of potentially recyclable waste. While the hazardous waste was not examined, it is possible that there may have been a significant percentage of this waste that was not hazardous. Higher quantities of hazardous waste cost more, as unit prices were higher (Table 5). This assumption would however, require further study both in Italy, as well as in France. However, greater segregation of hazardous and non-hazardous waste could lead to significant cost reductions (RCN, 2011).
At the site level, the average per capita HCW generation was 1.01 kg/day, which is around half of the national average (Table 1). Anesthetics and the intensive care department were the highest average monthly generators of hazardous infectious HCW (i.e. 180103*). The average monthly 180103* production rate/clinical procedure was 0.046 kg/clinical procedure, with the highest generating departments being radiology and gastroenterology. This waste generation rate/procedure is about 2.5 times that of Moreira and Günther (2013). If generation rates are examined on the basis of bed occupancy, then the average daily waste production per activated bed, and per occupied bed were 0.9 kg and 1.09 kg, respectively, with anesthetics and pediatric and intensive care being amongst the highest producers. The production of higher quantities of waste from ‘short-stay’ clinical areas is similar to the findings of others (e.g. Liberti et al., 1996; Cheng et al., 2009). The strong link between waste generation and both department type (Tudor, 2007; Moreira and Günther, 2013), as well as clinical procedure (Mathausera and Wittenbecherb, 2013; Xin, 2015), is also similar to other studies. The rate for per occupied bed waste arisings is about a third that of the USA, and slightly lower than that of South Africa (UNEP, 2012).
As shown in Table 4, the overall costs of managing the waste during 2014 were $US5,079,191, at a unit cost of $US2.36/kg. Disposal costs accounted for approximately 44.8% of these overall costs, at $US2,274,980. While the costs for managing the internal depot, Halipack® bins, and the internal waste transportation were approximately 21.4% and 12.4%, respectively. As expected, the management of HCW was much higher than that of the non-hazardous waste, at a unit cost of $US3.93/kg, as compared to $US1.14/kg. In addition, the hospital also paid a fee (TARI) of $US704,051 for the management of its non-hazardous waste. However, as the costs for the
14
management of this waste were linked to the physical space occupied rather than the quantity generated may explain the rise in waste following the move to the new site. Evidently, while the legislation exists in Italy (DLgs.152/2006), the practice on the ground does not always take account of the need to employ efficient and cost effective processes. Therefore, it is suggested that the TARI should take account also of the quantity of waste produced, in addition to the physical area occupied, in order to serve as a more effective incentive for waste reduction (Muhlich et al., 2003).
There were some limitations to the study. First, the data for the costing were taken from a range of sources, and years, as it was not possible to source the data from one reference. This might have introduced some biased into the data. However, the process for managing the data was the same. Second, the choice of countries selected was based solely on the availability of data. Nevertheless, they represent a range of GDPs. Third, the study focused only on one site. However, this was compensated for by the detail provided by the site, which can often be a challenge. Nevertheless, the inclusion of a wider range of sites and countries would help to ensure greater validity and reliability of the data and conclusions.
5. Conclusions
With increasing spend on healthcare, there is an increasing focus on a more sustainable approach to managing HCW generation and the associated costs. This study has illustrated that there is a positive correlation between healthcare spend and waste arisings, with higher income countries generally producing more waste. Evidently, however, as illustrated by Germany, spend and waste arisings can be decoupled. In Italy, greater reduction could potentially also be facilitated through attention being paid to linking the TARI to waste generation rates. The site level findings suggest that factors such as department type, clinical procedure, and potentially also waste segregation levels are key issues that should be focused upon. In addition, given the high percentage of both unsorted and organic materials in the non-hazardous waste, use of more sustainable methods (e.g. biological treatment), would serve to reduce the disposal costs. It is only by addressing these issues that waste arisings and spend might most effectively be decoupled and reduced.
Acknowledgements
The authors are grateful to the Hospital and its staff for providing data and hosting the study. Acknowledgements are especially given to Fabio Nodari for his support during data collection. Authors’ contribution
15
Mentore Vaccari set up the research and with Terry Tudor carried out the literature survey, data analysis, results discussion and paper drafting. Andrea Perteghella contributed to the data analysis and paper drafting.
16 References
Abdulla F., Qdais HA., Rabi A. (2008). Site investigation on medical waste management practises in Northern Jordan. Waste Management. 28: 450 – 458.
Alagöz AZ., Kocasoy G. (2008). Improvement and modification of the routing system for the health-care waste collection and transportation in _Istanbul. Waste Management. 28: 1461 – 1471.
APAT (2008) Valutazioni quali-quantitative sulla produzione e gestione dei rifiuti speciali sanitari. Roma: APAT Rapporti Tecnici.
Askarian M., Heidarpoor P., Assadian O. (2010). A total quality management approach to healthcare waste management in Namazi Hospital, Iran. Waste Management. 30: 2321- 2326.
Bazrafshan E, Kord Mostafapoor F (2011) Survey of medical waste characterization and management in Iran: a case study of Sistan and Baluchestan Province. Waste Manage & Research, 29(4): 442-450 Bdour A., Altrabheh B., Hadadin N., Al-Sharief M. (2007). Assessment of medical wastes management practice: a case study of the northern part of Jordan. Waste Management. 746 – 759. Birpinar ME., Bilgili MS., Erdoğan T. (2009). Medical waste management in Turkey: a case study of Istanbul. Waste Management. 29: 445 – 448.
Board of Governors of the Federal Reserve System (2017). Foreign Exchange Rates -- G.5A Annual. From: https://www.federalreserve.gov/releases/g5a/current/ (accessed April 20, 2017)
Campion N, Thiel CL, Woods NC, Swanzy L, Landis AE, Bilec MM. (2015). Sustainable healthcare and environmental life-cycle impacts of disposable supplies: a focus on disposable custom packs. Journal of Cleaner Production. 94: 46 - 55
Caniato M., Tudor TL., Vaccari M. (2015) International governance structures for health-care waste management: a systematic review of scientific literature. Journal of Environmental Management. 153: 93 - 107
Castellani, V., Sala, S., Mirabella, N. (2015). Beyond the throwaway society: A life cycle-based assessment of the environmental benefit of reuse. Integrated Environmental Assessment and Management, 11(3), 373–382.
Cheng, Y.W., Sung, F.C., Yang, Y., Lo, Y.H., Chung, Y.T., Li, K.C. (2009). Medical waste production at hospitals and associated factors. Waste Management. 29, 440 - 444.
Da Silva CE, Hoppe AE, Ravanello MM, Mello N (2005). Medical wastes management in the south of Brazil. Waste Management, 25 (6 SPEC. ISS.): 600-605
EC (2008). EU waste legislation. Available from:
http://ec.europa.eu/environment/waste/legislation/a.htm
EC (2016). Eurostat: environmental data centre on waste. Available from:
17
Farzadkia M, Moradi A, Shah Mohammadi M (2009) Hospital waste management status in Iran: a case study in the teaching hospitals of Iran University of Medical Sciences. Waste Manage and Research, 27: 384-389
Ibbotson, S., Dettmer, T., Kara, S., Herrmann, C. (2013). Eco-efficiency of disposable and reusable surgical instruments - A scissors case. International Journal of Life Cycle Assessment, 18, 1137– 1148.
ISPRA (2014). Rapporto Rifiuti Speciali - Edizione 2014. Available from: http://www.isprambiente.gov.it/it/pubblicazioni/rapporti/rapporto-rifiuti-speciali-edizione-2014 Italian Government (2010) Disposizioni di attuazione della direttiva 2008/98/CE del Parlamento europeo e del Consiglio del 19 novembre 2008 relativa ai rifiuti e che abroga alcune direttive. D.lgs 205. G. U. n. 288 10/12/2010.
Jang YC., Lee C., Yoon OS., Kim H. (2006). Medical waste management in Korea. Journal of Environmental Management. 80: 107 – 115.
Komilis D, Katsafaros N, Vassilopoulos P (2011). Hazardous medical waste generation in Greece: Case studies from medical facilities in Attica and from a small insular hospital. Waste Management and Research, 29 (8): 807-814
Liberti, L., Tursi, A., Costantino, N., Ferrara, L., Nuzzo, G., (1996). Optimization of infectious hospital waste management in Italy: part II. Waste characterization by origin. Waste Management and Research. 14, 417 - 431.
Mathausera I., Wittenbecherb F. (2013). Hospital payment system based on diagnosis related groups: experiences in low and middle income countries. World Health Organization Bulletin. 91: 746A – 756.
Moreira A.M.M., Günther W.M.R. (2013). Assessment of medical waste management at a primary health-care center in São Paulo, Brazil. Waste Management 33: 162 – 167.
Mosquera M, Andrés-Prado MJ, Rodríguez-Caravaca G, Latasa P., Mosquera MEG. (2014). Evaluation of an education and training intervention to reduce health care waste in a tertiary hospital in Spain. American Journal of Infection Control. 42: 894 – 897.
Mühlich M, Scherrer M, Daschner FD (2003). Comparison of infectious waste management in European hospitals. Journal of Hospital Infection, 55 (4): 260-268.
Nichols A., Grose J., Mukonoweshuro R., (2016). Achieving cost and carbon savings in neonatal practice: A review of the literature on sustainable waste management. Journal of Neonatal Nursing. 22: 81 – 87.
Ozbek M, Sanin FD (2004). A study of the dental solid waste produced in a school of dentistry in Turkey. Waste Management, 24: 339-345
18
Patwary MA., O’Hare WT., Street G., Maudood EK., Shaadat HS., Sarker MH. (2009a). Quantitative assessment of medical waste generation in the capital city of Bangladesh. Waste Management. 29: 2398 – 2403.
Patwary MA., O’Hare WT., Street G., Elahi KM., Hossain SS., Sarker MH. (2009b). health and safety perspective on medical waste management in a developing country: a case study of Dhaka City. Gemini International Limited. 282 – 290. ISBN: 978-0-9562303-2-4.
RCN (2011). Royal College of Nursing, 2011. Freedom of Information report on waste management. Royal College of Nursing, London. England.
Spasov A. (2003). Hospital waste management and health-ecological risk prophylaxis in Bulgaria. Florida State University. Sofia. Bulgaria.
Swensen SJ, Kaplan GS, Meyer GS, Nelson EC, Hunt GC, Pryor DB, Weissberg JI, Daley J, Yates GR, Chassin MR. (2011). Controlling healthcare costs by removing waste: what American doctors can do now? BMJ Qual. Saf., 20 (6): 534–537
Taghipour H., Mosaferi M. (2009). Characterization of medical waste from hospitals in Tabriz, Iran. Science of the Total Environment. 407: 1527 – 1535.
Testa, F., Iraldo, F., Frey, M., Daddi, T. (2012). What factors influence the uptake of GPP (green public procurement) practices? New evidence from an Italian survey. Ecological Economics, 82, 88– 96.
Tudor TL (2007). Towards the development of a standardised measurement unit for healthcare waste generation. Resources, Conservation and Recycling. 50: 319 – 333.
UNEP (2012). Compendium of technologies for the treatment/destruction of healthcare waste. Osaka, Japan.
Viani C, Vaccari M, Tudor T (2016). Recovering value from used medical instruments: A case study of laryngoscopes in England and Italy. Resources, Conservation and Recycling, 111: 1-9
Voudrias E, Goudakou L., Kermenidou M., Softa A. (2012). Composition and production rate of pharmaceutical and chemical waste from Xanthi General Hospital in Greece. Waste Management. 32: 1442 – 1452.
WHO (2011). Waste from health-care activities. Geneva: World Health Organization.
WHO (2014). Safe management of wastes from healthcare activities (2nd Ed.). Geneva: WHO Press. Windfeld ES., Brooks MSL. (2015). Medical waste management – A review. Journal of Environmental Management, 163, 98–108.
World Bank (2016). Health expenditure total (% of GDP) - 2016. Available from:
http://data.worldbank.org/indicator/SH.XPD.TOTL.ZS accessed on 24/4/2017
Xin Y. (2015). Comparison of hospital medical waste generation rate based on diagnosis-related groups. Journal of Cleaner Production. 100: 202 – 207.