Università degli Studi di Salerno
DIPARTIMENTO DI SCIENZE ECONOMICHE E STATISTICHE
Roberto Iorio1, Sandrine Labory2, Daniele Paci3
T
HED
ETERMINANTS OFR
ESEARCHQ
UALITY INI
TALY:
E
MPIRICALE
VIDENCE USINGB
IBLIOMETRICD
ATA IN THEB
IOTECHS
ECTOR*
WORKING PAPER 3.190
* This paper derives from a strict collaboration among the three authors. Anyway parr. 1 and 2 may be mainly attributed to Sandrine Labory, parr. 3, 4 and 5 mainly to Daniele Paci, par. 6 mainly to Roberto Iorio.
1 University of Salerno, via Ponte don Melillo, 84084 Fisciano (SA). E-mail: [email protected] (corresponding author).
2 University of Ferrara. 3 University of Ferrara.
INDICE
Abstract ... 3
Introduction... 5
1. Literature review ... 8
2. The Italian biotechnology sector... 11
3. Data and methodology ... 13
4. Empirical results: a descriptive analysis ... 15
5. Empirical analysis in depth: networks of co-authorships, quality of publications, importance of firm size ... 18
5.1 The analysis of collaboration networks ... 18
5.2 The determinants of research quality... 24
5.3 Looking ahead: including firm’s data in the analysis... 31
Conclusions ... 35
3 Abstract
Does the collaboration between firms and universities or other research organisations improves the quality of research? Why do firms collaborate with public research organisations? The rising importance of university- industry collaboration over the last twenty years makes this question a relevant one. We therefore analyse the relationships between firms and universities using data on firms’ publications in scientific journals. Among all channels through which the relationships between universities and firms are built, joint scientific publications appear to be an important but yet little explored one, especially as regards Italy. We consider the case of the biotechnology sector in Italy. Our aim is to analyse the behaviour of the firms with respect to publications and innovation, in order to shed new insights on the peculiarities of the Italian innovation system and the possible policy implications.
For this purpose we built a database of all scientific publications of Italian biotechnology firms over the period 1990 to 2006 and we provide evidence on the institutional and geographic nature of publication networks and on the determinants of research quality. We find that the collaboration with universities and international partners, especially if the research networks are large and varied, increases the research quality.
We also begun to collect data on firm size from 1997 to 2006, in order to confront them with the data on publications: our preliminary analysis shows that larger firms have a higher propensity to publish, however small (but not micro) firms publish very high quality papers.
Keywords: innovation; university-industry relationship; scientific
publications; biotechnology
5 Introduction
Does the collaboration between firms and universities or other research organisations improves the quality of research? Why do firms collaborate with publicly-funded research organisations? The rising importance of university- industry collaboration over the last twenty years make this question a relevant one.
The world economy has experienced significant changes in the last twenty years, including the entry of emerging countries on world markets, some of which of very large dimension and enormous potential, and the diffusion of information and communication technologies and other new and important (in terms of spillovers) technologies such as the biotechnologies. These changes have led to the upsurge of the “knowledge-based economy”, in which intangible assets, such as human capital, knowledge and innovation, have become relatively more important than tangible ones, such as production volume, costs, and so on. Another, perhaps related change in the economy is that the “traditional model” of research, whereby basic and applied research where clearly separated has progressively been replaced by a new one in a process starting in the United States. According to the traditional paradigm, publicly-funded research institutes realise basic research while applied research and product development are realised by industry. The results of basic research are communicated through conferences and publications and can be freely used by industry in order to innovate, but industries’ innovations are protected from diffusion by intellectual property rights (patents), industrial secrecy or other means (see Cohen, 1995, for a review). Direct collaborations between university scientists and members of private firms are now strongly growing, especially in high tech sectors.
This evolution of the economy and of the role of the university is reflected in a substantial change in the concept of innovation. Innovation is no longer considered as a unidirectional and linear process that is realised within a single organisation (firm or university). Innovative ideas can be generated not only from internal sources such as R&D activities, marketing or practical
production experience (Von Hippel, 1998), but also from external sources, such as consumers, related or rival firms or institutions (Feldman, 1994). Innovation is therefore increasingly considered as an evolutionary, non linear and interactive process between the firm and the external environment (Kline and Rosenberg 1986, Dasgupta and David 1994). Hence the existence of innovation systems at various levels (local, regional or national: Freeman, 1987; Lundvall, 1992; Nelson 1993) and in various sectors (Malerba, 2004), where the interactions between the actors of innovation process, especially those between universities and firms, are seen as key to innovation.
The result is that the role of the university is changing. There is now a large body of literature on the relationships between firms and university that has shown their reasons, modes and effects. Some scholars argue that the university is increasingly becoming an “entrepreneurial” organisation in the knowledge-based economy (Etzkowitz and Leydesdorf, 1997; Etzkowitz et al., 2000; OECD, 2002).
Universities appear to have become a direct player in a new form of knowledge creation and economic development. Their main role is no longer just knowledge preservation and transmission, but also the creation of new knowledge with advanced research and knowledge transmission to the surrounding environment (other universities and institutes, industrial firms, etc.) . They still train human capital but rather than transmitting a stable knowledge base to students they now primarily teach the capability to create knowledge; they are a direct player in that they create knowledge through scientific and technological research and they encourage the creation of firms (academic spin-offs) around these innovations. Universities are therefore more directly involved in the creation of economic value and they interact more and more directly with the business world.
Different modes of interaction between universities and firms have been highlighted in the literature (Cohen et al., 2002; Schartinger et al., 2002; OECD, 2002): for instance through the mobility of
7
researchers between universities and firms; training periods of students in firms; joint supervision of Ph.D. and masters’ theses; some university lectures held by firm members; and joint scientific publications. Scholars in the field of the economics of innovation are therefore interested in such relationships, especially since they are often assimilated with relationships between science and technology or between basic and applied research.
In this paper we analyse the relationships between firms and universities, using data on the firms’ publications in scientific journals. Among all channels through which the relationships between universities and firms are built, joint scientific publications appear to be an important but yet little explored one. The limited evidence on this aspect mainly regards the United States where it has been shown that this phenomenon is increasing in importance. Some evidence also exist for the UK (Kumaramangalam, 2005; Gittleman, 2005).
We provide evidence on the determinants of firms’ publishing behaviour and on the quality of research in the case of the biotechnology sector in Italy. Our aim is to analyse the behaviour of Italian firms with respect to publications and innovation, in order to shed new insights on the peculiarities of the Italian innovation system and possible policy implications. For this purpose, we build a database of all scientific publications of Italian biotechnology firms over the period 1990 to 2006. We also collect structural data on the firms, i.e. data on sales, size, R&D investment, etc., in order to confront them with the data on publications.
We can thus assess which firms do publish in Italy and why: is publication determined by firm size, firm age, the extent of collaboration with public research organisations, or other factors? We can also assess the networks of collaboration of Italian firms with other local, regional or international organisations.
The data allow us to address different issues, and in this paper we focus on the determinants of research quality. We measure the productivity of research by citations to papers. The number of citations of an article is not a perfect measure of its quality, since it measures the impact of the article on other research rather than directly measuring quality. However, we assume that the impact of
the article is correlated with its quality, namely that the higher the quality of the article, the more it will be cited. Given this assumption, we use it as indicator of quality of research.
We focus on a particular sector: the biotechnology industry. We chose this sector because it has been recognised as one of the sectors where the boundary between basic and applied research is most blurring (Arrora and Gambardella, 1994; McMillan et al., 2000; Gittleman and Kogut, 2001; Cockburn, 2005) in that the development of the sector has been based on a strong collaboration between industry and universities. The reason for this is that in such a sector scientific discoveries already have economic value and can readily be commercially exploited (Pavitt, 1998; Zucker et al. 1998). The biotech industry has generally been incubated within the academic science and therefore close links between biotech firms and universities are more likely to continue than in other sectors.
The paper is structured as follows. We review the literature in the second section and derive a number of hypotheses to be tested in our empirical analysis. We present the main characteristics of the biotechnology sector in Italy in the third section, and add a few hypotheses to be tested from these general considerations. The data and methodology are presented in section 4, while section 5 presents the empirical results. Section 6 concludes.
1. Literature review
The relationships between universities and firms have been the subject of many studies in recent years, for a number of reasons. Scholars are interested in this relationship because it allows us to address a number of related issues:
1. the changing role of universities in the national and regional innovation systems and in the innovation process, as outlined above;
2. the blurring frontier between basic and applied research; 3. the nature and extent of spillovers;
4. the nature and extent of networks in the innovation process;
9
The most important communication channel of industry and university appears to be formal collaborative research, both in the US (Cohen et al, 2002) and in Europe (Meyer-Krahmer and Schmoch, 1999; Arundel and Geuna, 2004). Formal collaborations include specific research project, joint publications and conferences. Hence joint publication appears to be an important channel of the relationship between firms and universities.
Arrow (1962) shows that the presence of externalities in research implies that the private and social returns to R&D diverge, particularly for basic research. If firms cannot appropriate the full returns to R&D, they will underinvest in R&D: why then would any firm be interested in publishing in scientific journals, thereby disclosing knowledge?
According to Nelson (1990), firms have five main incentives to publish:
1. to attract customers; 2. to establish legal rights; 3. to attract capital;
4. to inform suppliers; 5. to gain reputation.
Other scholars, such as Gittleman (2005) and Hicks (1995), add the motivation to access the knowledge base of universities, since the direct collaboration of firm members with university scientists allows a higher transfer of knowledge and knowledge creation. In particular, tacit knowledge is more easily exchanged via direct collaboration (Rosenberg, 1990).
Related to the reason outlined above, firms have been shown to publish in order to increase their absorptive capacity (Cockburn and Henderson, 1998): collaboration with university scientists might allow firms to draw a direct and an indirect benefit. The direct benefit is that firms get access to the latest created knowledge and to the university’s knowledge base. The indirect gain is that firms’ members might learn from the collaboration with university scientists and allow them to better understand the new knowledge, thereby raising their so-called absorptive capacity (term first defined by Cohen and Levinthal, 1990).
Firms might also publish with universities to reduce labour costs. Thus Stern (1999) shows that in a sample of post doc job applicants, researchers accepted lower wages to work in high quality basic science rather than high wages in applied science. Hence collaboration through joint publication allows the firm to use the human capital of the university scientist without having to pay him/her a high wage; it can also hire researchers that prefer working on basic science and accept lower wages for this.
A number of papers use survey data on the collaboration between firms and universities to determine the reasons for firms to collaborate with academia. Cohen et al (2002) find that size and the age of the firm increases the probability of the firm to benefit from academic knowledge. Arundel and Geuna (2004) and Schartinger et al (2001) add other explanatory variables such as the level of R&D expenditure and the degree of the firm’s openness (measured by the number of channels through which she has relationships with academia). Mohnen and Hoeareau (2002) find that firms which collaborate most with universities are generally large, active in scientific sectors, patent a lot and receive government support.
Gittleman (2005) analyses data of US biotech firms that obtained patents during the period 1988 to 1995, together with the number of citations up to 2000. She hypotheses that: 1) the value of a firm’s knowledge stock declines with firm age; 2) collaboration has a positive impact on the value of firm knowledge. She shows that about a third of papers appear in journals ranked among the top 25 in terms of their citation impact, and that about 70% of articles are published in collaboration with other institutions. The first hypothesis is not verified: the value of a firm’s knowledge stock does not decline with firm age. According to us, this makes sense since most firms continue research through time and try to constantly update their knowledge base. An older firm can therefore take advantage of past experience in conducting its research and this must make its search activity more effective. The second hypothesis is instead verified by the author, namely that collaboration increases the quality of research as measured by citations.
Kumaramangalam (2005) estimates the determinants of the quality of research using UK bibliometric data. He relates the impact
11
factor to explanatory variables such as the number of authors in a paper; the number of biotech firms in a paper; the number of academic institutions listed in a paper; the ratio of academic institutions to the total number of collaborators; the square of the total number of authors; the number of foreign addresses on a paper; and the level of research (basic or applied). He estimates a multinomial logit model and finds that the probability of publishing in a high quality journal increases with the number of authors in a paper (but with diminishing return after a threshold, because an additional collaborator increases the richness of the collective research and knowledge creation process up to a point where the total number of collaborators is too high so that it is difficult to get an agreement and coordination costs become too large), with the number of biotech firms in a paper; the number of academic institutions and the number of foreign addresses. He also finds evidence of learning effects, since year dummies improve the estimation. He controls for firm effects using firm dummies, and find positive effects and an improvement in the overall estimation. 2. The Italian biotechnology sector
The Italian innovation system is usually considered weak in comparison to other industrialized countries. Looking at Italian exports by sector, the model of industrial specialization of Italy appears clearly: ‘footwear and leather goods’ is the leading sector (15,1% of world market share), followed by domestic appliances and furniture (13.8 and 13,3% respectively in 2004). Italian industrial specialization is clearly on traditional sectors (Onida, 2002; Chiarlone and Helg, 2002; Faini and Sapir, 2005; Grilli and Mariotti, 2006). Investments in R&D are traditionally low in Italy and sectors with high degree of innovationa are traditionally under-developed.
In 2003 Research and Development (R&D) expenditure in Italy was about 1.14% of GDP, compared to 2.68% in the USA. In Italy, 50% of research is conducted by publicly-funded organizations (primarely universities) and the level of investment is estimated to be similar to other Organization for Economic Co-operation and Development (OECD) countries. Public funds derive from European, National Government and Regional sources, and most universities and research centers are owned by the central
government. Private expenditure in R&D is estimated at 0.55% of GDP, compared to the 1.53% average for OECD countries. Most Italian companies are small-to-medium sized enterprises (SMEs), often specialized in small, even niche, markets. Even though many of them are world leaders in their niche, most of them invest few (or no) resources in long-term research projects that would allow them to maintain their competitive advantage.
Also the collaboration between academic research and private research has been traditionally weak even if the situation has recently changed for a number of reasons. These include the pressures of globalization, increasing competition and the slowdown of the Italian economy, but also due to alterations in the traditional system of research funding, which in the past was based on small grants supplied to many researchers, but now is often focused more on promising projects. The availability of EU funds, mainly through the so-called “framework programs”, has allowed Italian research centers and companies to develop joint research with foreign counterparts. Many new Science Parks and spin-off companies have been established recently.
Italian scientific “output”, measured in terms of publications and in terms of citations shows that Italy, according to data from Essential Science Indicators, is ranked seventh in the world, in line with other works published in Nature in the past, where Italy was ranked seventh in terms of scientific impact.
The challenges from globalization and the emergence of new industrialized countries (like China and India) have recently turned the attention of policy makers to the development of new science-based sectors such as biotechnology.
In this sector Italy is a latecomer, but it has gained increasing importance in recent years. In some respects, the Italian biotechnology industry appears to be a young dynamic sector. The most updated and comprehensive study available on this sector in Italy is realized by Blossom and Associates in 2007. They collected data on 222 companies in all the segments of the biotech production with a total EUR 4083 million revenue, which represents approximately 0.4% of the Italian Gross Domestic Product. The statement that the power of the Italian economy relies on small and medium enterprises is also confirmed in the biotech sector where 76% of the companies have less than 50
13
employees with a revenue of less than 10 million euro. The remaining 24% is equally divided between companies of medium size (12%), i.e. companies that employ less than 250 people with an annual turnover of no more than EUR 50 million, and 12% of large enterprises with over 250 employees and EUR 50 million of turnover. In terms of revenue and employment, large companies are accountable for 80% of the total revenue and over 80% of the employment. From a financial standpoint, institutional investors and financial operators support 12% of the companies surveyed. Furthermore, only 5% of these investors are seed funds or venture capitalists. On the other hand, the number of companies created every year remains small and once created they remain small sized because of the lack of resources they need for their growth. However biotech companies tends to be relatively small also in other countries (US and UK, for instance), therefore the size issue is not related to Italian peculiarity. The absence of a venture capital community and risk oriented investors is a major problem for the development and maturity of the Italian biotech industry.
Science and Technology Parks seems to play an important role in supporting biotech companies, as they account for 30% of the company location.
However, we used for our analysis in the following sections, a more detailed original dataset, built by merging different and sources of information and data on the Italian biotech industry. 3. Data and methodology
In order to build the database of scientific publications in the biotech sector, we first look for a list of all biotechnology firms in Italy. Given that the biotechnology sector comprises firms in different official sectors, this is not a straightforward operation. We use the outcome of a research jointly conducted by the Department of Economic and Statistics of the University of Salerno and by IRAT/CNR of Naples aiming at building a unique national database (on the base of the different existing databases in Italy on the biotech sectors) of all national “biotech unities”, that are “profit” and “non-profit” firms (such as university departments, publicly-funded research institutes), consortia which use
biotechnologies, research unities where biotechnologies are studied. This database is named RP biotech (D’Amore and Vittoria, 2006). From this database we extracted exclusively private for-profit firms, operating in the fields specifically linked to the health sector (pharmaceutical, diagnostic, medical and veterinary apparels). These are the so-called “red biotech” which represents the field of application for the 74% of all biotech companies (Assobiotec, 2007) .
The database includes 371 for-profit firms located in Italy which utilize biotechnologies for health-related products.
For publications, we included those reported in the database
ISI-Web of Science from 1989 to 20061. We assumed that a
publication refers to a firm when, among the addresses of the article, there was the address of the firm itself.
Bibliometric data can be used to build indicators of both the output of research (publications) and of the quality of research (number of citations). In addition, jointly authored papers provide evidence of the collaboration between researchers (university – industry; industry – industry, etc.) (Katz and Martin, 1997). The location of collaborators can be used to indicate how much the firm relies on external sources of knowledge in order to innovate (Hicks et al., 1994). Bibliometric data can also show the mobility of researchers between institutions (Katz and Hicks, 1998).
Bibliometric data also have limits. Katz and Hicks (1998) note that such data only refer to laboratory-based research and only concern that part of knowledge that can be made public. The ISI Web of Science is biased towards American publications and might not contain all European publications, since it includes more minor US journals than minor European ones and since non-English language journals are not comprehensively surveyed. We measure the quality of research by the number of citations, and not the impact factor, since the impact factor indicates the quality of the journal and not of the particular paper, whereas the number of citations pertains directly to the importance of the given paper. Therefore, our methodology consists of regressing the
1
15
quality of research measured by the number of citations of the paper on a number of explanatory variables.
The literature stresses that firms’ characteristics are important to take into account in the analysis: firm size, firm age, R&D expenditure, etc., are likely to have an effect on the propensity of the firm to publish and on the quality of publication. Hence we include these data in our analysis.
Firm data are taken from the database AIDA (Bureau van Dijk) which contains balance sheet information on all firms operating in Italy. In this paper we consider only the sales revenue and the number of employees, as proxies for firm size. We have data on the number of employees from 2001 to 2006 for 213 firms and data on sales from 1997 to 2006 for 285 firms (55.2% of the total number of firms, 371, included in RP biotech database).
4. Empirical results: a descriptive analysis
A first immediate result is that the overall number of publications by Italian firms has increased over time, as it has occurred in other countries. We show this trend in Figure 1.
Fig 1. Total number of publications by Italian Biotech Firms, 1989 - 2005
198 9 199 0 199 1 1992 1993 1994 1995 199 6 199 7 1998 1999 2000 200 1 20 02 20 03 20 04 20 05 0 100 200 300 400
Considering where Italian biotech firms are located, data collected presents a highly skewed distribution. Figure 2 shows the geographical (regional) breakdown of the firms in our database.
Fig. 2 Number of biotech firms per region (percentage)
Lombardy dominates the number of firms in the sample, with aproximatively 47% of the firms in the dataset located there. The remaining firms are almost equally located in Lazio, Piemonte, Emilia Romagna, Friuli Venezia Giulia, Toscana and Veneto. The first region of Southern Italy is Campania, with 11 biotech firms (Figure 2).
The overall number of publications is also dominated by Lombardy. However, looking at the average scientific production of firms in each region (average number of publications per firm), Abruzzo and Sicily have the first two positions in the ranking. A biotech firm in Abruzzo has on average 27 publications and 24 in Sicily2, while in Lombardy the average number of publications per firm is only about 10. This is illustrated in Figure 3.
2
This is due to some important companies in both region: Dompè in Abruzzo has 125 publications while in Sicily SIFI – Società Farmaceutica Italiana appears as an author in 68 publications. In the latter case the firm is one of the three biotech companies in the region.
Lom bardLaziaioPiemon
te Em ilia Rom agna Friuli V .G.
ToscanaVenetoCampan ia
LiguriaMarchePugliaSardegn a
AbruzzoSiciliaTrentin o A.A. MoliseBasilicaUmtabria
0 10 20 30 40 50
17
Fig. 3 Average number of publication per firm in each region
The distribution of publications among firms is particularly skewed. Only 155 firms out of 371 has at least one publication. This means that about 60% of the firms in the database have no publications at all. The first firm in terms of number of publications appears as an author in 410 different articles, Since the overall number of publications in the dataset is 4107, this amounts to saying that this firm alone contributes up to nearly 10% of the observations.
The first 10 companies in terms of publications accounts for more than 50% of the observations, and for the first 20 biotech firms this figure raises to 72%.
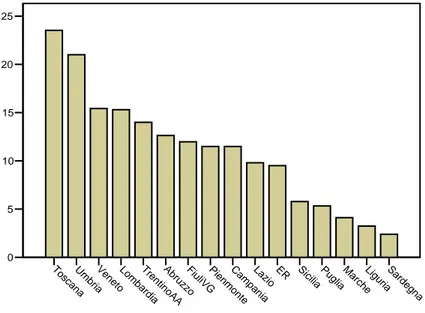
Figure 4. Average number of citations per article by region Abruz
zoSiciliaLazio Vene
toToscanaLombarEmdiailia R om agna Ca mp ania Piem
onteSardegnaFriuli V.G. LiguriaPu
gliaMarche Um
briaTrentin o A
.A. Ba
silicMataolise
0 5 10 15 20 25 30 Tosc ana U mb ria Ve netoLomb ardi a Tren tino AA Abr uzzoFiuliV G Pien mo nte C am pa ni a Laz io ER S
iciliaPugliaMarch e Ligu ria Sar deg na 0 5 10 15 20 25
The average number of citations per article, which could be used as a proxy for the quality of the scientific output, shows that the average quality of the research published by biotech firms is higher in certain regions. However, there seems to be a weak reationship with the number of firms and the total number of scientific articles published by firms of the same region. Tuscany ranks first with about 23 citations per article published on average.
5. Empirical analysis in depth: networks of co-authorships, quality of publications, importance of firm size
In the following analysis we will concentrate on three particularly interesting aspects:
a) the analysis of collaboration networks ; b) the determinants of publications quality ; c) the importance of firm characteristics.
These three aspects are strictly related, because, as we will see, the quality of publications largely depends on the nature of collaboration network and it is particularly interesting to investigate how firms characteristics are related to the typology of collaboration networks and to the quality of publications.
5.1 The analysis of collaboration networks
We argued above that publishing a paper on an international review can be considered as evidence of research quality and of a certain degree of “openness” in terms of collaborations: this firm is collaborating or is looking for collaborations.
This evidence of “openness” is actually reflected in collaborations in most cases: only 16.5% of publications have only one address, so that there is no other co-authoring institution. Hence 83.5% of publications is the result of a collaboration. This data can be interpreted as evidence of the importance of “external sources” in the innovative process. In 1245 cases (30.5%) there is one other authoring institution; in the other 2157 publications (52.9%) co-authors are at least three. Table 1 sums up the frequency of number of co-authoring institutions (including the firm itself).
19
Table 1 – Number of articles per number of co-authoring institutions
Number of co-authoring institutions Number of articles Share (%) Cumulative Share (%) 1 674 16.5 16.5 2 1245 30.5 47.1 3 977 24.0 71.1 4 547 13.4 84.5 5 293 7.2 91.7 6 117 2.9 94.5 7 64 1.6 96.1 8 61 1.5 97.6 > 8 98 2.4 100 Total 4076 100
The phenomenon of collaboration in publications is also increasing over time: the average number of co-authoring institutions rises from 2.4 in 1990 to 3.6 in 2006 (the average over the whole period is 3.11).
Institutional collaboration happens obviously through personal collaboration: only 89 papers out of 4076 (2.2%) are signed by one only author. The average number of authors is 6.9 and this number also increases over time, from 5.4 in 1990 to 8 in 2006.
We now take into account the nature of the subjects with whom the joint publication is done.
67.1% of publications have the address of at least one university, of which half is with one university only and another half have at least two universities.
Collaborations are considerably less usual with hospital and firms: 29% of publications have the address of at least one hospital or other non-university research institutions3, half of which is with two or more hospitals; 16.7% of publications have the address of at
3
From now on, when we write “hospitals” we mean “hospitals and other non-university research institutions”.
least one other firm; collaboration among more than two firms are quite rare.
We can conclude that universities are the favoured institutional partners, while collaborations among firms is quite rare, particularly among several firms.
In the previous analysis we saw that a single paper is often published by authors belonging to more than one university, hospital or firm; we can also observe that in many cases papers are co-authored by authors belonging to different kinds of institutions. The following table shows the frequency of different combinations among institutions: as we saw above, 674 articles have no other co-authors than the considered firm; 1478 articles have collaboration with university(ies) only; 250 articles have collaboration with one or more firms. Firms collaborating with universities and hospitals together (15.2% of the total published articles) are quite frequent. As regards collaborations among firms, our sample contains 678 papers with at least two co-authoring firms: of which 428 (63.1%) have also universities or hospitals addresses, so that collaborations among firms might often be “driven” by non-profit institutions. Table 2 shows the frequency of the different combinations of “institutional networks”
Table 2– Collaboration networks among institutions
Collaborating institutions Number of
Articles Share (%) Cumulative Share (%) No collaboration 674 16.5 16.5 Universities only 1748 42.9 59.4 Hospitals only 358 8.8 68.2 Firms only 250 6.1 74.3 Universities + Hospitals 618 15.2 89.5 Universities + Firms 222 5.4 94.9 Hospitals + Firms 59 1.4 96.4
Universities + Hospitals + Firms 147 3.6 100.0
21
Another important dimension of a network is its extension in a geographic sense, therefore the geographic position of collaborators.
We distinguished among three different kinds of location of co-authors: the same region as the given firm, another Italian region and another country.
The result is that 32% of publications have at least one institutional partner belonging to the same region of the firm; 46.5% have at least one partner belonging to a different Italian region; and 31.1% have at least one foreign institutional collaborator.
Even regarding the territorial dimension of the network the contemporary presence of partners from different distances is of course possible. Therefore, it may be interesting to classify the papers according to the maximum extent of the network of co-authors: 16.1% of papers show an extension limited to the regional dimension (the firm has only collaborators in the same region), while 36.3% of papers are created by networks of national extension (regional or extra-regional collaborators) and 31.1% by networks of international dimension. Table 3 shows the frequency of the different combinations of the three considered territorial dimensions.
Table 3 - Collaboration networks – geographical extent
Geographical extent Number of
Articles Share (%) Cumulative Share (%) No collaborators 674 16.5 16.5 Regional only 656 16.1 32.6 Extra-regional only 1079 26.5 59.1 Foreign only 700 17.2 76.3 Regional + Extra-Regional 400 9.8 86.1 Extra-Regional + Foreign 317 l8.0 93.9 Regional + Foreign 150 3.7 97.6
Regional + Extra-Regional + Foreign 99 2.4 100,0
It is interesting to observe that the mono-dimensional structure of the networks (only regional or only extra-regional or only international co-authors) prevails (59.8% of the papers), although a bi-dimensional structure is not rare (21.3%), while a three-dimensional structure of the network is less frequent (2.4% of the cases).
Focusing on international collaborations, we observe that, among the 1267 papers that include an international partner, 566 (44.7%) also have a local (regional or national) partner: this suggests that a sort of “bridge” might be needed to reach international collaboration.
Considering both institutional and geographical aspects of collaboration networks, a number of interesting observations emerge.
In particular, collaborations with universities and hospitals are predominantly within the national boundaries while collaborations between firms have a more international orientation. Often firms collaborating with other firms located abroad are subsidiaries to the firm located abroad.
We try now to go more in depth with the analysis, looking for a further characteristic of the collaboration networks, its “density”, that is the number of collaborators, relating it with the institutional and geographical dimension.
Table 4 reports the average number of collaborators related to the different kinds of institutional networks. As it is obvious, the average number of authors is higher for three-dimensional networks and lower for mono-dimensional ones. It is interesting to observe the higher average number of co-authors when hospitals are included in the networks: it is possible to think that firms and universities, beyond the reasons that push theme to cooperate with other institutions, maintain some reasons to limit the network dimension (firms have the typical reasons to not diffuse too much their knowledge, because of “rivalry” matters; as regards universities, each research group belonging to a department may feel itself to have enough knowledge to conduct the research).
23
Table 4 - Average number of collaborating institutions for each institutional mix of the network Collaborating institutions Mean Std. Deviation Number of Articles No collaboration 1.00 0.00 674 Universities only 2.80 1.06 1748 Hospitals only 3.14 2.03 358 Firms only 2.52 0.95 250 Universities + Hospitals 5.20 6.30 618 Universities + Firms 3.99 1.29 222 Hospitals + Firms 3.83 1.16 59
Universities + Hospitals + Firms 7.06 3.60 147
Total 3.11 3.09 4076
As regards the relationship between “density” and the geographical nature of the network, Table 5 shows that international networks does not exceed national ones as number of components, except for networks that involve all three dimensions (regional, extra-regional and international).
Table 5 - Average number of collaborating institutions for geographical extent
Geographical extent Mean Std. Deviation Number of
Articles No collaborators 1.00 0.00 674 Regional only 2.61 0.94 656 Extra-regional only 2.97 1.33 1079 Foreign only 3.05 1.54 700 Regional + Extra-Regional 5.57 7.62 400 Extra-Regional + Foreign 4.45 2.19 317 Regional + Foreign 4.20 1.89 150 Regional + Extra-Regional + Foreign 6.88 4.40 99 Total 3,11 3.09 4075
5.2 The determinants of research quality
We examined the structure of collaboration networks in the previous section, we now turn to analyse the effect of the network structure on the quality of the published article.
As it is usually done, we considered the number of citations received by an article as an indicator of the quality of that article; the impact factor of the journal where the article is published is another largely used proxy (this indicator is computed using the average number of citations an article published on that journal receives in a certain period of time, called “citation window”). We preferred the number of citation of each article, since it is a more direct indicator of the quality of the scientific output and of the specific papers we have in the database.
We previously mentioned that there might be various reasons why firms publish and several reasons why firms collaborate in publications: the goal to improve the quality of research beyond the quality a firm may obtain alone is certainly prominent. Therefore in this section we try to assess whether the structure of the collaboration network and the kind of co-authorships may affect the quality of publications, therefore the quality of research. Our expectations are based on the “new economics of science” literature (Dasgupta and David, 1994) and to more recent empirical studies such as Kumaramangalam (2005) on the biotech sector. From this literature we may infer that the quality of a paper may be increased by:
- more numerous and diversified collaboration network (from both an institutional and a geographical points of view): increasing the number of co-authors means not only increasing the number of intellectual contributions but also increasing the circulation of knowledge of different “quality”, and it is particularly true if authors belong to different institutions.
- the presence of universities in co-authorships networks: academia is the place devoted to high quality and basic research,
25
therefore we may expect that most important and seminal results derive from networks that include universities4 ;
- the presence of international partners: we assume that firms look for collaborations abroad when they cannot find adequate national competencies; therefore, international collaboration is of high quality. In addition, international collaborators may bring not only “more” knowledge but also “different” knowledge in terms of mentality, lines of research, etc.
We also expect that the number of citations increases with the number of authors, but this does not depend only on the fact that many authors may ensure a larger contribution in terms of knowledge, but also on the phenomenon of self-citations, whose importance obviously tends to increase with the number of authors. Therefore, as we did not exclude self-citations from the total number of citations, we cannot distinguish the two effects (“quality effect” and “self-citation effect”) if we find a positive correlation between the number of authors and the number of citations. For the same reason, when we are studying the relationship between publications quality and other variables than the number of authors, we have to isolate the “self-citation effect”, controlling for the number of authors.
Citations present a very dispersed distribution: 25.2% of the papers did not receive any citation, but 1.6% of the papers received more than 100 citations. In fact, the mean of this variable (11.3) is very far from median (4): summing up, there are many papers that receive no or a few citations and a few papers that receive a lot of citations.
The number of citations received by a single paper tends obviously to increase with years: more recent papers have had less time to be cited. This is the reason why, studying the determinants of
4
The traditional distinction between basic and applied research is not straight forward to make in the biotech sector. However, we expect that academic personnel is more interested in basic research and we assume that basic research may have a higher influence on subsequent research, because it may open more diversified ways than applied research.
citations, we need to “control” in some way for years. Gittelman (2005) standardises the number of citations, substituting the number of citations an article received with the difference between that number and the mean of citations received by all the articles published that year; Kumaramangalam (2005) builds dummy variables for each year in his database. We use the first technique for bivariate analysis, the second one for multivariate analysis.5
a) Bivariate analysis
It was easy to forecast a correlation between the number of standardised citations and the number of authors, because of the two effects described above (quality and self-citations effect): the correlation is positive (0.150) and significant at 1% level. Therefore, in order to “control” for the self-citation effect, we divided the number of standardised citations by the number of authors. In what follows, we talk about “citations” but we refer to this variable (standardised citations/number of authors).
As expected, citations are positively (0.05) and significantly (at 1%) correlated with the number of institutions collaborating on the article: the low number of citations received by the papers published without collaborations is particularly striking.
Moreover, more diversified networks of research produce more cited papers: with the remarkable exception of papers published by only two or more firms together, which receive a high number of citations, and the opposite case of papers published by hospitals and firms together, which receive on average a few citations, the average number of citations is higher when networks are mixed (universities and hospitals; universities and firms; universities, hospitals and firms). This effect is less evident with respect to the geographical dimension of papers: the important effect seem to be the presence of an international partner, with or without other co-authors from the same region or outside the region of the firm.6
5
Multivariate analyses fit much better with dummy variables. 6
To make this analysis, we further divided the variable “standardised number of citation/number of authors” (average citations) by the number
27
As regards the presence of universities in the networks, we observe a positive (0.067) correlation (significant at 1%) between citations and the number of universities included in the network; more generally, papers where one or more universities collaborate receive more citations than other papers. Therefore, as expected, collaborating with universities increases the quality of publication. Less expected is the fact that the presence of one or more firm in the network of collaborators increase the number of citations, with a strength similar to the presence of a university (the correlation between citations and the number of firms in the networks is 0.051, significant at 1%). A possible interpretation is that the collaboration of the Italian division with the research center in the head quarters or other locations of the large, international firm increases the quality of its research.
With respect to the geographical extent of collaboration, the analysis of correlation between the citations variable and the number of regional/extra-regional/international partners reveals that the presence of one or more international partners increases the number of citations,
Trying to consider together the institutional and geographical aspect of collaboration and their relationship with publications quality, we consider the nine variables obtained crossing the three kind of institutions (universities, hospitals and firms) and the three geographical dimensions (regional, extra-regional and international). The correlation between citations and international universities and firms is positive and significant at 1% (respectively 0.069 and 0.072). Controlling for the number of institutions7 included in the network, the correlation between citations and regional and extra-regional firms is positive and significant at 5%.
of institution, in order to avoid that the number of citation increases with the variety of institutional network only because of the higher number of institutions (on average, networks with two kinds of institutions are larger than network with one only type of institution). All the results in this paragraph hold when we consider this more complex variable.
7
b) Multivariate analysis
A multivariate analysis allows to separate the different effects mentioned in the previous section.
We therefore conducted a regression analysis. The number of citations is far from being normally distributed. In addition, the number of citation is not a discrete variable. Hence the use of traditional linear regression techniques do not appear to be appropriate. We choose the technique of binomial logit, dividing the number of citations in two, above and below the median. Being citations count data, the proper technique should appear a negative binomial regression (see e.g. Kumaramangalam, 2005). However, we think that the number of citations is only a proxy for quality and there is no exact proportionality between the number of citations received and the quality of a paper. For instance, it is difficult to say if a paper that received 6 citation is “better” than a paper that received 5 citations, but it is certainly more likely that a paper that received a number of citations included in the first half of citations distributions (e.g. 10) is “better” than a paper with a number of citations included in the second half (e.g. 2). In fact the goodness of fit for the binomial logit was better, for all the models we considered, than the goodness of fit for negative binomial regression. The binomial logit also gave better results than ordered logit and probit, with citations divided in quartiles.
Our dependent variable is the number of citations received by the paper; we controlled for the years of publications, including year dummies, and for the number of authors. We tried to test all the effects previously mentioned, in several alternative models of multivariate analysis. We present here what we consider the more interesting model (it has a restricted and an augmented version) because of its goodness of fit and because it allows to test simultaneously several interesting effects in a statistically significant way.
The model tests the effects of both the institutional and the geographical dimensions of the networks on the number of citations received by each article (variable CIT). Besides the
29
control variables (number of authors, AUT, and year dummies, YEARDUM), the covariates are the nine variables obtained crossing the three kind of institutions (universities, hospitals and firms) and the three geographical dimensions (regional, extra-regional and international); so we have as independent variables the number of regional, extra-regional, international universities (respectively UNIREG, UNIITA, UNIINT); regional, extraregional, international hospitals and other non-academic research institutions (respectively HREG, HITA, HINT) and the number of regional, extraregional, international firms (respectively FIRMREG, FIRMITA, FIRMINT). We also explicitly take into consideration the variety of networks, on both an institutional and geographical point of view: the dummy variable MIXINST assumes value 1 if the paper is written by authors belonging to the three different kinds of institutions (universities, hospitals and firms), 0 otherwise; the dummy variable MIXGEO assumes value 1 if the paper is written by authors belonging to the three different geographic locations (regional, extraregional, international), 0 otherwise.
Restricted model Logit YEARDUM MIXGEO MIXINST FIRMINT FIRMITA FIRMREG HINT HITA HREG UNIINT UNIITA UNIREG AUT CITit 13 12 11 10 9 8 7 6 5 4 3 2 1 , β β β β β β β β β β β β β α + + + + + + + + + + + + + + =
Given the variety of firms in our database, it seems appropriate to control for firm characteristics, which we do including firm dummies in the model (FIRMDUM). Thus we get the augmented model:
Augmented model Logit FIRMDUM YEARDUM MIXGEO MIXINST FIRMINT FIRMITA FIRMREG HINT HITA HREG UNIINT UNIITA UNIREG AUT CITit 14 13 12 11 10 9 8 7 6 5 4 3 2 1 , β β β β β β β β β β β β β β α + + + + + + + + + + + + + + + =
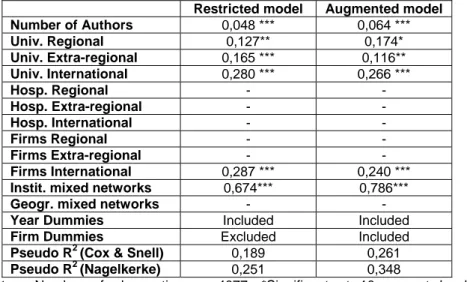
Table 6 shows the results for the estimation of the two versions of the model with binary logit. Only significant (at least at 10%) parameters are reported.8
The two versions of the model show that the number of citations increases with the number of universities, wherever they are located, but the effect is particularly strong if they are foreign universities; the number of firms included in the co-authorship networks also increases the number of citations, but only if they are foreign firms.
Being the number of the authors, the number and the kind of institutions constant, the estimation shows that institutionally mixed networks imply an higher quality of the papers, while if the network is mixed on a geographic point of view, this does not significantly increase the probability to have more citations.
The augmented version of the model shows that the presence of firm dummies significantly increases the goodness of fit. Firm characteristics therefore influence the quality of research. In the next section we examine the effects of firm dimension.
8
The restricted version of the models has also been estimated using negative binomial regression, ordered logit and probit. Results are similar in terms of significant covariates: all the significant covariates with binomial logit model are also significant with the other techniques.
31
Table 6 - Summary of Results of Econometric Estimates – Binary logit
Restricted model Augmented model
Number of Authors 0,048 *** 0,064 *** Univ. Regional 0,127** 0,174* Univ. Extra-regional 0,165 *** 0,116** Univ. International 0,280 *** 0,266 *** Hosp. Regional - - Hosp. Extra-regional - - Hosp. International - - Firms Regional - - Firms Extra-regional - - Firms International 0,287 *** 0,240 ***
Instit. mixed networks 0,674*** 0,786***
Geogr. mixed networks - -
Year Dummies Included Included
Firm Dummies Excluded Included
Pseudo R2 (Cox & Snell) 0,189 0,261
Pseudo R2 (Nagelkerke) 0,251 0,348
Notes: Number of observations = 4077; *Significant at 10 percent level;
**Significant at 5 percent level; ***Significant at 1 percent level;
Dependent variable = quality of research (citations) = 0 (if cit. < 5); 1 (if cit. > 5)
5.3 Looking ahead: including firm’s data in the analysis
Generally the studies we found on scientific publications did not include data on firms’ characteristics. We have this kind of data and we use them in this paper in order to consider the effects of firm size. We used sales revenue and the number of employees as proxies for firm size.
This data cover the period 1997-2005 for sales revenue (285 firms) and the period 2001-2005 for the number of employees (213 firms).
Collaboration with research institutions or with other firms increases the knowledge stock of a single firm. For small firms this is a mean to capture external knowledge, that they need because of the scarcity of means to produce it internally. Larger firms however may have the adequate financial means to activate collaborations and develop the absorptive capacity necessary to use external knowledge (Cohen and Levinthal, 1989). Therefore
small firms may have the need but not the material and intellectual means to activate frequent collaborations. Some empirical studies confirm that larger firms have a higher degree of “openness” (e.g. Fontana, Geuna, Matt, 2003).
Therefore the first hypothesis we verified is that larger firms have a higher propensity to publish than smaller ones.9.
We found that 126 out of these 285 firms included in AIDA database (44.2%) have at least one publication during the period 1997-200510.
If we make a comparison between firms that have at least one publication during the period and firms that do not have any, we can observe that the size of publishing firms is, on average, larger than for non-publishing ones.
More precisely, publishing firms have 387.1 employees on average, non-publishing firms have on average 153.3 employees. The difference is significant at 10%. Sales data reveal interesting results as well: the difference between the average value of sales of publishing and non-publishing firms is very high and amounts to € 59,960 thousands.
Considering the average number of publication per year confirms this result.
9
Because of several missing data for individual years in AIDA database, we decided to perform a cross-section analysis: we investigated the relationship between the average dimension of the firm during the period fully covered by AIDA and ISI databases (1997-2005) and the quantity and quality of publication during the same period. Because of some computational difficulties, arising from the lack of data, we calculated for each firm the central value of number of employees and sales (the average between the maximum and the minimum value) We observe that the two variables (central value of number of employees and central value of sales) are strongly correlated (0.847 Pearson-correlation, significant at 1%).
10
Publishing firms are therefore a bit under-represented in AIDA database, because in the national database there are 205 firms with at least one publication (the total number of firm included in RP biotech Database is 371, therefore the percentage is 55,2%).
33
As regards the relationship between firm size and the quality of publications, we may identify a “resource effect” and an “efficiency effect”.
According to the “resource effect”, large firms have more financial resources to dedicate to research and this may increase the probability to obtain important results. This may happen because more financial means assure greater internal laboratories, better instrumentation, larger researcher teams, etc.; besides, larger financial resources and the fact that large firms often have seats and laboratories in several places may be the reason why they are able to activate larger and more diversified research networks: as our analysis confirms, a greater number of collaborators, international and diversified research networks mean an increase in the number of knowledge sources, then in the probability to produce high quality research. Therefore we may distinguish between a “direct resource effect” (larger firms have greater internal research means and this increases the quality of research) and an “indirect resource effect” (larger firms activate larger networks and this generate better research).
On the other side we can assume that, even if smaller firms have a lower propensity to publish, those small firms that decide to publish a scientific article do that only when the article has a high scientific value11. In other words, it could be reasonable to think that small firms, especially in a very dynamic and innovative sector like biotechnology, can be more efficient in the production of scientific and basic knowledge than large firm: this is what we call the “efficiency effect”.
11
This could be consistent with the theory of knowledge disclosure expressed for example in Penin (2005), according to which publishing is a way of signalling firms quality to other firms and to the financial market, mainly to gain reputation. This is a more important for small new firms than for large established ones, which can publish their research for other reasons, with a lower interest on producing highly-cited works.
As the “resources effect” and the “efficiency effect” go to apposite directions, the overall effect needs to be verified. Gittleman (2005) shows the positive effect of firm size on the quality of research. In any case, estimations we made should be considered as preliminary attempts, as we need to implement our database about firm characteristics.
We did not find any significant correlation between firm size and quality of publications. More precisely, taking into account the number of employees as a proxy for firm size, we found that the best performance in terms of quality of publications is made by the largest firms (more than 250 employees) and by the small (but not micro) firms (from 10 to 49 employees). In the light of our theoretical framework we can say that the “resource effect” is prominent for very large firms, while the “efficiency effect” is important for firms that are small, but not below a threshold that would limit their resources too much. Another remarkable result emerging from our analysis is that the “indirect resource effect” is almost absent: on average there are not significant differences between width, extension and variety of networks activated by firms of different size. The only sign going towards the direction of a confirm of this effect is the higher degree of collaboration between larger firms: there is a positive (0.100) and significant (at 1%) correlation between firm size and the number of co-authoring foreign firms, maybe due to the fact that larger firms in the sample are multinational companies12.
12
A more detailed analysis can show that in many cases large firms collaborate with plants or laboratories of foreign affiliates.
35 Conclusions
In this paper, we analyse the relationships between firms and universities using data on firms’ publications in scientific journals. Among all channels through which the relationships between universities and firms are built, joint scientific publications appear to be an important but yet little explored one, especially with respect to Italy. We provide evidence on the determinants of firms’ publishing behaviour and on the quality of research in the case of the biotechnology sector in Italy.
In order to study these issues, we built a database of all scientific publications of Italian biotechnology firms over the period 1990 to 2006.
The phenomenon of corporate publications involves less than half the health-biotech Italian firms, although the number of firm publications is clearly increasing.
8 publications out of 10 derive from collaborations or at least they result as published by the firm with another institution, and the collaboration trend is increasing over time. Universities appear as the privileged partners; collaborations among firms are less frequent but, when they happen, international collaborations are privileged. In almost one third of the published papers an international partner is involved; in almost half of these cases the network is multidimensional, also involving national partners. The dimension and the institutional and geographic characteristics of the co-authoring networks have an effect on publication quality: an higher number of institutions whom authors belong to increases the number of citations received by the papers; this effect is particularly important when authors belong to universities and to international firms; the variety of the research networks (authors belonging to institutions of different nature) also tends to increase the quality of the papers.
Firms’ characteristics appear to be an important factor to take into consideration in the study of corporate publishing. We collected data on firm size from 1997 to 2006, in order to confront them with the data on publications. Our preliminary study regarding firm size
reveals that larger firms publish more, but the quality of research done, therefore the quality of papers published, by several small (but not micro) firms is at least comparable with the results of larger firms. This may be evidence of the presence of small, dynamic biotech firms as in the USA.
The Italian biotech sector appears therefore to be characterised by the presence of some very dynamic small firms that collaborate abroad and publish high quality articles. Government support to innovation may therefore be usefully directed at these firms, to help them to grow in particular. Further analysis of the characteristics of the publishing firms in the Italian biotech sector will help us to shed further insights on this issue.
37 References
Arora A., Gambardella A. (1994), ”Evaluating technological information and utilizing it. Scientific knowledge, technological capability and external linkages in biotechnology”, Journal of
Economic Behavior and Organization, 24 (1), giugno,
pp.91-114.
Arrow K. (1962), “Economic Welfare and the Allocation of Resources for Invention”, in Nelson R. (ed.), The Rate and
Direction of Inventive Activity, Princeton Unversity Press,
Princeton, 609-19.
Arundel A. and Geuna A. (2004), Prosimity and the Use of Public Science by Innovative European Firms, in Economics of Innovation and New Technology
Cockburn I.M. (2005), “Blurred boundaries: tensions between open scientific resources and commercial exploitation of knowledge in biomedical research”, prepared for the Advancing
Knowledge and Knowledge Economy conference, 10-11
January 2005, Washington DC.
Cockburn I.M. and Henderson R.M. (1998), “Absorptive capacity, coauthoring behaviour and the organisation of research in drug discovery”, The Journal of Industrial
Economics, XLVI(2), 157-82.
Cohen W. (1995), in Stoneman P. (ed.), Handbook of the
Economics of Innovation and Technological Change.
Cohen W. and Levinthal D. (1990), “Asorptive Capacity: A New Perspective of Learning and Innovation”, Administrative Science
Quarterly, 35, 128-52.
Cohen W., Nelson R. and Walsh J.P. (2002), “Links and Impact: the Influence of Public Research on Industrial R&D,
D’Amore R., Vittoria M.P. (2006), “Le Biotecnologie in Italia. Ricerca per la costruzione di un Data Base generico per le analisi di settore e di un Repertorio per le policy”, Quaderno di ricerca del Dipartimento di Scienze Economiche e Statistiche dell’Università di Salerno, n.23, ottobre 2006.
Dasgupta P. and David P. (1994), “Towards a New Economy of Science”, Research Policy, 23, 487-521.
Etzkowitz H. and Leydesdorf L. (eds.) (1997), Universities in
the Global Economy: a Triple Helix of University-Industry-Government Relations, London: Cassell Academic.
Etzkowitz H., Webster A., Gebbhart C., Cantisano Terra B.R. (2000), “The future of the university and the university of the future: evolution of ivory tower to entrepreneurial paradigm”,
Research Policy, 29, 313-30.
Feldman M.P. (1994), “The University and Economic Development: The Case of John Hopkind University and Baltimore”, The Economic Development Quaterly, 8: 67-77. Fontana R., Geuna A. e Matt M. (2004), “Firm Size and Openess: the driving forces of university-industry collaboration”, in Calighorou Y., Constantelou N., Vonortas N. (eds.), Knowledge in the European Industry: Mechanisms and
Policy Implications, Routledge.
Freeman C. (1987), Technology Policy and Economic
Performance: Lessons from Japan, London: Frances Pinter.
Gittelman M. (2005), “What makes research socially useful? Complementarities between in-house research and firm-university collaboration in biotechnology”, Revue d’Economie
Industrielle, 110(2), 57-73.
Gittelman M. and Kogut B. (2002), “Does Good Science Lead to Valuable Knowledge? Biotechnology Firms and the
39
Evolutionary Logic of Citations Patterns”, Management
Science, 49(4), 336.
Hicks D. (1995), “Published papers, tacit competencies and corporate management of the public/private character of knowledge”, Industrial and Corporate Change, 4(2), 401-24. Katz S. and Hicks D. (1998), “Indicators for Systems of Innovation – A Bibliometric-based Approach”, IDEA Paper Series, University of Sussex, Brighton.
Katz S. and Martin B. (1997), “What is Research Collaboration?”, Research Policy, 26(1), 1-18.
Kline S. and Rosenberg N. (1986), “An Overview of Innovation”, in R. Landau and N. Rosenberg N. (1986), The
positive Sum Strategy, Washington DC: National Academy
Press.
Kumaramangalam K. (2005), “Does collaborating with academia improve industry science? Evidence from the UK biotechnology sector, 1988-2001”, Aslib Proceedings: New
Information Perspectives, 57(3), 261-77.
Lundvall B. (1992), National Systems of Innovation: Towards a
Theory of Innovation and Interactive Learning, London: Pinter.
Malerba F. (2004), “Sectoral Systems of Innovation and Production”, Research Policy, 31, 247-264.
McMillan et al., Narin F., Deeds DL (2000), “An Analysis of the Critical Role of Public Science in Innovation: the Case of Biotechnology”, Research Policy, 29, 1-8.
Meyer-Krahmer F. and Schmoch U. (1998), “Science-based Technologies: University-Industry Interactions in Four Fields,
Mohnen P. and Hoareau C. (2002), What type of enterprise forges close links with universities and government labs? Evidence form CIS II, MERIT-Infonomics Research Memorandum Series.
Nelson R. (ed.) (1993), National Systems of Innovation: a
Comparative Analysis, Oxford: Oxford University Press.
Nelson R. (1990), “US Technological Leadership: Where did it come from and where did it go?”, Research policy, 19, 117-32. Pavitt K. (1998), “Technologies, product and innovation in the innovating firm: what Adam Smith tells us and Joseph Schumpeter does not”, Industrial and Corporate Change, 7(5), 433-52.
Rosenberg N. (1990), “Why do Firms do Basic Research (with their own money)?”, Research Policy, 19(2), 165-74.
Schartinger D., Schibany A., Gassler H. (2001), “Interactive Relations between Universities and Firms: Empirical Evidence for Austria”, Journal of Technology Transfer, 26, 255-69.
Stern S. (1999), “Do Scientists Pay to be Sicentists?”, NBER Working Paper n. 7410.
Von Hippel E. (1998), “Economics of Product Development by Users: the Impact of Sticky Local Information”, Management Science, 5.
Zucker G.L., Darby M.R. and Brewer M. (1998), “Intellectual Capital and the Birth of US Biotechnology Enterprises”,