Bioreactor Platform for in
vitro Experiments
PhD Thesis
PhD course on Automatic, Robotics and Bioengineering
XXII (2007-2009)
SSD: ING-IND/34, ING-INF/06
Student: Daniele Mazzei
Supervisor: Prof. Arti Ahluwalia
University of Pisa
Interdepartmental Research Center ”E.Piaggio” Pisa February 28, 2010
In-vitro cell cultures are a fundamental step in preclinical drug test-ing and are of great interest to the pharmaceutical industry. The most common method for culturing cells is in cell culture incuba-tors. These are large and cumbersome and all mechanical stimuli are absent. They are nevertheless used ubiquitously and their results quoted as “standards” of in-vitro protocols. Several alternative cul-ture methods have been proposed, and many systems are currently available commercially. Indeed, systems and devices for maintain-ing cells and tissues in controlled physical conditions, or bioreactors, have become an important tool in many areas of research. This is not only due to the growing interest in tissue engineering but also because it is now being increasingly recognised that cells respond not only to their biochemical, but also to their physical environ-ment, and both cues are necessary to create a biomimetic habitat. However most bioreactors for cell culture and tissue engineering are cumbersome and only provide a few cues such as flow or strain, al-lowing limited control and flexibility.
Since drug testing involves a large number of tests on identical cell cultures, a single well culture is inadequate and costly both in
time and money. The “High Throughput Screening” (HTS), is a methodology for scientific experimentation widely used in drug dis-covery, based on a brute-force approach to collect a large amount of experimental data in less time and using less animals. The par-allel nature of HTS makes it possible to collect a large amount of data from a small number of experiments and in a very short time. HTS, however, suffers from a significant problem that may affect the relevance of tests: the environment discrepancy problem. Another problem related with the actual drug testing and tissue engineer-ing experiments is the enormous number of animals that have to be scarified every year.
The aim of this study was to develop a generic platform or SUITE (Supervising Unit for In-vitro TEsting) for cell, tissue and organ cul-ture composed of two main components: a universal control unit and an array of bioreactor chambers. The platform provides a biomimetic habitat to cells and tissues since the environment in the chambers is controlled and regulated to provide biomechanical and biophysical stimuli similar to those found in-vivo. In this work I describe how a new concept of cell culture bioreactor was developed by integrating different technologies and research fields. The data extracted using this new cell culture approach is more predictive of the in vivo re-sponse with respect to the multi-well approach, particularly for drug related studies.
The starting point was a thorough analysis of currently used in-vitro methods; their pros and cons were assessed to exploit their ad-vantages and overcome or circumvent their disadad-vantages. As far as the culture chamber is concerned, the approach was to use the meth-ods and materials commonly employed in microfluidic fabrication,
but at scales compatible with classical culture systems such as petri-dishes and multiwells. This renders the bioreactors more amenable to use by biologists and enables the use of cell densities comparable with classic systems as well as the use of conventional assaying tech-niques. In most cases, the cell culture chambers are thus made out of PDMS (Polydimethylsiloxane), using soft-moulding with micro-or mini-machined masters, micro-or what we call “Soft Milli-molding”. A “system on a plate” Multi Compartmental Modular Bioreactor (MCmB) was developed using this technology. The MCmB is a mod-ular chamber for high throughput multi compartmental bioreactor experiments. It is designed to be used in a wide range of applica-tions and with various cell types. A precise stimulus application is also very important to better understand the correlation between physical variables and pathologies allowing a more accurate study of the tissue physiology and pathologies. For this reason in these thesis three additional stimulation chambers for vascular and articu-lar cartilage stimulation respectively were also designed and tested. The control system was developed to be user-friendly, flexible and expandable to include new stimuli and was based on modular compo-nents, including motors and sensors. Importantly a single software interface was designed to allow data acquisition and monitoring of several chambers in series or in parallel.
Using SUITE, high throughput experiments can be performed in an in vivo-like simulated environment for a long time to simulate different physiological or pathological scenarios or for toxicity testing of cells, tissues or in-vitro organ models.
A PhD is a three years long adventure and it is very difficult to re-member all the people that have helped you to won this “race”. The first person that I have to thank is the Prof. Arti Ahluwalia, my fortunately “not bossy” boss. She has been not a supervisor but a real tutor and her help has been pivotal not only for this thesis but also for my own growing process. Arti is the head of the fantastic team that I have had the luck to join. My team has not a real name but in the last few months we called it MCB Team, without knowing the real means of this acronym. All the members of this team help me so much during the past three years, but some of them has been very important for me. Giovanni usually disagrees with me on al-most everything, but this is one of the al-most stimulating part of our friendship and it pushed me to investigate the rightness of my ideas. Carmelo is our “models man”; he requires a FEM model for every-thing (also for approaching women), and he approaches problems in a totally opposite way of me, that’s why I learned from Carmelo a lot of things and I have to thanks him for his helpfulness. During this year I have met and joined also another team: the CVS lab team from the Pisa computer science department headed by
Anto-nio Cisternino. AntoAnto-nio has been for me a tutor and a real friend: in one word ”The master”. This nickname comes obviously from Star Wars, but to think about Antonio as the wise is not exactly what I mean: he is the one who always knows the solution. . . But you have to be able to find it in the meta explanation that he gives you!
At the computer science department i have also met Vincenzo Gervasi.before knowing him, i used to think that the human mind had limits! He knows everything!!! He is the one who made me write this thesis in Latex, assuring me that in case of any problems i could call him (I called him so many times). Another person who helped me during this process was Gualtiero Fantoni. I met Gualtiero by chance in a caf´e and that’s where we and another great guy started to build the Lening Lab. Gualtiero showed me how to “build” some-thing that would have last more than one hour and how to convert an idea into a product. All that helped me to build this thesis into a real commercial product.
Since now I have spoken of collaborators who have turned into friends, but during this adventure I have found all the commitment i needed also from lots of friends, all very important to me. One in particular: the “Omo Nero”. He is who define the word “friend”. We live thousands of kilometers far away but once a month my Skype window blinks and I can read on it something like: “Mi svuvvia il capo” or “isvuvvi pijaije aneba” . . . This is enough to change my mood, giving me the strenght to go ahead.
This PhD made me travel around Europe and I spent almost six months in UK where I have worked at the Sheffield Dental School. Here I have found a fantastic team, always ready to help this funny Italian guy who didn’t know how to speak english. When I went in
UK the first time I was able to speak only “by my hands” and they helped me with everything!
In UK I have also met other two special persons: Malcolm and Linda Wilkinson. Malcolm and Linda are the managers of Kirkstall, the UK company that commercializes the products developed during my PhD. Between us there is not just a commercial or professional relationship: they “adopted me”, allowing me to spend months with them learning not only English but also British traditions and her-itage. They definitely made me change my mind about the “cold” Britons.
Finally this work HAS to be dedicated to the one who made all this possible, pushing me to become what I am now. . . George Lu-cas!! I am joking. . . I wish to dedicate it to my parents and everyone who loves me.
Daniele
Abstract iii
Introduction 1
1 Environmental Control 13
1.1 Materials and Methods . . . 14
1.1.1 The Bioreactor Hardware . . . 14
1.1.2 The Control System . . . 25
1.2 Environmental Control Test . . . 36
2 P.GIO Pressure Generator of In-vivO environments 43 2.1 Material and Methods . . . 44
2.1.1 The P.GIO Hardware . . . 44
2.1.2 The P.GIO Control Software . . . 52
2.2 P.GIO Controller Tests and Results . . . 56
2.2.1 DC motor tests and results . . . 56
2.2.2 Stepper motor tests and results . . . 57
3 MCmB (Multi Compartmental modular Bioreactor) cham-ber design 61 3.1 Material and methods . . . 65
3.1.1 Mass transport and flow modeling . . . 65
3.1.2 Chamber Fabrication . . . 71
3.1.3 Design Improvements: MCmB 2.0 . . . 73
3.1.4 Modular Mould Design . . . 76
3.2 MCmB 2.0 design validation . . . 79
3.2.1 Oxygen Consumption and Shear stress in the MCmB 2.0 . . . 79
3.2.2 Bubble and Turbulence Testing . . . 82
4 MCmB 2.0 Cell Testing 85 4.1 Validation of Shear Stress and Oxygen Concentration Models 86 4.1.1 Material and Methods . . . 86
4.1.2 Cell viability and albumin production results . . . 88
4.2 In-vitro Liver Model in the MCmB Bioreactor . . . 89
4.2.1 Material and methods . . . 91
4.2.2 Results of In-vitro Liver Experiments . . . 93
4.3 MCmB Bioreactor Tests with Skeletal and Epithelial Tis-sue Cells . . . 95
4.3.1 Materials and methods . . . 96
4.3.2 Effect of bioreactor conditions on monolayer cell cultures . . . 99
4.3.3 Effect of increasing flow rate on monolayer cultures of a ROS osteoblastic cell line . . . 103
4.3.4 Effect of bioreactor conditions on 3D cultures . . . 104
5 Stimulus Specific Chambers Design and Realization 109 5.1 SQPR SQueeze PRessure stimulation Chamber . . . 109
5.1.1 Material and methods . . . 110
5.1.2 SQPR design and model validation . . . 119
5.2.1 Material and methods . . . 122
5.3 LFC Laminar Flow Chamber . . . 125
6 Cell and Tissue Tests on Stimulus Specific Chambers 131 6.1 SQPR Squeeze Pressure Chamber tests . . . 131
6.1.1 Material and methods . . . 132
6.1.2 Results . . . 134
6.2 VSC Vascular Stimualtion Chamber tests . . . 136
6.2.1 Material and methods . . . 137
6.2.2 Results . . . 139
6.3 LFC Laminar Flow Chamber tests . . . 140
6.3.1 Materials and methods . . . 140
6.3.2 Results . . . 141
7 Conclusions 145
A Appendix 151
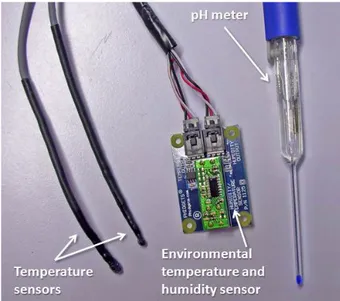
1.1 a) The mixing chamber filled with medium and with the pH meter placed in. b) The pH meter tip (blue) in the mixing chamber’s dedicated notch. . . 16 1.2 The bioreactor external sensors: the two temperature
sen-sors probe, the environmental temperature and humidity sensor and the pH meter. . . 18
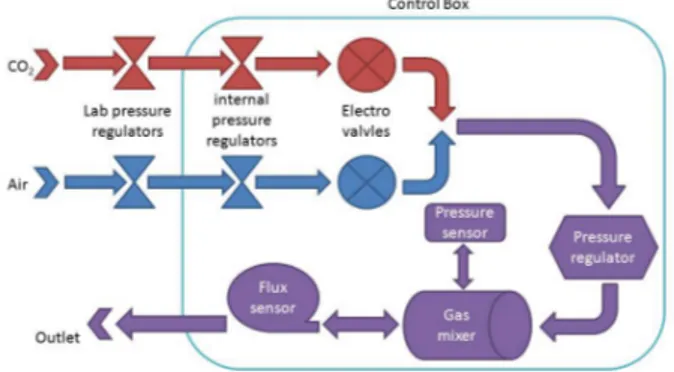
1.3 Schematic connections of the pressure and gas regulation
system. . . 19
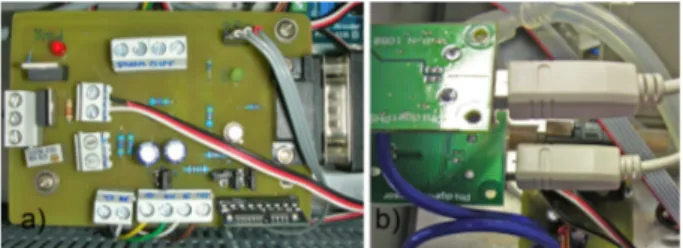
1.4 a) The Serial to PWM board plugged to the USB RS232
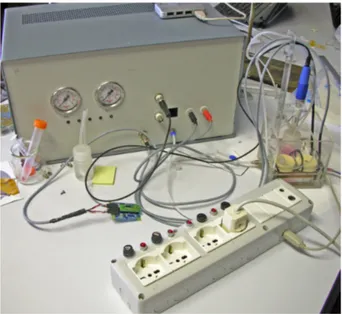
converter and b) the Phidgets pH readers. . . 20 1.5 The Bioreactor control unit, the heating box and the 220V
sockets unit during an experiment. . . 21
1.6 The heating box and other bioreactor components during
an experiment setup. . . 23
1.7 A) The Control box with all the sensors plugged in and
the heating box during an experiment. B) Detail of the mixing chamber in the heating box with the pH meter tip and the temperature sensors. C) The pH meter insertion phase. . . 24
1.8 Schematic flowchart of the entire Bioreactor system; in green are the electronic control units and connections, in red the culture chambers and the medium circuit, the gas connections and apparatus are represented in blue and the light red is the heating box unit that contains part of the system. . . 26 1.9 pH control algorithm working zone. . . 30 1.10 Pressure regulator characteristic at different flow rates. . . 33 1.11 The bioreactor control user interface in the view mode (a)
and in the config mode (b). . . 35 1.12 Pressure maintaining test, a profile of three pressure is
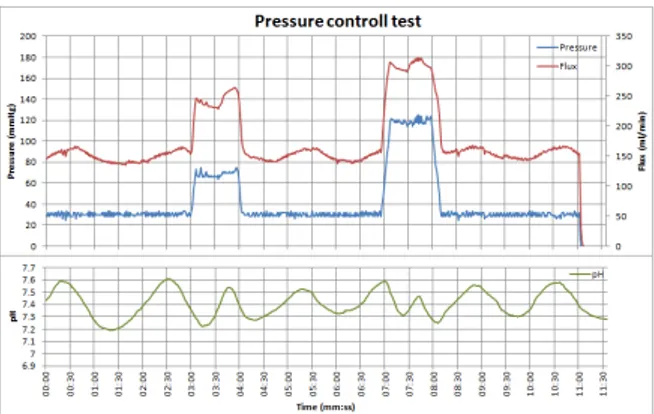
im-posed (30, 90 and 120 mmHg). . . 39 1.13 Pressure control test for pressure profile generation. The
requested path was made of seven pressure steps at 120
mmHg with a base line of 30 mmHg. . . 41
1.14 pH control tests, an acid and base insertion is done in order to test the pH controller capability to react to external stimuli. . . 42
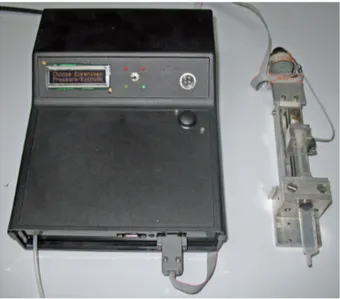
2.1 P.GIO features and connections schema. . . 44
2.2 The P.GIO unit with the SQPR chamber plugged in. . . . 45
2.3 The P.GIO box with all his components. . . 47
2.4 Power supply board schematic. . . 48 2.5 The P.GIO interface board equipped with the motor drivers
during the assembly phase. . . 49
2.6 a) The easy driver connection scheme and b) the
Easy-Driver V3 board. . . 51
2.7 The P.GIO system connected to the hydrostatic pressure
3.1 The FEM model geometry for the first modular bioreactor
chamber. H is the variable height in the range 3-9 mm. . 66
3.2 Theoretical oxygen concentration profile across the biore-actor chamber for different heights H, calculated using Michaelis Menten kinetics and a flow rate of 180 µL/min. The min-imal concentration threshold of 0.04 mol/m3 is indicated by the solid line. . . 69
3.3 FEM model of the H=6 mm MCmB 1.0. a)Velocity and
b)shear stress. The analysis takes into account a 160 µm thick glass cover slip placed on the base of the chamber. . 71
3.4 The two parts of the MCmB 1.0 chamber. The top part
(left) has two holes for the 3 mm silicone tubes insertion, on the bottom part (right) is possible to see the fit system. 72 3.5 a) Bubble formed at the top of the first MCmB 1.0 chamber
, and B) alginate drop used for turbulence tests placed on the bottom half of the chamber. . . 73
3.6 a) dimensions of the new chamber, b) three dimensional
representation of the sloped roof and ridged base, c) MCmB 2.0 Velocity profile, showing stream lines and d) Shear Stress at the base. . . 74
3.7 Design of the modular mould. a) Bioreactor top part
de-sign , b) bioreactor bottom part dede-sign (the bottom is shown with (2) or without (3) oxygenation ridges), c)
Lat-eral and d) top views of a modular mould frame. . . 78
3.8 Modular mould fabrication and testing. In a) and b) the
bottom ridges obtained from the milling process are shown, in c) the mould ready for the silicone casting in d) biore-actor extraction after the curing and cooling phase. . . 80
3.9 a) Oxygen concentration in the MCmB 1.0 for a flow rate of 180 l/min and MCmB 2.0 for a flow rate of 180 and 300 µL/min and b) Oxygen concentration in the MCmB 2.0
for different flow rates between 60 and 500 µL/min. . . . 81
4.1 a) Hepatocyte viability, expressed as the ratio between vi-ability in the MCmB 2.0 and a bioreactor static cultures after 24 hours at different flow rates and b) Rat albumin production after 24 hours in the MCmB 2.0 and in the control. ∗p < 0.05 . . . 90 4.2 In vitro liver experiments organization; every day a
cham-ber from each series is unplugged and analyzed. The three series of seven bioreactors are connected as separated cir-cuits to the peristaltic pump. . . 92 4.3 (a) Cell density (defined as nominalarea(ccellnumber2m) for PLGA
scaf-folds in the bioreactor and in static conditions and (b) Al-bumin production rate in static and dynamic conditions
for PLGA 3-D scaffolds (in both case n=3 per data point). 95
4.4 Assembly of two flow experiments in MCmB 2.0 bioreactor.
In this experiment two MCmB kits were used, in order to run in parallel two experiments with different flow rates. . 97 4.5 Normalized viability of chondrocyte cultures after 24h in
MCmB 2.0 at different flow rates. Graphs a and b show how the flow rate influences cell viability and how fibroblast cultures with high passage number are unable to support shear stress. . . 101
4.6 Viability comparison at different flow rates for different cell types. The Chondrocyte culture with low passage number are able to support shear stress and have increased viability at 110 µL/min, while high passage number chondrocytes and fibroblasts are not able to support shear stress induced stimulation. . . 103 4.7 Effect of flow rate on viability of monolayer cultures of
ROS osteoblasts. . . 104 4.8 Effect of a 72h culture period in the bioreactor on construct
cellular activity normalised to construct wet weight at a perfusion rate of 110 µL/min. . . 105 4.9 Effect of 72h bioreactor culture at a perfusion rate of 110
µL/min on proteoglycan medium and matrix accumulation in 14 and 21 day cartilage constructs. . . 107
5.1 a)Pressure and b) Velocity analytical profiles. . . 112
5.2 SQPR FEM model scheme. . . 113
5.3 The SQPR bioreactor parts: a) The Plexiglass chamber
with the stimulation cavity, b) The piston Derlin top part, c) The basic sample bracer, d) The sample bracer with ring, e) The piston shaft and f) The aluminum base (parts are not equally scaled). . . 117
5.4 a) The SQPR stimulation unit assembled and b) The SQPR
5.5 FEM results: Comparison between finite element model of bioreactor (solid line) and analytic model of squeeze pres-sure (Pa) (a) and shear stress (Pa) (c) generation during the approaching (blue) and the retraction (red) phase; Sur-face plot of pressure (b) and shear stress (d) distribution inside the channel and (e) Velocity field in the channel dur-ing the approachdur-ing phase. . . 127 5.6 Schematic diagram of the blood vessel placed in the culture
chamber. . . 128 5.7 Parametric analysis of the bioreactor system as function of
fluid velocity (0.0023 m/s; 0.023 m/s; 0.23 m/s): Reynolds number (surface plot), circumferential stress (contour plot) and radial strain (arrow plot) are shown. All values are in MKS units. . . 128
5.8 a) CAD design of the vascular culture chamber and b) The
Vascular Stimulation chamber during the assembly phase. 129
5.9 VSC and P.GIO connections schema. . . 129
5.10 FEM simulation of the laminar flow bioreactor chamber with a medium flow speed of 0.05 m/s(12 mL/min). . . . 130 5.11 (a) CAD design of the Laminar Flow chambers and (b) the
Laminar Flow Chamber mould. . . 130
6.1 Viability of chondrocyte constructs (1 and 2 mm thick)
after 24 and 48 hours of stimulation in SQPR bioreactor. All the constructs have a viability similar to the control, indicating that the SQPR stimulation does not damage the cell culture. All data are normalised with respect to the control. . . 135
6.2 Concentration of GAGs in medium in static controls and SQPR stimulated constructs (1 (a) and 2 (b) mm thick) after 24 and 48 hours of cyclic contact-less stimulation. . . 137 6.3 Normalized tangential (a) and longitudinal (b) young
mod-ule of vessels after 24h of stimulation in the VSC bioreactor.141 6.4 Histological section of a porcine carotid after 24h in the
VSC bioreactor. . . 142 6.5 (a) Nitric oxide production (µmol/106 cells) after 24 h in
the laminar flow bioreactor chambers with different shear stress and (b) Endothelin production (pg/106 cells) after 24 h in the laminar flow chamber with different shear stress.143
6.6 Cell culture after 24 hours of treatment, we can observe
how the cells have an elliptical shape and are oriented with the medium flow (indicated by the arrow). . . 144
1 Use of animal tests for the year 2001 in UK. . . 4
3.1 Fluid Dynamic FEM model results for a fixed flow rate of
180 µL/min for the first MCmB model as a function of height H. . . 70
3.2 Fluid Dynamic FEM model results for the MCmB 2.0
at two different flow rates, the average height (H) of the MCmB 2.0 is 9.5 mm. . . 75 4.1 Effect of flow rate at different passages in the MCmB 2.0
on the cellular morphology of monolayer cultures of bovine chondrocytes. . . 100 4.2 Effect of flow rate in the MCmB on the cellular morphology
of monolayer cultures of human fibroblasts. . . 102 4.3 Effect of 72h bioreactor culture at a perfusion rate of 110
µL/min on proteoglycan accumulation in 14 and 21 day cartilage constructs. . . 106
6.1 Longitudinal young module and percentage increase post
Cell culture is an essential tool in biological science, clinical science, and biomedical studies. This approach is a fundamental step in preclinical drug testing and for this reason it is of great interest to the pharmaceutical industry to employ cheaper and more ethical systems which can supply accurate and predictive information on the effects of chemicals on the human body.
Since drug testing involves a large number of tests on identical cell cultures, a single well culture is inadequate and costly both in time and money. The “High Throughput Screening” (HTS), is a methodology for scientific experimentation widely used in drug discovery, based on a brute-force approach to collect a large amount of experimental data in less time and using less animals. HTS is achieved nowadays using multi-well equip-ment, to contain the cell cultures subject to treatment [1]. An automatic machine collects data, usually with an optical system, during the treat-ment. Collected data can vary widely in nature, for instance, concentra-tions of physiological metabolites or proteins. The parallel nature of HTS makes it possible to collect a large amount of data from a small number of experiments and in a very short time. The multi-well system, however, suffers from a significant problem that may affect the relevance of tests: the environment discrepancy problem [2].
tis-sue grown in wells is only a brutal approximation of biological reality. There are several relevant factors that are missing in this environment; for instance the cells in the well are not subject to convective flow of nutrients present in the physiological environment. Another meaningful example is the lack of the typical pressure peaks, and the presence of con-stant solute concentrations, unlike in biological systems where gradients of concentration are the basis of most important processes. In [3] it is discussed how the multi-well approach does not scale fully as expected by an HTS system because the collected data are not directly usable in drug testing. This seems to be a paradox since the multi-well has been the core element of the HTS methodology. In the mean time, systems and devices tools for maintaining cells and tissue in controlled physical conditions or bioreactors have become important tools in drug testing or tissue engineering in general. This particularly due to the growing inter-est in tissue engineering and in-vitro tinter-esting. Moreover, it is now being increasingly recognized that cells respond not only to their biochemical [4, 5, 6], but also to their physical environment [7, 8, 9, 10], and both are necessary to create a biomimetic environment. Noticeably none of these innovative and more physiological cell culture systems is designed for high throughput screening.
Another problem related with the actual drug testing and tissue en-gineering experiments is the enormous number of animals that have to be scarified every year. Animal Testing occurs regularly throughout the European Union (EU) and it still plays a large role in research and drug development around Europe. In Europe, biomedical testing still remains the most widely used type of research for drug development. Toxicity testing for drugs, foodstuffs, household chemicals and various other sub-stances is performed in laboratories throughout Europe. Rats and mice are the most commonly used animals while reptiles are the least
com-monly used animals. Recent years have seen a surge in the use of zebrafish and non-human primates. While ethical concerns regarding zebrafish are low, those involving non-human primates are high. The aim within Eu-rope has been to reduce the number of monkeys and similar animals used for testing purposes. Although their likeness to humans has great value in animal testing, this same likeness raises extreme ethical concerns regard-ing their ability to feel pain and to experience sufferregard-ing and psychological distress[11, 12].
European statistics showed that France used 2.3 million animals in 2005 while Germany used 1.8 million animals in that same year for test-ing purposes. Statistics for 2005 showed that Finland and Ireland both decreased their use of animals. In contrast, Sweden, Spain and Greece all increased their use of animals, either doubling or near-doubling their use. Across all of Europe, there are approximately 12.1 million animal testing experiments performed each year. While there is some debate regarding the statistics of which country is the highest tester of animals, Britain is thought to be the top user of animals with its use of nearly three million animal experiments each year. France is a very close second and generates a large amount of debate given that one of the major global cosmetics company is based in France and still tests on animals.
Europe’s overall laboratory use of animals has actually increased very recently by 3.2 percent. This contrasts with the fall in animal testing over the last few decades. It’s also important to note that one of the biggest animal testers from a global perspective is Huntingdon Life Sci-ences (HLS), which is based in Europe. HLS kills approximately 75,000 animals each year.
A shown in Table 1 most of the animal experiments are done for cosmetics and toxicology purpose. While the UK officially banned animal testing on cosmetics in the late 1990s, Europe has been somewhat slower
to implement a ban. A near total ban is, however, planned for 2009. While most of the EU supports the ban, countries such as France have voiced strong opposition to the ban, citing their belief that cosmetics testing on animals are necessary for sufficient health and safety testing of products.
Table 1: Use of animal tests for the year 2001 in UK. Research Research for human medicine and cosmet-ics Research for veterinary Toxicity tests Disease studies Didattic Other 30% 57% 1.40% 7% 2.70% 0.30% 0.60%
Reducing animal suffering as a whole requires the use of alternative approaches to animal testing. While the scientific community gener-ally supports the use of animals to further our knowledge of health and medicine, they still acknowledge the need for alternatives to reduce ani-mal suffering. This is accomplished through the use of several different categories of alternatives, which are often described as the three “Rs” of biomedical research. They are:
• Reduction in the number of animals needed in a test • Replacement of an animal test by a non-animal test
• Refinement of an animal test to reduce or eliminate stress or suffering
Reduction is probably one of the most promising areas in the sense that a great deal of progress has been made over the last decade. To reduce animal testing, researchers use techniques that allow them to ob-tain a level of information that is sufficient but requires fewer animals.
Conversely, researchers may be able to employ a method that allows them to obtain more information from the same number of animals. The end result is that animal use is maximized and more efficient, leading to fewer animals being used and therefore, fewer animals suffering from any pain or distress that occurs from the experiment. There are numerous ways that researchers can reduce the number of animals used or obtain more information from the same number of animals that an experiment would typically require for success. There are currently modified test methods that are essentially traditional models that have been advanced to pro-vide comparable results with fewer animals. For example, newer versions of the Draize test can reduce the use of animals and additionally, can re-duce the potential distress as well1. Many companies now perform more than one test on the same animal, which allows them to use fewer ani-mals overall. Some companies are also using human volunteers instead of animals to test for skin irritation, which further reduces the number of animals used in testing.
Testing certain substances on cellular models first can rule out the use of animals if results are not favorable. In addition, the use of computer models, databases and similar sources of information can provide the his-tory of a substance and its use as well as offering preliminary information on the safety of a formula.
Tissue cultures are also an extremely useful method for reducing the number of animals used in laboratory experimentation. By utilizing ac-tive cell cultures, companies can dramatically reduce the number of ani-mals used while still obtaining comparable levels of information from the method.
In Europe, alternative testing methods are scientifically validated by
1The Draize test is used to assess toxicity of various chemicals and products
the European Center for the Validation of Alternative Methods (EC-VAM), an official body appointed for this purpose by the European Union. Validation by ECVAM means that these methods can be used across the different industries that test chemicals for safety purposes (chemicals, food, pharmaceuticals, etc). Validation is the process by which scientists and regulators establish whether a method is reliable and relevant for a specific purpose.
To work out how to mimic a complex biological response outside a living organism is a tremendous scientific challenge, and requires a rev-olution in current in-vitro culture methods. Validating an alternative method and proving it is safe also takes time To improve in vitro culture conditions, the conventional models used in flasks or microwell plates need to be re-evaluated and modified and transferred to a more realis-tic representation of the physiological environment through the use of bioreactors.
The design of a cell culture bioreactor requires a basic understanding of both chemical reactor design and cell biology. First, engineers must understand the effects of reaction rates and stoichiometry, mass transfer, heat transfer, and turbulence and mixing on product distribution, reactor productivity and size, and operational characteristics. These phenomena need to be expressed in accurate but tractable models that can be used for design and optimization calculations. Most bioreactors are cumbersome and only provide a few cues such as flow or strain, allowing limited control and flexibility. The aim of this work is to design and realize a single system which can be used to provide a physiological environment to cells on a 3D tissue engineered construct, on a cover slips or directly on tissue pieces and to enable in-vivo physio-pathological phenomena to be simulated in vitro, thus avoiding the use of animal experiments.
and their pros and cons were assessed to exploit their advantages and sur-pass their disadvantages. The most common method for culturing cells is in cell culture incubators. These are large and cumbersome and all mechanical stimuli are absent. They are nevertheless used ubiquitously and their results quoted as “standards” of in-vitro protocols. Owing to this dynamic culture methods have been proposed, and several systems are currently available commercially. Amongst these are low shear perfu-sion system [13, 14], stirred tank bioreactors [15], airlift bioreactors [16], hollow fiber perfused systems [17, 18], rotary cell culture systems [19].
The main advantages of these systems with respect to an incuba-tor are the introduction of fluid-dynamics; the cells are subject to shear stresses, which in several cases are known to stimulate growth, and posi-tively influence cell function. Most of them do however require the sup-port of an incubator for pH and temperature control. A second genera-tion of bioreactors has most recently been realized, these are systems for tissue engineering which provide a high degree of oxygenation through fibers or membranes, allowing adequate oxygen partial pressure with 3D constructs. Finally, the third generation comprises micro-fluidic systems in which small Reynolds number laminar flows are easily established. These also include microfabricated systems such as the perfused microar-ray bioreactor [20] and the micro cell culture chamber assay [21].
Third generation systems have one main drawback as far as tissue engineering applications are concerned; they are small. This implies that they cannot be used for culturing large numbers of volumes of cells or tissue, and in a closed loop system, fluid sampling and analysis can be difficult. Furthermore, in microfabricated systems, surface and edge ef-fects are amplified whereas physiological cell-cell interactions are under-represented
environmental control system, and together they form an experimental platform on which a variety of experiments can be carried out. To offer a vaild substitute for classical in-vitro experiments, an bioreactor platform should should have the following characteristics:
• A culture cell chamber whose design permits a reconstruction of the fluid-dynamic conditions during operation
• A control system able to adjust all the environmental variables in order to simulate the phisyological reality
• A set of various culture chamber each one with a dedicated design in order to easily mimic the different compartments of an organism • A storing and viewing system where the user can easily interact with the bioreactor system and where all the experimental data are collected and stored
To obtain the flexibility and use of new materials and fabrication methods of third generation bioreactors, combined with the control of es-sential operating parameters such as shear stress, flow rates, pressure, pH, temperature, O2 concentration as well as the liberty of being stand-alone, we designed and realized a new concept in cell culture which offers plat-form of bespoke physical and topological environments has been designed and realized.
One of the main features the platform is the culture chambers; their ease of fabrication renders them highly flexible and simple to modify or remodel, and the low cost of manufacturing renders them disposable and compatible with high throughput systems. A further characteristic which is unique with respect to other systems reported in the literature is the principle on which the environmental control system is based and the simple software interface. In this thesis the bioreactor system is described
starting from its design philosophy, its construction and its control. A report on preliminary results of validation tests obtained with different cell types and tissues is also presented.
A generic platform or SUITE (Supervising Unit for In-vitro TEsting) for cell, tissue and organ culture composed of two main components: a universal control unit and an array of bioreactor chambers is presented, through which high throughput experiments can be performed in an in vivo-like simulated environment for a long time (more than a week). In this work it is describe how a new concept of cell culture bioreactor was developed by integrating different technologies and research fields. The data extracted using this new cell culture approach is more predictive of the in vivo response with respect to the multi-well approach, particularly for drug related studies.
This new system is a complete cell culture suite composed of:
• A custom made electronic control block that acquires signals from sensors, such as a pH-meter, thermocouple, flow sensor, pres-sure sensor and sends these signals to a PC through an I/O card • A mixing chamber to allows the addition of oxygen or carbon
oxide to the culture media so as to have the desired value of pH and oxygen concentration; it is also the location of the pH sensor • A peristaltic pump to recreate the flow conditions of the tissue
under examination
• A heater to heat the media culture to 37 C • One or more cell culture chambers
• A freestanding pressure generator to be used in classic CO2 in-cubator experiments
In this work Bioreactors are proposed as alternative in-vitro HTS system to overcomes the limits due to the environment discrepancy prob-lem. More relevant and more predictive data from experiments can be obtained as a result of the capability of this innovative system to better simulate a physiological environment than the classic static cell culture protocols. The system is an innovative platform able to perform High throughput experiment in a more physiological like environments. With this platform it is possible to perform experiments using cell culture or tissues with a consequent reduction of required animals, the experiments done with the SUITE are organized as a High Throughput experiment, and the data collected by a main supervision system which can also im-pose control variables on multiple bioreactors running in parallel. With this parallel and distributed approach a pathology can be simulated in one bioreactor and the other used as a control reference. The system is modular and a various chambers can be plugged together in order to mimic the physiological district organization. With the SUITE is possible to do multi compartmental experiments for drug testing or stimulation experiments where the influence of the environmental variables on tissue physiology is investigated. These two apparently opposite approaches can be merged together using this platform in a more realistic experi-ments where the multi-compartmental approach can be fused together with the cell stimulation. With this new testing approach it is possible for example to investigate how drug efficiency is influenced by physiolog-ical environmental variables such us blood pH, vascular pressure, tissue oxygen concentration etc.
This system can be defined as a virtual mouses set, where all the an-imals are clones (tissues or cells coming from the same animal or donor can be used in different bioreactor) and where by changing the drug con-centration or the control variables a pathologies can simulate and data
collected in parallel and autonomously.
This work was organized in two main parts, the first part was oriented to designing and realizing the control and stimulation systems (Environ-mental control and P.GIO) with the dedicated software and firmware. The second part of the work was oriented to the design and realization of innovative bioreactor chambers to be used as districts or organs simula-tors to be plugged together in different configurations. Merging together these two parts an innovative platform able to perform high throughput experiments in a condition less afflicted by the environmental discrep-ancy problem was realized.with this system is possible to do experiments requiring a lower number of animals, with the possibility of using not only cell cultures but also human or animal tissue, and with the option of applying physical stimuli to the samples.
Environmental Control
In order to realize an innovative High throughput machine able to perform experiments in a more physiological way than the classic multi well ap-proach, the first step was to define and develop the environmental control unit of the SUITE system.
The environmental control unit is the core of the system and is where all the environmental variables are collected by various sensors placed along the system connections and units. In this section it is discussed not only the electronic part of the system but the entire control unit and also the software and algorithm organization.
The aim of this system is to adjust the temperature, pH, pressure, gas flow and dissolved oxygen percentage of the culture medium. The control apparatus is consequently composed not only of the electronic and electro-valves unit, but also of the mixing chamber, the peristaltic pump, the heater unit and the control software.
In order to realize a real High throughput system, the entire design process was driven by the necessity of a system able to perform experi-ments in parallel, with an autonomous control and with a user friendly interface that easily allows the researcher to change the controlled vari-ables in order to mimic different pathologies.
the data collected by the system using the XML data format [22] for storing and organizing application data, in order to allow an easily inter-operability among different programs for further processing of generated data.
1.1
Materials and Methods
The SUITE platform is a complex system, in this section are described all the generic parts required to control the system and to create the required cellular environments. The dedicate bioreactor chambers used in the SUITE system are described in the following sections.
1.1.1
The Bioreactor Hardware
The SUITE platform consists of the following parts: • Cell culture chamber
• Mixing chamber • Heating system • Peristaltic pump
• Electronic circuit and electro-valve box • PC
The Mixing Chamber
The mixing chamber (Figure 1.1) is connected in series with the cell culture chambers and serves for pH and oxygen regulation as well as to remove air bubbles; essentially the medium is perfused with gas according
to the measured pH. The medium is inserted and removed in this chamber through a needle with the flow imposed by the peristaltic pump.
pH regulation is performed by inserting two different gases in the mixing chamber: Carbon dioxide and Air (not O2 because of flammability risks). The culture medium contains bicarbonate buffer and its pH can be closely regulated through diffusion of gases; in particular the diffusion of O2 (Air) tends to raise the pH, while CO2 tends to lower it [23].
The mixing chamber is made with a plastic autoclavable bottle with a screw cap. The cap is drilled and four silicone tubes are inserted and sealed with PDMS (polydimethlysiloxane, an elastomeric polymer also used for the fabrication of bioreactors). Two of these tubes are for the medium flow and the other two for insertion and removal of gases. The tubes present different lengths and just the gas inlet and the medium ex-traction tubes are long enough to reach the bottom of the mixing cham-ber. The other two tubes (medium insertion and gas removal) are just few millimeters long (over the internal part of the cap), this allows visual observation of the medium as the drops fall down the inlet tube. Drop formation is useful not only for a system check but also to increase the gas exchange processes. The gas outlet tube is shorter than the inlet in order to prevent medium foam being collected by the outlet tube and consequently removed from the mixing chamber and down to the cells.
Most pH probes are very sensitive to convective flow of the medium, therefore, the bottom of the mixing chamber is designed in order to mini-mize flow disturbance near the sensor. The bottom of the chamber where the pH probe tip is inserted is cone-shaped. Media mixing is located over the cone surface and in the probe tip zone the medium is mixed only by diffusion and the pH measurement is consequently very low in noise (Figure 1.1.b).
con-nected to syringe filters in order to keep the internal volume sterile and to prevent contamination coming from the gases. A syringe needle is connected to the outlet tube, and its high flow resistance ensures a con-stant pressure difference between the inlet and outlet. The outlet needle can be easily replaced and its diameter can be chosen in order to adjust the outlet flow resistance, so changing the correlation between the inlet flow and the internal pressure of the mixing chamber. The inlet tube is equipped with a one way valves in order to prevent the medium going into the control unit in case of system failure.
Figure 1.1: a) The mixing chamber filled with medium and with the pH meter placed in. b) The pH meter tip (blue) in the mixing chamber’s dedicated notch.
The bioreactor mixing chamber allows also the insertion of Oxygen sensors that may be lodged through a dedicated cap with a different diameter hole. Alternatively a chamber equipped with oxygen sensor can be connected in series to the main mixing chamber.
It was decided not to realize a single mixing chamber equipped with both pH and Oxygen sensors because the O2 probe is an optional sensor and it is preferable to have a small main mixing chamber to minimize media volumes.
The Electronic Circuit and Electro-Valves Unit
This part of the system is the heart of the bioreactor control unit. In this unit there are the electronic circuits for the sensors, for communication with the PC and for the actuation of the electro-valves, the pressure regulator and the electro-valves. The sensors plugged or inserted in this unit are (Figure 1.2):
• 2 temperature sensors (ntc thermistor [24]) • 1 gas flux sensor (AWM 3000[25]) (internal)
• 1 Pressure sensor (Phidgets 1115 - Pressure Sensor [26]) (internal) • 1 pH sensor (Hamilton Biotrode pH probe [27])
• 1 Environmental Humidity and temperature sensor (1125 - Humid-ity/Temperature Sensor [28])
The main component of the electronic control box is an usb I/O board (1018 - PhidgetInterfaceKit 8/8/8 [29]) where all the analog sensors are connected. This I/O interface has 8 Digital in, 8 digital out and 8 analog in connections; this interface board is CMOS standard and the analog channels acquisition range is consequently 0-5V with 12 bit resolution. The digital channels are used to control the frontal status LEDs and to actuate, through a dedicated relay board, the gas electro-valves.
The pressure, environmental temperature and humidity sensors are directly plugged to the Phidget I/O board because they are directly com-patible with it. For the flux sensor a simple signal adjusting circuit was required in order to convert the flux sensor signal to the Phidget 0-5V standard.
The two temperature sensors are read through a dedicated Phidgets component (1121 - Voltage Divider [30]) and connected to the Phidgets
Figure 1.2: The bioreactor external sensors: the two temperature sensors probe, the environmental temperature and humidity sensor and the pH meter.
board through a resistive sensor. These conversion units act as a voltage divider where the base resistance can be adjusted through a trimmer in order to fit the connected sensors working resistance.
The pH and the Oxygen sensors are connected to two separated 4-20mA [31] reader units designed by Phidgets to read pH meter probes but usable in raw values mode to read all the sensors with the 4-20mA standard BNC current loop connection [32] (figure 1.4.b).
The electronic control box is connected to the CO2and O2lab connec-tions through two dedicated pressure regulators equipped with a humidity removal filter. The connection with the electronic box is done with two quick plug connectors on the back side of the control box. Inside the bioreactor control unit the two gas lines are connected to the electro
valves through other two pressure regulators in order to prevent damage of the system in case of failure of the lab regulators. The two electro valve outputs are connected to the pressure regulator through a T connector.
In order to ensure CO2 and O2 mixing and also to reduce flow vibra-tion introduced in the gas circuit by the pressure regulator and electro valve components an expansion chamber is inserted (gas mixer). The ex-pansion chamber is where the pressure is measured and this chamber is connected in series to the pressure regulator. The outlet of the expansion chamber is connected to the flux sensor that is the last component before the gas outlet quick connector. 1.3.
Figure 1.3: Schematic connections of the pressure and gas regulation system.
The electro-valves are used to select the gas that is injected in the mixing chambers and are connected to a pressure regulator SMC ITV0000 series [33] used to control the pressure inside the cell culture chamber. The electro-valves are powered at 24v AC and controlled by a Phidgets relays board [34].
The pressure regulator is powered at 24V DC and is controlled by a 0-10V DC analog signal made through a serial to PWM (Pulse Width
Modulation) generator chip (Pololu Micro dual serial motor controller [35]).
A commercial USB to serial adapter was used to generate the RS232 control signal. The PWM generator is mounted on a dedicated board designed for the purpose (Serial to PWM board). The serial to PWM board is a circuit able to control the Pololu chip and to generate two Analog signals in the range of 0-10V with a low ripple and with an on board feedback system that allows the system to have a real feedback of the analog generated signal. In the Serial to PWM board a reset circuit that can be activated by the control library 1.1.2 in case of serial commu-nication problem (Figure 1.4) rising up one of the I/O digital channels is implemented.
Figure 1.4: a) The Serial to PWM board plugged to the USB RS232 converter and b) the Phidgets pH readers.
The two pH readers, the I/O Phidgets board and the usb to serial converter are all connected to an USB hub placed on top of the control box and suitable also for USB data stick or other USB peripheral connection. The USB hub is powered by the control box power supply, this prevents over charge the USB computer ports and also to prevents electric failures of the system which may damage the connected computer. A dedicated 220V AC unit is also connected to the USB hub through an USB relays Phidgets board [36] allow the user to control four separated 220V sockets.
One of these 220V socket is used to power up the heater described in the next section 1.1.1. All the sockets are connected to ground and protected by a 3 Ampere fast fuse. The other sockets are usually used to connect the peristaltic pump and other equipments used during the bioreactor experiments.
This allows complete disconnection of all the bioreactor experiment components by the electrical network in case of failure. This safety rou-tine is implemented through a classic “watch dog” rourou-tine in the control library.
Figure 1.5: The Bioreactor control unit, the heating box and the 220V sockets unit during an experiment.
The Phidgets components were used to realize the control unit because these boards and sensors are very stable, resistant and with a well written driver and library package. The Phidgets libraries are compatible with
all the latest programming standards and languages such as C++, .NET, Matlab, Labview etc.
Heating Hox
The bioreactor heating system consists of a Plexiglas box where the mix-ing chambers and at most two modular culture chambers are inserted (Figure: 1.6.a). Distilled water heated by an electric 220V powered AC heater[37] is agitated using a bubble maker placed on the bottom of the
heating box and connected to lab air line1. The bath and chambers
temperatures are controlled by the two water proof temperature sensors placed directly near the mixing chamber.
The heating unit is not directly in contact with the water, but is placed inside a dedicated cooper support that prevents electric risk by a direct connection to the ground 1.6.b. The cooper unit is also designed in order to increase the heater exchange surface, the system takes at most 10 minutes to warm the entire water volume (≈400 mL) from 17 to 37◦C[38, 39, 40]. The thermal coupling between cooper unit and heater is obtained through a silicone thermal gel, this gel is inserted in the internal part of the cooper unit and has no contact with the bath water. The used cartridge heater, a low power heater, was chosen in order to ensure a low thermal flow near the mixing in order to prevent over heating or non-uniform thermal distribution in the mixing chamber medium. The heater also has an internal temperature safety limit of 80◦C that prevent any damage of the system in case of controller failure.
Culture chambers can be also heated independently using dedicated resistive heaters [41] placed directly under the MCmB trays. The resistive heaters are controlled by an electronic unit through a 24V PWM power regulator [42].
The heating box is equipped with a dedicated MCmB chambers tray which enables facile assembly of a bioreactor experiment under a laminar flow hood, without risk of contamination. The mounting tray is designed to fit perfectly the heating box only in one position in order to prevent risk of failure in the assembly phase. The tray system include also a pH Meter holder to prevent breakage of the very thin pH Meter tip during the bioreactor chamber procedures (sampling, cell insertion and removal etc).
Figure 1.6: The heating box and other bioreactor components during an experiment setup.
Computer
The computer is plugged to the electronic control box through a USB ca-ble and the signal is split by the previous mentioned USB hub. A netbook computer is used to control the whole system. Atom based boards for
em-bedded systems are widely available and will substitute the computer in the appliance.
Peristaltic Pump
To control the nutrient flow and the shear stress, it is necessary to regulate the speed of the peristaltic pump used to perfuse the nutrients inside the bioreactor, this control is operated by a dedicated connection between the pump and the electronic box, and is monitored in feedback mode through an appropriate control pin of the pump connected to the Digital I/O board. The peristaltic pump is 220V powered and is connected to the 220V sockets unit in order to allow an easily disconnection in case of failure.
Figure 1.7: A) The Control box with all the sensors plugged in and the heating box during an experiment. B) Detail of the mixing chamber in the heating box with the pH meter tip and the temperature sensors. C) The pH meter insertion phase.
1.1.2
The Control System
A High Throughput bioreactor experiment employs many bioreactors with different cell culture chambers. A pathology can be simulated in one of the Bioreactors, and the others used for a control reference; the bioreactors environmental variables can be set in order to simulate one or more pathologies and observe the influence of this different environment on the physiology of the tissue function during an experiment. In order to deal with parallel management of multiple bioreactors a distributed pro-gramming framework for robotics has been used. The framework is called Robotics4.NET [43], and it has been developed to help programming the control system of a robot.
The framework architecture has been inspired by the human nervous system, and features the communication infrastructure required to con-nect the central system to the peripheral. Peripheral “organs” are called robletsand communicates with the central system, named body map, us-ing XML messages. Communication is disconnected, and it is unreliable (it uses the UDP protocol), thus roblets have to continuously inform the body map about their state. The disconnected nature of the communi-cation implies that a local crash does not imply a global crash. In fact each of these elements can be restarted without need for a global restart; this is an important aspect because if one unit of an experiment fails other units can continue functioning without need for aborting the whole experiment.
A program based on Robotics4.Net is composed of three ingredients. • Brain: The core of the control system
• Bodymap: A sort of black board used to send and receive messages • Roblets: The appendix of the system, like the parts of the nervous system. They read data from the environment and convert the
Brain signals into actions
In this case each of the bioreactor systems is composed of the elec-tronic box connected to a netbook computer and it is perceived as a roblet (figure 1.8). Each Bioreactor (roblet) communicates through the network protocol with the supervision program installed on another remote com-puter hosting the Bodymap. Because the connections among the roblets and the bodymap are based on a datagram-oriented protocol the brain can be powered off and restarted afterwards without affecting the activity of roblets.
Figure 1.8: Schematic flowchart of the entire Bioreactor system; in green are the electronic control units and connections, in red the culture chambers and the medium circuit, the gas connections and apparatus are represented in blue and the light red is the heating box unit that contains part of the system.
This is a fundamental feature of this control architecture, each biore-actor is able to control it environment autonomously and it requires the connection with the supervision software (interface) just to receive the target values and to show the collected and stored data.
In a bioreactor system it is necessary to control many parameters: the amount of nutrients flowing in the cell culture chamber, the hydrostatic pressure inside the system, the flow generated shear stress on the cell culture, the flow of gas, the temperature flux generated by the heating system and the pH of the medium. These parameters are established using a graphical interface and sent to the roblets running on the biore-actors.
Since Ethernet is a communication bus, the graphical application used to control an experiment can receive UDP packets from several units run-ning in parallel. This is very important in the context of HTS method-ology [44]. The network also allows connections through the Internet, allowing remote monitoring of experiments, an important feature since experiments run for several days [43].
Each bioreactor roblet runs an instance of the bioreactor control li-brary (BioreactorControl.dll)1.1.2 developed for the purpose using F# [45, 46], a functional programming language based on ML and developed by Don Syme et al at Microsoft ResearchT M.
Data collected during the experiments is stored by the roblets on the hosting computers as XML files that can be directly opened with any spread sheet application supporting this format at the end of the exper-iment. This feature is implemented using the .NET XML serialization ability, allowing to directly write on a text file the state messages sent by the roblet to the bodymap.
Bioreactor control library
The Bioreactor Control library is developed in F# .NET and compiled as a dedicated library in order to maintain the control system independent of the roblet architecture. This hierarchical architecture is safer than a classic direct control approach, because the roblet and the control library
library are developed and maintained separately. With a control library independent of the roblet architecture it is possible to compile a direct control console interface that was used during the preliminary library debug phase and allow a direct check in case of hardware failure.
With a separated .NET library one can also choose to change the control architecture without completely re-design of the hardware control system. For example, it is possible to move to other control frameworks without need to re design the control algorithms and vice-versa.
The bioreactor control library defines the sensor reading units and the control strategies. Each sensor is designed not only as a reader, but as an active part of the system capable to influence the actuation strategy. The implemented sensor units are:
• pH sensor and gas selection unit • pressure sensor and regulator unit • temperature sensor and heater unit
Other sensors such as the environmental temperature and humidity probe are designed as reading unit and they do not implement an actua-tion behavior.
pH control strategy
As mentioned in [47], the pH is more complex to control than other pa-rameters because of the delays between gas infusion and ionic dissociation, for this reason in order to control the pH in the medium a dedicated con-trol adaptive algorithm, based on a step strategy was developed. This control algorithm is a high priority service running on the pH Sensor unit of the bioreactor control library.
The pH response to the diffusion of CO2 and air is very difficult to predict, because it strongly depends on the environmental variables of the particular experiment such cell type, temperature, volume of medium, type of medium, hydrostatic pressure etc. Therefore rather than using a mathematical model [48] of the CO2 and air diffusion in water, a function defined by an algorithm was used.
Before designing a complex and not linear algorithm a formal model of the algorithm using the Abstract State Machines (ASM) formalism [49] was defined. Using ASM any algorithm can be described in a formal mathematical system. It is a very effective approach for specifying the algorithm and study its properties.
The system continuously inserts air in the mixing chamber through an appropriate needle (blue zone in figure 1.9); when the pH goes over the safety threshold (selected by the user through the control interface) the control inserts a known CO2 impulse (red zone in figure 1.9), in the mixing chamber, and waits a Delay Time. In this way a known amount of CO2 is inserted in the mixing chamber and the control wait the CO2 dissolution and reaction time before evaluate the effect of this operation. If the pH returns under the safety threshold the pH control routine is stopped, otherwise after the Delay Time has passed, the control inserts a new impulse of CO2 and waits for the Delay Time.
The Delay Time is constant, the CO2 spray amount (Spray Time) is
adjusted at every step in a manner dependent on the value of pH and the derivative of pH with time2.
The pH control strategy includes a safety logic test used to evaluate whether the pH is decreasing or not; in the case of a negative derivative, if the pH value is under the safety positive threshold (green zone in figure
2The derivate is calculated on a time span of 2 second because of the CO 2
1.9, the control does not insert CO2 because it is possible to assume that the last CO2 spray was sufficient and the pH can return under the thresh-old in a short time; this test prevents an excessive fall in pH, because the CO2 spray causes a large drop in pH but with a substantial delay.
Figure 1.9: pH control algorithm working zone.
Equation 1.1 describes how the Spray Time is calculated by the biore-actor control library. The Spray Time to use is an increment of a default spray time (AverageSprayTime) calculated adding an amount propor-tional to the difference between the pH value and the selected target value (pH*) and also an amount proportional to the pH derivate2.
SprayT ime = AverageSprayT ime + A(pH− pH∗) + B(∆pH
∆t ) (1.1)
The multiplicative constants A and B are selected by the user through the user interface and depended on the medium and volume, the user can also choose the margin span through the pH margin variable of the interface.
With a formal model based on ASM [50] the constants for a water environment were predicted, but they are very sensitive to the physi-cal conditions of the experiment (volume and type of medium, pressure, temperature). Consequently the ASM predicted constants were used as
default values that are suggested by the configuration interface. During the experiment, these constants can be adjusted in order to match the pH control parameter with the experimental set up. The code below is the pH control algorithm.
let controlloph = seq {
while (true) do
if (this.DeltapH < 0.) &&
(this.PhValue < (this.targetValue + this.Range)) then yield 0.
else
while(this.PhValue > (this.targetValue-this.Range)) &&
(this.controlState = InterfaceState.Auto) && ((this.DeltapH >= 0.)|| (this.PhValue >(this.targetValue + 2.*this.Range))) do
this.SetGas <- GasType.CO2 this.spraytime <- this.averagespray + (float(this.avalue)*(this.PhValue-this.targetValue)) + (float(this.bvalue)*(this.DeltapH)) yield this.spraytime this.SetGas <- GasType.Air this.waitingtime <- this.averagewait yield this.waitingtime yield 0. }
As shown in the pH control algorithm F# code 1.1.2 the seq construct was exploited to let the compiler generate a finite state automa that performs the computation defined in the body and pausing and saving the state of the computation whenever the yield expression is reached. In the control library the pH control sequence is triggered by the pH sensor event handler and it is active only if the control state is set to Auto, otherwise the routine will return 0 that is considered as a timer stop. The pH sensors require a temperature compensation that in the
control library is obtained through the two temperature sensors inserted in the heater box, the temperature sensor used as pH compensator can be selected throught the user interface.
Pressure and gas flow control
The pressure in the mixing chamber is obtained through a needle placed on the outlet tube in order to have a high flow resistance on the outlet tube.
The pressure is controlled through the serial to PWM board that generates the analog 0-10V control signal for the pressure regulator. Note that the system does not use a calibration function that converts the digital value sent to the serial port to the pressure regulator obtained pressure.
Typically the pressure regulators are designed to be used in a closed system and the imposed pressure is guaranteed for a static environment. In the case of an open system with flow the pressure read-out is not linear and there may be large errors between the real pressure and the read-out 1.10. In this case the mixing chamber has an outlet connection and the system is always subject to flow, it is consequently impossible to use the data sheet pressure regulator correlation factors.
For this reason use a ramp approach has been followed; the control library use the pressure sensor to read the mixing chamber pressure and increases or decreases the PWM signal in order to reach the target pres-sure. In this case the pressure regulator under flow dis-alignment issue can be adjusted, and the system can be actuated in a flow control strategy in which the the flux sensor instead of the pressure is used as feedback.
The pressure in the mixing chamber is obtained with a flow resistance imposed by a needle, with this ramp approach the outlet needle diameter can be changed in order to change the flow rate/pressure ratio without
needing to re calibrate the system.
Figure 1.10: Pressure regulator characteristic at different flow rates. The iteration approach is incremental it is not necessary to send more than one step per time, the ramp speed can be chosen through the user in-terface in order to change the pressure adjustment and reactivity speed. The user can also choose the pressure threshold that is used to calcu-late the margin around the target pressure where the pressure control is stopped and the pressure attained is considered acceptable.
All the control variables and the flux or pressure control strategy can also be selected through the user interface during an already started experiment.
The control routine also implements a safety control test that rises up an exception in case the pressure regulator is unable to reach the target pressure, this can occur for example if the outlet needle diameter is too large and the flux imposed by the pressure regulator is unable to pressurize the mixing chamber at the requested value1.1.2. The routine below reports the code for the safety control test.
let DoControl (value:float) (target:float) (range:float) =
if not(this.pwm = 127uy) then this.pwm <- this.pwm + 1uy pwmset this.pwm
else
this.timer.Stop() this.pwm <- 0uy
this.Pressuretrigger(new StatusEventArgs(EventType.targetpressure_fluxtohigh))
else if (value > target+range)&& (this.State = InterfaceState.Auto) then if not(this.pwm = 0uy) then
this.pwm <- this.pwm - 1uy pwmset this.pwm else this.timer.Stop() this.pwm <- 0uy this.Pressuretrigger(new StatusEventArgs(EventType.targetpressure_fluxtolow)) else this.timer.Stop()
The GUI Software
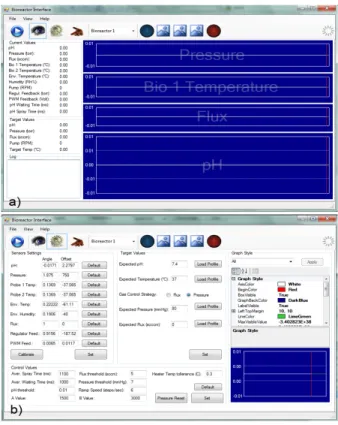
The Graphical User Interface is developed in C# and is based on a multi-tab structure;the GUI is used to read data from the bioreactors and to setup the experimental variables of each module. The user interface also serves as a tool for sensor calibration, in order to perform the sensor cal-ibration with the same software used for bioreactor control. The user has control over the experiments, including a manual overdrive, though the autonomous control software running on the roblet avoids commands that could damage the system or the experiment. When the User Inter-face is open, it seeks for connected bioreactors; when one is found, the GUI switches in the view mode figure 1.11(a). In this section the data pertaining to each bioreactor can be viewed by selecting its menu and experimental settings can be changed through the configuration tab.
The Bioreactor control GUI has a set of default variables stored in the system registry during the installation, all the changes to this vari-able such as calibration or control parameter are stored on the Windows registry and are saved as new working values. The installation default values can be easily restored with a dedicated button1.11(b).
Figure 1.11: The bioreactor control user interface in the view mode (a) and in the config mode (b).