Engineering the vibrational coherence of vision into
a synthetic molecular device
Moussa Gueye
1
, Madushanka Manathunga
2
, Damianos Agathangelou
1
, Yoelvis Orozco
1
, Marco Paolino
3
,
Stefania Fusi
3
, Stefan Haacke
1
, Massimo Olivucci
1,2,3
& Jérémie Léonard
1
The light-induced double-bond isomerization of the visual pigment rhodopsin operates a
molecular-level optomechanical energy transduction, which triggers a crucial protein
struc-ture change. In fact, rhodopsin isomerization occurs according to a unique, ultrafast
mechanism that preserves mode-speci
fic vibrational coherence all the way from the reactant
excited state to the primary photoproduct ground state. The engineering of such an
energy-funnelling function in synthetic compounds would pave the way towards biomimetic
mole-cular machines capable of achieving optimum light-to-mechanical energy conversion. Here
we use resonance and off-resonance vibrational coherence spectroscopy to demonstrate that
a rhodopsin-like isomerization operates in a biomimetic molecular switch in solution.
Fur-thermore, by using quantum chemical simulations, we show why the observed coherent
nuclear motion critically depends on minor chemical modi
fications capable to induce specific
geometric and electronic effects. This
finding provides a strategy for engineering vibrationally
coherent motions in other synthetic systems.
DOI: 10.1038/s41467-017-02668-w
OPEN
1Université de Strasbourg, CNRS, Institut de Physique et Chimie des Matériaux de Strasbourg, UMR 7504, F-67034 Strasbourg, France.2Department of
Chemistry, Bowling Green State University, Bowling Green, OH 43403, USA.3Dipartimento di Biotechnologie, Chimica e Farmacia, Università di Siena
I-53100 Siena, Italy. Correspondence and requests for materials should be addressed to M.O. (email:[email protected]) or to J.L. (email:[email protected])
123456789
W
hile quantum mechanics rules chemical structure and
reactivity, the
field of quantum biology raises the
question whether it may also rule biological functions
like, for instance, in photosynthetic light-harvesting complexes
possibly taking advantage of quantum coherence to enhance the
efficiency of photochemical energy transfer and conversion
1–3. A
paradigmatic system at the interface of quantum chemistry and
quantum biology is the animal visual pigment rhodopsin (Rh), in
which the protein scaffold optimizes the photoisomerization of its
co-factor, a protonated Schiff base of retinal (PSBR, see Fig.
1
a).
Indeed, the PSBR of Rh undergoes a high speed (200 fs
4) and high
quantum yield (Φ)
5isomerization, initiating the protein’s
biolo-gical function. This event is driven by the vibrationally coherent
nuclear motion of the chromophore along a barrierless excited
state (S
1) potential energy surface (PES) leading to decay to the
ground state (S
0) in the region of a conical intersection (CInt)
6–11.
Previous studies argued that the high
Φ value of Rh is achieved
through a precise phase relationship between two vibrational
modes at the point of decay
12. A vibrationally coherent motion
would
propagate
this
phase
relationship
from
the
Franck–Condon (FC) state to the decay region, thus providing a
way of controlling the
Φ value. Therefore, replicating such a
mechanism in synthetic molecules would provide a route for the
preparation of molecular devices with properties and efficiency
programmed at the atomic level.
In the past, the above idea has stimulated mixed theoretical/
experimental research efforts. Following quantum chemical
modeling,
the
N-alkylated
indanylidene–pyrroline (NAIP)
molecular skeleton was synthesized and functionalized such that,
in solution, it mimics the
π-electron system and geometrical
constraints of PSBR in rhodopsins
13. As a result, the MeO-NAIP
(see structure 1 in Fig.
1
b) was observed to undergo an ultrafast
photoisomerization
14with transient absorption spectroscopy data
displaying low-frequency (60 to 80 cm
−1, i.e., ~500 fs period)
oscillatory features
15,16similar to those of the visual pigment
featuring a 11-cis PSBR or light-sensing pigments featuring a
13-cis PSBR
17. On the basis of quantum chemical simulations, these
oscillations were attributed to ring deformation motion coupled
to the reactive C=C bond twisting in the photoproduct
16,
indi-cating a coherent nuclear motion initiated in S
1and continued in
S
0after decay through a CInt. However, as we will further discuss
below, resonant laser pulses may trigger coherent vibrational
motion also in the initial S
0state. For this reason, the proposed
coherent S
1decay of 1 remains hypothetical. In addition, the
photoisomerization quantum yield of 1 is significantly lower
13,14than that of Rh, and the precise understanding of the S
1dynamics
is an unavoidable pre-requisite for the development of more
efficient NAIP-based switches.
Here we perform UV-VIS transient absorption (TA)
experi-ments with sub-10 fs pump pulses and broadband white light
probing to perform vibrational coherence spectroscopy
18(see
Methods section), in an experimental approach similar to that
19recently applied to Rh
9. When it is resonant with any molecule’s
absorption band, such a short pump pulse impulsively produces a
non-stationary population described as a vibrational wavapacket
in S
1. It may, however, also produce a vibrational wavepacket in
S
0via the so-called Impulsive-Stimulated Raman Scattering
(ISRS) process
20–25. This mechanism still operates with an
off-resonant pump pulse, which produces vibrational wavepackets in
S
0only. Here we compare the effects of resonant and
off-resonance excitations on 1 and 2, where the methyl group on
carbon C5 has been replaced by a hydrogen atom (see Fig.
1
c). As
we will detail below, such a comparison provides a compelling
evidence that: (i) the S
0low-frequency mode, dominating the
observed vibrational coherence of 1, originates in S
1and (ii) an
elementary chemical modification of the MeO-NAIP structure,
affecting its torsional geometry, quenches the signatures of such
critical S
1motion in 2.
Results
Vibrational coherence spectroscopy. The TA data obtained
upon resonant excitation of 1 and 2 are displayed in Fig.
2
a, b,
respectively. They may be interpreted, via the introduction of an
effective linear susceptibility
23, as the time-dependent, linear
absorption of the probe beam by the non-stationary states
impulsively produced by the pump pulse in S
0and S
1.
Accord-ingly, they reveal simultaneously transient species population
kinetics in the form of UV-Vis absorption (from S
1, bleached S
0,
or photoproduct) or emission (from S
1only), as well as the
accompanying vibrational dynamics in terms of oscillations. We
first describe the signatures of the electronic population kinetics.
Negative signals are due to S
0bleaching (GSB) observed at
λ <
400 nm, or to stimulated emission (SE) at
λ > 450 nm. Positive
signals are due to S
1absorption (ESA) at early times and
absorption of the vibrationally hot S
0photoproduct (PA). The
main difference between the electronic population kinetics of 1
and 2 is seen in the SE spectral shape and lifetime as well as in the
early photoproduct signal. In compound 1 the SE extends
far to the red (>700 nm). It impulsively decays to give rise to
an early, almost octave-spanning, absorption spectrum of the
H H 11
a
b
d
c
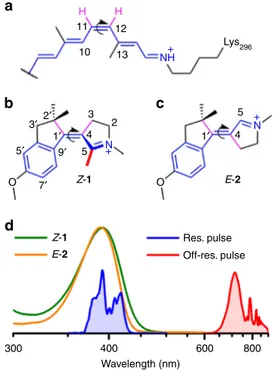
12 NH+ N + N + 13 Lys296 10 2′ 3 300 400 Wavelength (nm) 600 800 Res. pulse Off-res. pulse 5 4 O Z-1 O E-2 Z-1 E-2 2 4 5 3′ 5′ 1′ 1′ 9′ 7′Fig. 1 Structure and absorption spectra of the NAIP compounds. a The 11-cis PSBR chromophore of Rh (the curly arrow indicate the 11-cis to all-trans photoisomerization reaction) inspired the chemical design of (b) MeO-NAIP1 and (c)“C5-demethylated” dMe-MeO-NAIP 2. Their most stable S0 isomers areZ-1 and E-2. The elementary CH3to H substitution inZ-1 at position C5 alters theZ/E equilibrium in favor of a more stable E form. The three compounds have a similarπ-electron system (blue molecular backbones) with an S1state characterized by a bond length alternation and partial reduction of the protonated Schiff base through charge transfer along the carbon backbone. They also have an analogous photoreaction coordinate, which involves the torsion around the central C=C double bond (curved arrows) as well as out-of-plane motions of the purple bonds.d Steady-state absorption spectra ofZ-1 (in green) and E-2 (in orange) together with the femtosecond laser pulse spectra used for resonant (blue) and off-resonance (red) vibrational coherence spectroscopy
photoproduct (420–700 nm at 300 fs). The same spectral
sig-natures have already been reported for a set of NAIP
com-pounds
15,16as well as for Rh
7and were attributed to a vibrational
wavepacket evolving coherently through the CInt and driving the
impulsive decay from S
1to S
0. The signal zero crossing at the
crossover between SE and PA in the low-energy side of the
spectrum, occurring at 250 +/− 30 fs at 700 nm for 1, is thus
interpreted as a measure of the time at which the molecular
system crosses the CInt. In contrast, no such red-shifted SE and
PA signatures are observed for 2. More specifically, the SE is
spectrally narrower, longer-lived and the narrow PA signature
rises progressively during the SE decay, both according to
exponential kinetics (ref.
26and Supplementary Information of
ref.
27), in contrast to the TA signals of 1, which show dominant
non-exponential features due to vibrational wavepackets.
The oscillatory signals (Fig.
2
e, f, g, h) are isolated from the
underlying electronic population kinetics by globally
fitting the
latter with a sum of exponential decay functions
18. Fourier
transforming the
fit residuals reveals the frequencies associated
with the vibrational wave packets observed along a time window
covering the S
1reactive motion, decay, and S
0photoproduct
formation. Figure
3
a, b display the corresponding vibrational
power spectra in blue. When using the non-resonant red to IR
pulse instead of the 400 nm pulse as a pump pulse, no population
is created in S
1and no electronic population dynamics is detected.
However, coherent vibrational dynamics are excited in S
0, by
non-resonant ISRS, producing oscillatory TA signals, which are
directly analyzed by Fourier transformation. The corresponding
vibrational spectra are displayed in red in Fig.
3
a, b.
For both compounds 1 and 2, the high-frequency vibrational
activity (>500 cm
−1) is observed in both on- and off- resonance
experiments, and is therefore attributed to S
0vibrational activity.
The dominating signatures are the 1572 cm
−1ethylenic stretch
mode, the 1259 cm
−1mode localized on the indanylidene
moiety
28as well as the 734 cm
−1and 651 cm
−1(2 only) modes
reported here for the
first time and unassigned. The 455 cm
−1mode (unassigned) may also be an S
0mode but its detection upon
off-resonant excitation is likely impaired by the much more
intense 492 cm
−1mode of the fused silica sample cuvette. In
contrast, for both compounds, the low-frequency vibrational
activities (<400 cm
−1) observed upon resonant excitation (blue
spectra, Fig.
3
a, b) are not detected in the off-resonant
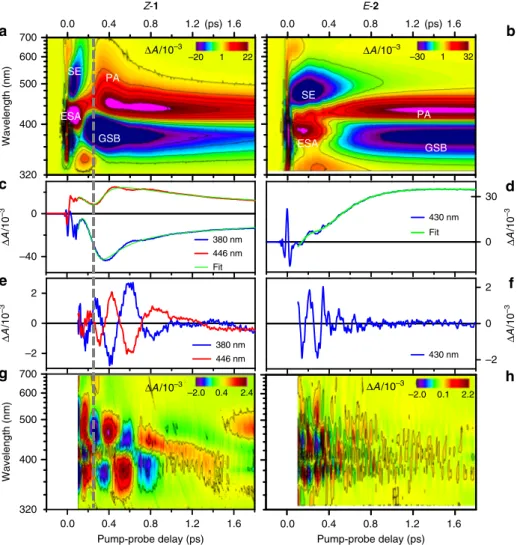
0 30 Δ A /10 –3 430 nm Fit ESA SE GSB PA ΔA/10–3 –40 0 Δ A /1 0 – 3 380 nm 446 nm Fit 400 500 600 700 ΔA/10–3 Wavelength (nm) PA SE ESA GSB 320 (ps) 400 500 600 700 Wa ve length (nm ) 320 ΔA/10–3 Pump-probe delay (ps) –2 0 2 Δ A /1 0 –3 430 nm –2 0 2 Δ A /10 – 3 380 nm 446 nm 0.0 0.4 0.8 1.2 1.6 0.0 0.4 0.8 1.2(ps)1.6 0.0 0.4 0.8 1.2 1.6 0.0 0.4 0.8 1.2 1.6 ΔA/10–3 Pump-probe delay (ps) –30 1 32 –20 1 22 –2.0 0.4 2.4 –2.0 0.1 2.2
b
a
d
c
f
e
h
g
Z-1 E-2Fig. 2 Transient absorption spectroscopy ofZ-1 and E-2 upon resonant excitation. a, b 2D map representations of the differential absorption (ΔA) coded in false colors, as a function of probing wavelength (nm) and pump-probe time delay (ps). The TA data are obtained upon excitation with a resonant, 8.5 fs pump pulse of a methanol solution ofZ-1 (left column) and E-2 (right column). c Kinetic traces illustrating the signal detected at the 380 nm (blue trace) and 446 nm (red trace) probe wavelengths forZ-1, and the result of the 2D map global fit (green) at the same wavelengths. d Same for E-2, at the 430 nm probing wavelength.e, f The corresponding residuals reveal the oscillatory signatures of the nuclear motions. g, h 2D map representation of the residuals of the globalfit of both TA data sets. Time delays shorter than 0.1 ps are disregarded (see Methods section). Fourier transformation of these maps along the time axis reveals the power spectra of the oscillatory signals, interpreted as vibrational spectra (Fig.3). The vertical dashed line at 250 fs acrossa, c, e, g indicates the moment of impulsive S1decay of1 at the CInt
experiments (red spectra, Fig.
3
a, b). This observation is central
and may be rationalized as follows. The ISRS mechanism at work
here as well as spontaneous Raman scattering may both be
described by a wavepacket formalism
25,29,30which introduces the
propagation time
τ of the wavepacket on the S
1PES between the
two light
field interactions that characterize a Raman transition.
When
τ is much shorter than a given vibrational period, no
evolution occurs on S
1, such that no Raman activity exists for this
mode unless non-Condon effects (i.e., nuclear coordinate
dependence of the electronic transition dipole moment) become
significant. This conclusion holds for non-resonant Raman
processes, where
τ ~ h/ΔE with ΔE the detuning of the light field
from resonance
30(here, with the 800-nm pump,
ΔE ~ 1.5 eV and
τ ~ 2.7 fs). The same conclusion also holds for resonant ISRS
performed with a short enough pump pulse
31, since in this case,
τ
is of order of the pump pulse duration (8 fs here). Therefore, we
argue that for sufficiently low-frequency modes (i.e. oscillation
periods much longer than 8 fs) the vibrational activity induced in
S
0by ISRS is the same for both on- and off-resonance pulses (and
results from non-Condon effects, if any). In fact, the analysis of
the S
1reaction coordinate discussed below confirms that only a
high-frequency stretching mode is activated within 8 fs, while the
isomerization motion is activated at a later time.
Of central interest, here is the 80 cm
−1mode, which largely
dominates the vibrational power spectrum of 1 in the resonant
experiment only (2 orders of magnitude more intense than the
1572 cm
−1mode; notice the break in vertical scale in Fig.
3
a, b).
This mode actually corresponds to the low-frequency oscillation
readily observed in 1 in Fig.
2
e, g up to the 1 ps time scale, i.e.,
after the impulsive S
1decay as also confirmed by the analysis in
Fig.
3
c. In previous TA experiments on 1 with a resonant, 80 fs,
pump pulse, the same oscillation was also observed with similar
amplitude relative to the overall TA signal, and attributed to a
coherent nuclear motion in S
015,16. The present comparison
between on- and off-resonant excitation (with pulse durations
now much shorter than the ca. 400 fs period of the vibrational
mode) demonstrates that the 80 cm
−1oscillation observed in 1 is
not due to ISRS, but results from the reactive motion of the
population initially promoted to S
1. As a corollary, the vibrational
coherence initiated on S
1along this mode is preserved upon
decay to S
0. Remarkably, in E-2, the 80 cm
−1mode is not
detected. Instead an intense vibrational activity is observed at 232
cm
−1. However, it is quenched upon decay to S
0as illustrated in
Fig.
3
d meaning that this is the signature of an S
1vibrational
coherence which is not transferred to S
0.
Quantum chemical modeling and mechanistic interpretation.
The above experimental data lead us to the following conclusions:
(i) the S
080 cm
−1mode of compound 1 is activated exclusively
via S
1coherent nuclear motion and the coherence is preserved
upon impulsive decay through the CInt. (ii) The removal of the
methyl group on C5 quenches the impulsive S
1decay as well as
the signatures of vibrational coherence spanning both the S
1and
S
0PESs. We now provide a mechanistic interpretation of these
points. Firstly, both crystallographic (see Supplementary Figs
1
80 232 456 651 736 1574 100
a
c
d
b
10 0.1 ps 0.3 ps 1 0 0 500 0.1 0.1 0.1 0.2 0.2 Monoexp. fits 232 cm–1 651 cm–1 736 cm–1 1574 cm–1 456 cm–1 0.3 0.3 t0 (ps) t0 (ps) 0.4 0.4 0.5 0.5 0.6 0.6 1 1000 1500 (cm–1) 0 500 1000 1500 (cm–1) 3 2 0 0 500 1000 1500 1312 1090 1261 (cm–1) 100 1 0 1 P o w er spectr a (a.u.) P o w er spectr a (a.u.) 100 1 1 0 0 500*
*
*
*
*
*
*
*
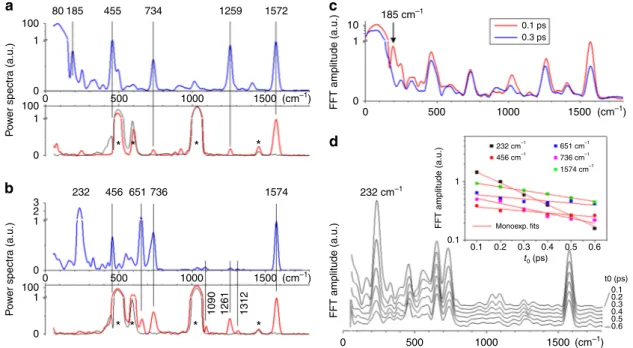
1000 1500 (cm–1) 0 185 455 734 1259 1572 185 cm–1 232 cm–1 FFT amplitude (a.u.) FFT amplitude (a.u.) FFT amplitude (a.u.)Fig. 3 Vibrational coherence spectroscopy of compoundsZ-1 and E-2. The power spectra of the differential absorption ΔA oscillatory residuals revealed in Fig.2g, h are averaged over the 350–470 nm probing window and displayed in a for Z-1 and b for E-2. The spectra are normalized to 1 at the C=C stretch frequency of 1572 or 1574 cm−1. The vertical scale is linear from 0 to 1 and logarithmic above 1. They reveal the frequencies of the modes in which vibrational wave packets are observed upon resonant excitation at 400 nm (blue spectra). The same analysis is performed on the data acquired upon off-resonance excitation at 800 nm (red spectra). The black spectra correspond to off-resonant excitation of the pure methanol solvent. Stars indicate the vibrational signatures of the solvent or fused silica cuvette.c The same Fourier analysis of theZ-1 oscillatory residuals is performed now on a sliding, 1-ps long time window starting att0= 0.1 ps (red spectrum) or t0= 0.3 ps (blue spectrum) i.e., respectively before and after impulsive decay. The dominant 80 cm−1mode persists. The 185 cm−1feature instead disappears upon decay to S0, but it seems too narrow to represent an oscillatory signal, which would last for only 250 fs, which questions its significance and interpretation, especially in the proximity of the very intense 80 cm−1mode.d Same as c, forE-2, with t0starting times ranging from 0.1 to 0.6. The inset displays the semilog plot of the FFT amplitude of thefive dominating modes at 232, 456, 651, 736, 1564 cm−1, as a function oft0, and the corresponding monoexponential decayfits. While the amplitude of all higher-frequency modes decay on the 600 to 1200 fs time scale, the damping of the 232 cm−1mode is observed to occur on a significantly faster 230 fs time scale, in line with the 300 fs excited state lifetime ofE-2
and
2
) and computed room-temperature structures in methanol
solution (see Supplementary Notes
1
and
2
, and Supplementary
Figs
3
–
5
) show that the reactive C1ʹ=C4 bond is pre-twisted in
Z-1
but substantially planar in E-2, as illustrated in Fig 4a, b.
Sec-ondly, the nuclear motion initiated in the spectroscopically
allowed S
1state of Z-1 and E-2 is dramatically different. Indeed,
as displayed in Fig.
4
c, the energy profiles along the FC trajectory
of Z-1 show that, similar to 11-cis PSBR in Rh
11, the system
evolves along a steep S
1PES reaching a Cint rapidly. More
pre-cisely, the vibrational wavepacket, whose center is assumed to
Me 1.36 (1.38) Å –177° (–179°) 1.48 (1.46) Å 1.36 (1.41) Å 1.48 (1.42) Å 1.45 (1.40) Å 1.48 (1.43) Å Ph Ph Me Me Me Me 14° (23°) 15° Z-1 E-2 5
a
c
d
b
3 180 S3 S2 S1 S0 160 140 120 100Energy (kcal mol
–1) Charge (a.u.) C9’-C1’=C4-C3 and N-C2-C4 dihedr al (deqrees) 80 FC FC FC Clnt S3 S2 S1 S0 FC Clnt +180° 3 4 5 N+ 3 4 5 N + 60 40 20 0 180 160 140 120 100
Energy (kcal mol
–1) 80 60 40 20 0 1 0.8 0.6 0.4 0.2 0 Charge (a.u.) 1 0.8 0.6 0.4 0.2 0 80 0.08 0.06 0.04 0.02 0.00 BLA (Å) –0.02 –0.04 –0.06 –0.08 –0.10 0.08 0.06 0.04 0.02 0.00 BLA ( Å ) –0.02 –0.04 –0.06 –0.08 –0.10 60 40 20 0 –20 –40 C9’-C1’=C4-C3 and N-C2-C3-C4 dihedr al (deqrees) 80 60 40 20 0 –20 –40 0 50 100 150 Time (fs) 200 250 0 50 100 150 Time (fs) 200 250 3 5 –177° 9’ 9’ 2’ 2’
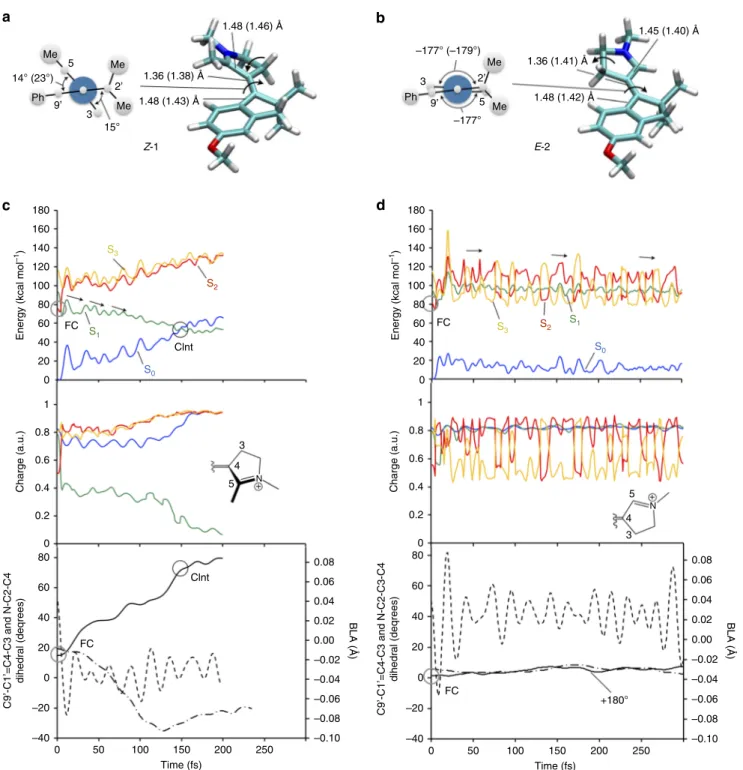
Fig. 4 Mechanistic interpretation of the influence of the methyl substitution on C5. a, b Structure of the computed S0free energy minima ofZ-1 and E-2 in methanol at room temperature and values of their relevant structural parameters. The values for the corresponding S1energy minima are given in parenthesis and the values of the C9ʹ–C1ʹ=C4–C3 and C2ʹ–C1ʹ=C4–C3 torsional parameters are given in the Newman projections on the left. A comparison with the available observed crystallographic parameters is given in Supplementary Fig.2.c, d Computed S1trajectories ofZ-1 and E-2, respectively, in methanol solution, illustrated by (top panels) the S0, S1, and S2CASPT2//CASSCF/6-31G*/Amber energy profiles, (middle panels) the changes in electronic structure along the trajectories in terms of the fractional positive charge remaining on the pyrroline moiety of the switch, and (bottom panels) the progression along the reaction coordinate described through skeletal double-bond stretching (BLA, dashed line), out-of-plane deformation of the pyrroline ring (reflected by the =N–C2–C3–C4- dihedral, dashed-dotted line), double-bond twisting (C9ʹ–C1′=C4–C3, full line). FC indicates the configurations of a and b. CInt indicates a conical intersection point. Notice the slow progression of E-2 along both twisting and out-of-plane deformation coordinates
move along the FC trajectory (see Methods section), would decay
along a segment of the intersection space containing an infinite
number of Cint’s
32. In contrast with Z-1, E-2 shows, after a fast
initial relaxation, a progression along
flat and quasi-degenerate
PESs consistently with an ineffective stretching-torsion coupling
(Fig.
4
d and Supplementary Figs
6
–
8
). This behavior is consistent
with the S
1/S
2crossing detected along the PES for E-2 but not for
Z-1 (see Supplementary Note
3
and Supplementary Figs
6
and
7
).
The same electronic effect was documented in a comparative
study of Rh and microbial rhodopsins
33, where the longer S
1lifetime of microbial rhodopsins is attributed to a crossing and
re-crossing of nearly degenerate S
1and S
2states. It is thus apparent
that the steric hindrance and the pre-twisting introduced by the
C5-substituent induce the following: (i) a dominating Z
config-uration in S
0and (ii) a separation of the S
1, S
2and S
3states. Also,
a charge transfer character analog to the visual pigment is
observed in Z-1, whereas in E-2 the intertwining S
1, S
2and S
3states produces an oscillating electronic character modulated by
the ethylenic stretch (see Fig.
4
d and Supplementary Fig.
6
).
The analogy between synthetic and biological systems can also
be extended to the S
1reaction coordinate. According to our
calculations (see Fig.
4
c, d bottom panels as well as
Supplemen-tary Figs
8
and
9
), within the
first 10 fs, only a high-frequency
stretching mode is activated. Then, in 1 only, large out-of-plane
ring deformations coupled to the central bond twisting are
activated, which result in the rotation of the pyrrolinium ring
relative to the indanone moiety. Such a coordinate is responsible
for the effective breaking of the
π-bond at the electronic level and
parallels the one documented for Rh
12. More specifically, the
NAIP C1′=C4 twisting is straightforwardly associated with the
C11=C12 twisting of the Rh chromophore, while the NAIP
five-membered ring inversions, i.e., C2′ and C3 carbon-out-of-plane
motions, mimic the hydrogen-out-of-plane motions of
the
HC11=C12H moiety of the Rh chromophore (Fig.
1
a, b). The
reaction coordinate will continue after decay to S
016, leading to
the coherent population of the prominent 80 cm
−1mode
demonstrated here. Whether or not vibrational coherence is also
preserved along the ring inversion motions remains speculative,
since the corresponding sign of vibrational activity, expected in
the 200–350 cm
−1range (also not activated in the off-resonance
experiments), is possibly activated by the S
1motion in 1, but
remains close to the noise level in the present experiment
(Fig.
3
c).
Discussion
In conclusion, by using vibrational coherence spectroscopy and
quantum chemical simulations, we have shown that the S
1force
field of Z-1 triggers a ballistic reactive motion towards the CInt and
decay to S
0. In a statistical ensemble of molecules in solution at
room temperature, the observation of vibrational coherence in the
photoproduct requires a degree of synchronization between all
decay events in the ensemble, which demonstrates the ballistic
motion and indicates that such motion is poorly affected by the
initial nuclear velocities at ambient temperature. In contrast, E-2
experiences a more diffusive motion towards the CInt. The
corre-sponding loss of synchronization would then explain the observed
loss of ensemble coherence. This interpretation leads to the
hypothesis that while Z-1 replicates the coherent dynamics that
controls the Rh photochemistry, such a regime is not present in
E-2, demonstrating that the observed biomimetic behavior can be
switched off. Furthermore, the documented Z-1 and E-2
contrast-ing regimes (Fig.
5
) provide a parallel between molecular switches
and rhodopsin photoreceptors shedding new light on the
mechanism by which Rh itself may optimize its photoisomerization.
Apart from the two seminal examples of vibrationally coherent
triiodide photodissociation
34and Rh photoisomerization
6,
unam-biguous observation of reaction-induced vibrational coherences
were reported in other photoreactions such as e.g., ultrafast low- to
high-spin transition in an iron II molecular complex
35or
ring-opening in a molecular dyad
36. However, in the latter two cases,
the vibrational coherence was interpreted as being transferred to
low-frequency modes not directly related to the reaction
coor-dinate. Here we demonstrate that the onset (i.e., turning on or
off) of a vibrationally coherent reactive motion can be induced via
chemical modification and change in equilibrium geometry. This
provides the opportunity to precisely control the decay event and,
likely, to increase the presently low photoproduct quantum yield
of NAIPs (Φ = 0.20%)
13,14or other retinal derivatives. Indeed, as
previously proposed
12, the conservation of a precise phase
rela-tionship between the HOOP and C11=C12 twisting modes of Rh
would be responsible for its high
Φ value (Φ = 67%)
5. Thus,
assuming a biomimetic behavior, a coherent motion would be a
pre-requisite for achieving the optimal phase relationship
between the C1′=C4 twisting and five-membered ring inversion
in NAIPs and, in turn, for improving their photoisomerization
efficiency. Notice, that this scenario is in contrast with the
pre-vious suggestion that
Φ would correlate monotonously with the
reaction speed according to the Landau-Zener model
6,17,37.
Finally, the control, via a chemical modification, of geometric and
electronic effects appears a valid general strategy for coherently
populating the torsional motion of other C=C isomerizing
compounds.
Methods
Experimental. Compounds 1 or 2 were synthesized as previously reported13,26. The isomer content of the samples in the dark at room temperature was deter-mined to be>97% Z for 1 and 95% E for 2, by prior1H-NMR spectroscopy in deuterated methanol.
Vibrational coherence spectroscopy is performed by recording TA data with an experimental set-up described in detail in ref.18. In short, we use a 1 kHz amplified Ti:Sa laser system delivering 3 mJ, 40 fs, 800 nm pulses. About 1 mJ of the fundamental pulse is injected in a neon-filled hollow fiber (Imperial College Consultants) where non-linear, guided propagation induces spectral broadening and generates the structured, red to IR spectrum displayed in Fig.1d. Subsequent pulse compression using chirped mirrors results in a ~0.5 mJ, 6 fs pulse used for off-resonant excitation. Type II sum frequency generation of this 6 fs pulse with the fundamental 800 nm pulse generates the 45-nm broad pulse centered at 400 nm and used for resonant excitation. The FWHM duration of the latter blue pulse is measured to be 8.5 fs by implementing 2D spectral shearing interferometry (2DSI) 38,39. Before TA experiments, the duration of either pump pulse is optimized directly in the sample byfine tuning group velocity dispersion with a pair of fused silica wedges (in combination with the chirped mirrors) so as to generate a white
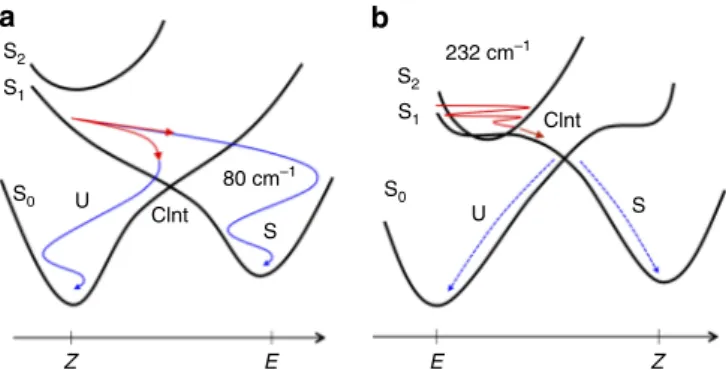
S2 S2 S S S1 S1 U
a
b
Z E E Z U Clnt Clnt 80 cm–1 232 cm–1 S0 S0Fig. 5 Coherent and incoherent isomerization motions in the CInt vicinity. a, b Schematic representations of the S0, S1and S2PES’s (black solid curves) ofZ-1 and E-2, respectively, with the illustration of the vibrationally coherent (solid colored lines) or incoherent (dashed colored lines) reactive motions in the S1(in red) or S0(in blue) PES’s. Two decay channels corresponding respectively to successful (S) or aborted (U) isomerizations are shown
light supercontinuum in the solvent (methanol) with minimum pump intensity. Then the pump intensity is further reduced to 50 nJ per pulse to perform the actual experiments on the compounds.
As a probe pulse for TA spectroscopy we use a chirped, white light supercontinuum generated in CaF2. Half the intensity of this pulse is used as a reference beam. Both probe and reference spectra are acquired with a prism spectrometer equipped with two CCD cameras operated at a 1-kHz acquisition frequency (commercial acquisition system by Entwicklungsbüro G. Stresing, Berlin). The reference spectrum is used to normalize the probe spectrum. Pump and probe beams are focused and overlapped in the liquid sample. The pump beam is chopped at 500 Hz, such that two successive probe spectra are used to compute the pump-induced absorption change, i.e., TA spectrum, of the sample. A 500-μm-travel piezoelectric transducer (PT) on the pump beam optical path is continuously oscillating at a 0.5-Hz period to scan the pump-probe delay. The instantaneous PT position is acquired in synchronicity with probe and reference spectra at 1 kHz, which allows us to assign a specific pump-probe delay to each probe spectrum. The TA experiments are performed on 1.3 mM MeOH solutions of compounds 1 or 2 circulated with a peristaltic pump in a 0.2 mm-thickflow cell having 0.2-mm-thick fused silica windows (Hellma).
Before globalfitting and fast Fourier transformation (FFT) of the residuals, the TA data sets are processed to correct for wavelength dependence of the time origin, induced by the chirp in the white light probe pulse. The signal recorded in the pure solvent is used to characterize the chirp for this purpose. The data at time delays shorter than 0.1 ps are disregarded in the analysis (globalfit and FFT) because they are dominated by the pump-probe cross-modulation signal generated upon coherent interaction of both beams with the solvent. The oscillations (Fig.2g, h) are most pronounced in the 350–470 nm probing window, resonant with the reactant (S0), excited state (S1), and photoproduct (S0) absorptions.
Computational. The 300 K Boltzmann distribution of Z-1 and E-2 in methanol has been simulated by combining40the Average Solvent Electrostatic Configuration (ASEC) model41and the free energy gradient method proposed by Nagaoka et al.42. A representative Franck-Condon structure has then been obtained by energy minimization of the ASEC snapshot with the excitation energy closest to the average (Supplementary Notes1and2, and Supplementary Figs3–543.
Excited state PES mapping (see Supplementary Fig.6) and trajectory calculations have been performed using the CASPT2//CASSCF(12,11)/6-31G*/ Amber quantum mechanics/molecular mechanics protocol available through the MOLCAS-Tinker interface44,45. The results of Fig.4are confirmed at the XMCQDPT2 level (Supplementary Note3and Supplementary Fig.7). The FC trajectories of 1 and 2, i.e., trajectories that start from S0equilibrium geometries with zero initial velocities, are released from the computationally assigned spectroscopic state (see Supplementary Note2and Supplementary Fig.5). As argued for other rhodopsin-like model compounds46,47, and consistently with the PES scans (Supplementary Fig.6), FC trajectories are assumed to represent the initial (i.e., within few hundred femtoseconds) excited state motion of the center of the vibrational wavepacket.
Data availability. The data that support thefindings of this study are available from the corresponding authors upon reasonable request.
Received: 5 June 2017 Accepted: 15 December 2017
References
1. Scholes, G. D., Fleming, G. R., Olaya-Castro, A. & van Grondelle, R. Lessons from nature about solar light harvesting. Nat. Chem. 3, 763–774 (2011). 2. Christensson, N., Kauffmann, H. F., Pullerits, T. & Mančal, T. Origin of
long-lived coherences in light-harvesting complexes. J. Phys. Chem. B 116, 7449–7454 (2012).
3. Scholes, G. D. et al. Using coherence to enhance function in chemical and biophysical systems. Nature 543, 647–656 (2017).
4. Schoenlein, R., Peteanu, L., Mathies, R. & Shank, C. Thefirst step in vision: femtosecond isomerization of rhodopsin. Science 254, 412–415 (1991). 5. Dartnall, H. J. A. The photosensitivities of visual pigments in the presence of
hydroxylamine. Vision. Res. 8, 339–358 (1968).
6. Wang, Q., Schoenlein, R. W., Peteanu, L. A., Mathies, R. A. & Shank, C. V. Vibrationally coherent photochemistry in the femtosecond primary event of vision. Science 266, 422–424 (1994).
7. Polli, D. et al. Conical intersection dynamics of the primary photoisomerization event in vision. Nature 467, 440–U88 (2010).
8. Johnson, P. J. M. et al. Local vibrational coherences drive the primary photochemistry of vision. Nat. Chem. 7, 980–986 (2015).
9. Schnedermann, C., Liebel, M. & Kukura, P. Mode-specificity of vibrationally coherent internal conversion in rhodopsin during the primary visual event. J. Am. Chem. Soc. 137, 2886–2891 (2015).
10. González-Luque, R. et al. Computational evidence in favor of a state, two-mode two-model of the retinal chromophore photoisomerization. Proc. Natl Acad. Sci. 97, 9379–9384 (2000).
11. Frutos, L. M., Andruniow, T., Santoro, F., Ferre, N. & Olivucci, M. Tracking the excited-state time evolution of the visual pigment with multiconfigurational quantum chemistry. Proc. Natl Acad. Sci. USA 104, 7764–7769 (2007).
12. Schapiro, I. et al. The Ultrafast photoisomerizations of rhodopsin and bathorhodopsin are modulated by bond length alternation and HOOP driven electronic effects. J. Am. Chem. Soc. 133, 3354–3364 (2011).
13. Lumento, F. et al. Quantum chemical modeling and preparation of a biomimetic photochemical switch. Angew. Chem. Int. Ed. 46, 414–420 (2007).
14. Sinicropi, A. et al. An artificial molecular switch that mimics the visual pigment and completes its photocycle in picoseconds. Proc. Natl Acad. Sci. 105, 17642–17647 (2008).
15. Briand, J. et al. Coherent ultrafast torsional motion and isomerization of a biomimetic dipolar photoswitch. Phys. Chem. Chem. Phys. 12, 3178–3187 (2010).
16. Léonard, J. et al. Mechanistic origin of the vibrational coherence accompanying the photoreaction of biomimetic molecular switches. Chem. A Eur. J. 18, 15296–15304 (2012).
17. Cheminal, A. et al. 100 fs photo-isomerization with vibrational coherences but low quantum yield in Anabaena Sensory Rhodopsin. Phys. Chem. Chem. Phys. 17, 25429–25439 (2015).
18. Gueye, M., Nillon, J., Crégut, O. & Léonard, J. Broadband UV-Vis vibrational coherence spectrometer based on a hollowfiber compressor. Rev. Sci. Instrum. 87, 093109 (2016).
19. Liebel, M., Schnedermann, C., Wende, T. & Kukura, P. Principles and Applications of Broadband Impulsive Vibrational Spectroscopy. J. Phys. Chem. A 119, 9506–9517 (2015).
20. Chesnoy, J. & Mokhtari, A. Resonant impulsive-stimulated Raman scattering on malachite green. Phys. Rev. A. 38, 3566–3576 (1988).
21. Ruhman, S., Joly, A. G. & Nelson, K. A. Coherent molecular vibrational motion observed in the time domain through impulsive stimulated Raman scattering. Quantum Electron., IEEE J. 24, 460–469 (1988).
22. Fragnito, H. L., Bigot, J. Y., Becker, P. C. & Shank, C. V. Evolution of the vibronic absorption spectrum in a molecule following impulsive excitation with a 6 fs optical pulse. Chem. Phys. Lett. 160, 101–104 (1989).
23. Pollard, W. T., Lee, S. Y. & Mathies, R. A. Wave packet theory of dynamic absorption spectra in femtosecond pump–probe experiments. J. Chem. Phys. 92, 4012–4029 (1990).
24. Dexheimer, S. L. et al. Femtosecond impulsive excitation of nonstationary vibrational states in bacteriorhodopsin. Chem. Phys. Lett. 188, 61–66 (1992). 25. Dhar, L., Rogers, J. A. & Nelson, K. A. Time-resolved vibrational spectroscopy
in the impulsive limit. Chem. Rev. 94, 157–193 (1994).
26. Dunkelberger, A. D. et al. Photoisomerization and relaxation dynamics of a structurally modified biomimetic photoswitch. J. Phys. Chem. A 116, 3527–3533 (2012).
27. Paolino, M. et al. Design, synthesis, and dynamics of a greenfluorescent protein fluorophore mimic with an ultrafast switching function. J. Am. Chem. Soc. 138, 9807–9825 (2016).
28. Schapiro, I. et al. Initial excited-state dynamics of an N-alkylated indanylidene–pyrroline (NAIP) rhodopsin analog. J. Phys. Chem. B 118, 12243–12250 (2014).
29. Pollard, W. T. & Mathies, R. A. Analysis of femtosecond dynamic
absorption spectra of nonstationary states. Annu. Rev. Phys. Chem. 43, 497–523 (1992).
30. Lee, S.-Y. & Heller, E. J. Time-dependent theory of Raman scattering. J. Chem. Phys. 71, 4777–4788 (1979).
31. Tanimura, Y. & Mukamel, S. Temperature dependence and non-Condon effects in pump–probe spectroscopy in the condensed phase. J. Opt. Soc. Am. B 10, 2263–2268 (1993).
32. Gozem, S. et al. Mapping the excited state potential energy surface of a retinal chromophore model with multireference and equation-of-motion coupled-cluster methods. J. Chem. Theory Comput. 9, 4495–4506 (2013).
33. Luk, H. L., Melaccio, F., Rinaldi, S., Gozem, S. & Olivucci, M. Molecular bases for the selection of the chromophore of animal rhodopsins. Proc. Natl Acad. Sci. 112, 15297–15302 (2015).
34. Banin, U. & Ruhman, S. Ultrafast photodissociation of I3. Coherent photochemistry in solution. J. Chem. Phys. 98, 4391–4403 (1993). 35. Consani, C. et al. Vibrational coherences and relaxation in the high-spin
state of aqueous [FeII(bpy)3]2+. Angew. Chem. Int. Ed. 48, 7184–7187 (2009).
36. Schweighofer, F. et al. Vibrational coherence transfer in an electronically decoupled molecular dyad. Sci. Rep. 5, 9368 (2015).
37. Bassolino, G. et al. Synthetic control of retinal photochemistry and photophysics in solution. J. Am. Chem. Soc. 136, 2650–2658 (2014).
38. Birge, J. R., Ell, R. & Kärtner, F. X. Two-dimensional spectral shearing interferometry for few-cycle pulse characterization. Opt. Lett. 31, 2063–2065 (2006). 39. Borrego-Varillas, R. et al. Optimized ancillae generation for ultra-broadband
two-dimensional spectral-shearing interferometry. J. Opt. Soc. Am. B 32, 1851–1855 (2015).
40. Bistafa, C., Georg, H. C. & Canuto, S. Combining ab initio multiconfigurational and Free Energy Gradient methods to study theπ–π* excited state structure and properties of uracil in water. Comput. Theor. Chem. 1040–1041, 312–320 (2014). 41. Coutinho, K., Rivelino, R., Georg, H. C. & Canuto, S. In: Solvation effects on
molecules and biomolecules: Computational methods and applications Canuto, S., Ed. Vol. 6, pp 159-189 (Springer, London, 2008).
42. Hirao, H., Nagae, Y. & Nagaoka, M. Transition-state optimization by the free energy gradient method: Application to aqueous-phase Menshutkin reaction between ammonia and methyl chloride. Chem. Phys. Lett. 348, 350–356 (2001). 43 Orozco-Gonzalez, Y. et al. An average solvent electrostatic configuration
protocol for Qm/mm free energy optimization: Implementation and application to rhodopsin systems. J. Chem. Theory Comput. 13, 6391–6404 (2017). 44. Melaccio, F., Olivucci, M., Lindh, R. & Ferré, N. Unique QM/MM potential
energy surface exploration using microiterations. Int. J. Quantum Chem. 111, 3339–3346 (2011).
45. Aquilante, F. et al. Molcas 8: new capabilities for multiconfigurational quantum chemical calculations across the periodic table. J. Comput. Chem. 37, 506–541 (2016).
46. Gozem, S. et al. Shape of multireference, equation-of-motion coupled-cluster, and density functional theory potential energy surfaces at a conical intersection. J. Chem. Theory Comput. 10, 3074–3084 (2014).
47. Manathunga, M. et al. Probing the photodynamics of rhodopsins with reduced retinal chromophores. J. Chem. Theory Comput. 12, 839–850 (2016).
Acknowledgements
We acknowledge the French Agence Nationale de la Recherche for support via grant No. ANR-11-JS04-010-01“IPQCS”, the “Investissement d’Avenir” program: Labex NIE ANR-11-LABX-0058_NIE, Labex CSC LABX-0026_CSC, Equipex UNION ANR-10-EQPX-52-01, the Région Alsace (Contrat doctoral, No. 607-12-C31), the Université de Strasbourg for a USIAS Fellowship, the NSF Grant No. CHE-1710191, and the Italian
MIUR for grant PRIN 2015. We acknowledge the Ohio Supercomputer Center, the Mésocentre of the Université de Strasbourg and CINECA for granted computer time.
Author contributions
M.G. and J.L. built the experimental set-up. M.G., D.A and J.L. acquired and analyzed the data. M.P. and S.F. synthesized the compounds. M.M. and Y.O. carried out the com-putational work. J.L., S.H. and M.O. wrote the paper.
Additional information
Supplementary Informationaccompanies this paper at https://doi.org/10.1038/s41467-017-02668-w.
Competing interests:The authors declare no competingfinancial interests Reprints and permissioninformation is available online athttp://npg.nature.com/ reprintsandpermissions/
Publisher's note:Springer Nature remains neutral with regard to jurisdictional claims in published maps and institutional affiliations.
Open Access This article is licensed under a Creative Commons Attribution 4.0 International License, which permits use, sharing, adaptation, distribution and reproduction in any medium or format, as long as you give appropriate credit to the original author(s) and the source, provide a link to the Creative Commons license, and indicate if changes were made. The images or other third party material in this article are included in the article’s Creative Commons license, unless indicated otherwise in a credit line to the material. If material is not included in the article’s Creative Commons license and your intended use is not permitted by statutory regulation or exceeds the permitted use, you will need to obtain permission directly from the copyright holder. To view a copy of this license, visithttp://creativecommons.org/ licenses/by/4.0/.