Relationship of white and gray matter abnormalities to clinical and
genetic features in myotonic dystrophy type 1
Stefano Zanigni
a,b, Stefania Evangelisti
a,b, Maria Pia Giannoccaro
b, Federico Oppi
c, Roberto Poda
c,
Antonio Giorgio
d, Claudia Testa
a,b, David Neil Manners
a,b, Patrizia Avoni
b,c, Laura Ludovica Gramegna
a,b,
Nicola De Stefano
d, Raffaele Lodi
a,b,⁎
, Caterina Tonon
a,b,1, Rocco Liguori
b,c,1aFunctional MR Unit, Policlinico S. Orsola– Malpighi, via Massarenti 9, 40138 Bologna, Italy
bDepartment of Biomedical and NeuroMotor Sciences, University of Bologna, via Ugo Foscolo 7, 40123 Bologna, Italy cIRCCS Istituto delle Scienze Neurologiche di Bologna, via Altura 3, 40139 Bologna, Italy
dDepartment of Medicine, Surgery and Neuroscience, University of Siena, v.le Bracci 2, 53100 Siena, Italy
a b s t r a c t
a r t i c l e i n f o
Article history:
Received 23 November 2015 Received in revised form 20 April 2016 Accepted 28 April 2016
Available online 03 May 2016
Background:Myotonic dystrophy type 1 (DM1) represents a multisystemic disorder in which diffuse brain white and gray matter alterations related to clinical and genetic features have been described. We aimed to evaluate in the brain of adult patients with DM1 (i) white and gray matter differences, including cortical-subcortical gray matter volume and cortical thickness and (ii) their correlation with clinical disability, global neuropsychological performance and triplet expansion.
Methods:We included 24 adult genetically-confirmed DM1 patients (14 males; age: 38.5 ± 11.8 years) and 25 age- and sex-matched healthy controls (14 males; age: 38.5 ± 11.3 years) who underwent an identical brain MR protocol including high-resolution 3D T1-weighted, axial T2 FLAIR and DTI sequences. All patients underwent an extensive clinical and neuropsychological evaluation. Voxel-wise analyses of white matter, performed by using Tract Based Spatial Statistics, and of gray matter, with Voxel-based Morphometry and Cortical Thickness, were carried out in order to test for differences between patients with DM1 and healthy controls (p b 0.05, corrected). The correlation between MRI measures and clinical-genetic features was also assessed.
Results:Patients with DM1 showed widespread abnormalities of all DTI parameters in the white matter, which were associated with reduced gray matter volume in all brain lobes and thinning in parieto-temporo-occipital cortices, albeit with less extensive cortical alterations when congenital cases were removed from the analyses. White matter alterations correlated with clinical disability, global cognitive performance and triplet expansions. Conclusion:In patients with DM1, the combined smaller overall gray matter volume and white matter alterations seem to be the main morpho-structural substrates of CNS involvement in this condition. The correlation of white matter differences with both clinical and genetic findings lends support to this notion.
© 2016 The Authors. Published by Elsevier Inc. This is an open access article under the CC BY-NC-ND license (http://creativecommons.org/licenses/by-nc-nd/4.0/).
Keywords:
myotonic dystrophy type 1 DTI
TBSS VBM
cortical thickness
1. Introduction
Myotonic dystrophy type 1 (DM1), also known as Steinert's myoton-ic dystrophy, is the most frequent inherited adult dystrophmyoton-ic myopathy due to a nucleotide expansion (CTG) in the DMPK gene mapped on chromosome 19q13.3 (Udd and Krahe, 2012). Studies regarding the pathogenetic mechanism hypothesized an accumulation of CUG-CCUG-containing transcripts within cell nuclei as ribonuclear inclusions that provoke the deregulation of numerous RNA binding factors, leading
to a dysregulation of alternative splicing of several genes encoding for proteins and channels fundamental for muscle and Central Nervous Sys-tem (CNS) activity (Meola and Cardani, 2015). This hypothesis is also supported by neuropathological findings and indeed the presence of CUG-containing RNA has been reported in DM1 cortical-subcortical neurons (Meola and Cardani, 2015). Moreover, neurofibrillary degener-ation with intraneuronal hyperphosphorilated Tau proteins has been reported in DM1 brain specimens (Sergeant et al., 2001; Meola and Cardani, 2015).
Disease onset is typically in the adult age and muscle weakness, myotonia, and cataracts represent the main clinical features, although the disease may frequently affect other organs and systems. In particu-lar, CNS involvement, characterized by mood and personality alter-ations, cognitive impairment, sleep disturbances, is quite common during disease course (Udd and Krahe, 2012; Caillet-Boudin et al.,
⁎ Corresponding author at: Functional MR Unit, Policlinico S. Orsola – Malpighi, Department of Biomedical and NeuroMotor Sciences (DiBiNeM), University of Bologna, Via Massarenti 9, 40138 Bologna, Italy.
E-mail address:[email protected](R. Lodi).
1 Contributed equally.
http://dx.doi.org/10.1016/j.nicl.2016.04.012
2213-1582/© 2016 The Authors. Published by Elsevier Inc. This is an open access article under the CC BY-NC-ND license (http://creativecommons.org/licenses/by-nc-nd/4.0/).
Contents lists available atScienceDirect
NeuroImage: Clinical
2014). Previous conventional studies of magnetic resonance imaging (MRI) showed diffuse brain alterations in DM1 patients such as lateral ventricle dilatation, cortical and subcortical gray matter atrophy and leukodystrophy, prevalent in the anterior temporal lobes ( Caillet-Boudin et al., 2014).
In the last decade, advanced MRI studies demonstrated across brain a widespread white matter disruption and a multifocal gray matter vol-ume loss by using various single MRI techniques, including Diffusion Tensor Imaging (DTI), and Voxel-Based Morphometry (VBM), with cor-relations found between corresponding quantitative MRI parameters and triplet expansion, neuropsychological tests and the severity of mus-cular involvement (Antonini et al., 2004; Giorgio et al., 2006; Ota et al., 2006; Weber et al., 2010; Minnerop et al., 2011; Wozniak et al., 2011; Franc et al., 2012; Wozniak et al., 2013; Caso et al., 2014; Wozniak et al., 2014; Serra et al., 2015; Schneider-Gold et al., 2015).
The aim of our study was to evaluate the extent of white and gray matter alterations in the brain of patients with DM1 compared to healthy controls by using multimodal voxel-wise methods, such as TBSS, VBM and vertex-based cortical thickness (CT) analysis, and there-fore to highlight possible correlations of these quantitative MRI mea-sures with clinical and genetic data.
2. Materials and methods 2.1. Subjects
We enrolled 24 genetically confirmed DM1 patients (14 males; age [mean ± SD]: 38.5 ± 11.8 years; age at onset: 22.3 ± 12.8 years, range: 0–53 years; disease duration: 16.2 ± 10.8 years, range: 1–
36 years) and 25 age- and sex-matched healthy controls (14 males; age: 38.5 ± 11.3 years). Demographic and clinical features of patients and controls are reported inTable 1.
Patients were enrolled at the neuromuscular outpatients unit of the U.O. Clinica Neurologica, IRCCS Istituto delle Scienze Neurologiche di Bologna, by neurologists expert in neuromuscular disorders (RoL). Con-trols, matched to patients for age and sex, were selected among a sam-ple of healthy volunteers, enrolled among University and Hospital workers and their relatives, that underwent brain MRI in order to obtain normative values for quantitative MRI parameters for clinical and re-search purposes.
Clinical diagnosis was genetically confirmed and CTG triplet expan-sion sizes were determined in all patients. Depending on the number of repeat expansions, patients were divided into classes E1 (mild phenotype, 50–150 CTG repeats), E2 (adult classical form, 150–1000 CTG repeats) or E3 (congenital disease, more than CTG 1000 repeats) (Contardi et al., 2012).
An extensive neurological examination and a disability scale for DM1 created by Contardi and colleagues, investigating neuropsycholog-ical (maximum score = 20), motor (maximum score = 35), myotonia (maximum score = 12) and daily life activity (maximum score = 15) areas were performed in all patients, with a total score ranging from 0 (normal) to 82 (worst condition) (Contardi et al., 2012).
Moreover, all patients underwent a neuropsychological assessment including Mini Mental State Examination (MMSE) (Folstein et al., 1975; Measso et al., 1993), Wechsler Adult Intelligence Scale (WAIS) 3rd edition (Wechsler, 1997) with Verbal Intelligence score (VIQ) and non-verbal performance score (PIQ), Brief Mental Deterioration Battery (BMDB) (Gallassi et al., 1986) including Rey's 15 word test, Immediate
Table 1
Demographic and clinical features of study sample.
Myotonic dystrophy 1 patients (n = 24) Controls (n = 25) p
Age (years) (mean ± SD) 38.5 ± 11.8 38.5 ± 11.3 n.s.
Sex (M) 14 14 n.s.
Age at onset (years) [mean ± SD (range)] 22.3 ± 12.8 (0–53) Disease duration (years) [mean ± SD (range)] 16.2 ± 10.8 (1–36) Education (years) (mean ± SD) 10.0 ± 2.8 CTG triplet expansion size category
E1 4
E2 13
E3 7
Clinical scale scores [median (range)]
Neuropsychological area 3 (0–16)
Motor area 11 (0−23)
Myotonia area 7 (0−12)
Daily-life activities area 2.5 (0–9)
Total score 23 (1–59)
Neuropsychological evaluation N Score (mean ± SD) Normal values cut offs % of patients with pathological scores Corrected MMSE score 21 27.0 ± 2.7 N23.8Measso et al. (1993) 9.5%
BMDB final result 20 1.6 ± 0.9 N0Gallassi et al. (1986, 2002) 0% - Rey's 15 word test (short term) 20 45.8 ± 8.9 N28.53Carlesimo et al. (1996) 0% - Rey's 15 word test (long term) 20 9.8 ± 2.3 N4.69Carlesimo et al. (1996) 0% - Immediate Visual Memory test 20 17.9 ± 3.0 N13.85Carlesimo et al. (1996) 10.0% - Barrage Test 20 11.0 ± 2.0 N9Carlesimo et al. (1996) 10.0% - Simple analogies 20 16.4 ± 2.6 N15.1Gallassi et al. (1986, 2002) 20.0% Total WAIS score 17 81.6 ± 20.6 N70Wechsler (1997) 29.4% - Verbal Intelligence score 17 83.9 ± 18.8 N70 (Wechsler, 1997) 29.4% - Non-verbal performance score 17 82.9 ± 19.8 N70Wechsler (1997) 29.4% Verbal Fluency test 20 33.4 ± 12.8 N17.35Carlesimo et al. (1996) 10.0% Stroop Test (reaction time - seconds) 20 30.4 ± 22.5 b36.91Caffarra et al. (2002) 20.0% Wisconsin Card Sorting Test 19
- Corrected perseverative responses 19 23.8 ± 29.7 b42.60Laiacona et al. (2000) 15.8% - Corrected non-perseverative errors 19 18.3 ± 16.8 b29.90Laiacona et al. (2000) 26.3% - Categories completed 19 4.2 ± 2 No cut-off
- Learning to learn 19 −0.6 ± 5.7 N0.00Tarter (1973) 50.0% - Corrected total score 19 67.4 ± 40.1 b90.50Laiacona et al. (2000) 36.8%
Legend. SD: standard deviation; M: males; MMSE: Mini Mental State Examination; BMDB: Brief Mental Deterioration Battery; WAIS: Wechsler Adult Intelligence Scale – 3rd edition; WCST: Wisconsin Card Sorting Test.
Visual Memory (IVM) test, Barrage Test (BT) and simple analogies (SA) test, Verbal Fluency test (Novelli et al., 1986), Stroop Test (Stroop, 1935) and Wisconsin Card Sorting Test (WCST) (Laiacona et al., 2000). All the tests scores were normalized by correction for age and education. 2.2. Brain MRI acquisition and analysis protocol
MRI scans were acquired on a 1.5-T GE Signa scanner equipped with a quadrature birdcage head coil.
All patients and controls underwent a standardized brain MRI protocol including the following sequences: a 3D high-resolution T1-weighted fast spoiled gradient echo (FSPGR; TR = 12 ms, TE = 5 ms, 1 mm isotropic resolution), an axial T2-weighted fluid-attenuated inversion recovery (FLAIR; TE = 84.8 ms, TR = 8000 ms, 0.9375 mm in-plane resolution, 3 mm slice thickness) and, finally, DTI (TR = 10.000 ms, TE = 87.5 ms, 25 directions, b-value = 900 mm2s−1, axial
oblique FOV = 32 cm, 1.25 mm reconstructed in-plane resolution, 4 mm slices thickness).
2.3. White matter lesions segmentation and filling
In order to quantify patients' white matter lesion load, a semi-automatized threshold-based segmentation of white matter lesions has been performed on T2-weighted FLAIR images by using Jim soft-ware (Version 7.0, Xinapse Systems, Northants, UK,http://www. xinapse.com).
For each subject T2-weighted FLAIR images were co-registered onto T1-weighted 3D images FLIRT (Jenkinson and Smith, 2001; Jenkinson et al., 2002), part of the Oxford FMRIB Software Library [FSL],www. fmrib.ox.ac.uk(Smith et al., 2004) using the boundary-based registra-tion (BBR) method and the transformaregistra-tion matrix was used to register the lesion map onto the T1-weighted 3D images, applying a nearest-neighbor interpolation method to keep the mask intact during spatial transformation (Greve and Fischl, 2009). In order to improve the ac-curacy of brain volume measurements thereafter by reducing inten-sity contrast within known lesion areas, the FSL lesion filling tool (Battaglini et al., 2012) was applied to the T1-weighted 3D images using the co-registered lesion masks.
2.4. TBSS analysis
DTI data underwent standard pre-processing and processing, all of them performed with FMRIB Diffusion Toolbox (FDT part of FSL) (Behrens et al., 2003). In particular, DTI images were corrected for movements and distortions caused by eddy currents with a linear regis-tration to non-diffusion volumes. After brain extraction (BET, Brain Ex-traction Tool) (Smith, 2002), a voxel-by-voxel fitting of diffusion tensor model using dtifit was performed, in order to obtain maps of fractional anisotropy (FA), axial diffusivity (AD), radial diffusivity (RD) and mean diffusivity.
Voxelwise statistical analysis of the FA data was carried out using TBSS (Tract-Based Spatial Statistics) (Smith et al., 2006), also part of FSL. All subjects' FA data were aligned into a common space using the nonlinear registration tool FNIRT (Andersson et al., 2007a,b), which uses a b-spline representation of the registration warp field (Rueckert et al., 1999). Next, the mean FA image was created and thinned to create a mean FA skeleton, which represents the centers of all tracts common to the group. Each subject's aligned FA data was then projected onto this skeleton and the resulting data fed into voxelwise cross-subject sta-tistics. FA skeleton was created by using a threshold at a value of 0.2 to exclude voxels with low FA values, which are likely to include gray mat-ter or cerebrospinal fluid (CSF). Voxelwise statistical analysis was per-formed on AD, RD and MD data as well, by using the transformations and the template previously obtained for FA data.
2.5. Voxel-based morphometry analysis
All the gray matter structural analyses were performed on the T1-weighted 3D images after lesion filling.
Structural data was analyzed with FSL-VBM (Douaud et al., 2007), an optimized VBM protocol (Good et al., 2001) carried out with FSL tools. First, structural images were brain-extracted and gray matter-segmented before being registered onto the MNI 152 standard space using non-linear registration (Andersson et al., 2007b). The resulting images were averaged and flipped along the x-axis to create a left-right symmetric, study-specific gray matter template. Second, all native gray matter images were non-linearly registered to this study-specific template and “modulated” to correct for local expansion (or contrac-tion) due to the non-linear component of the spatial transformation. The modulated gray matter images were then smoothed with an isotro-pic Gaussian kernel with a sigma of 3 mm (corresponding to a FWHM of about 7 mm).
2.6. Cortical thickness analysis
Cortical reconstruction and cortical thickness measurement were performed with the FreeSurfer 4.4.0 image analysis suite, and a detailed description of preprocessing and processing is available athttp://surfer. nmr.mgh.harvard.edu/. Concisely, after skull-stripping and intensity correction, the gray-white matter boundary for each cortical hemi-sphere (with tissue intensity and neighborhood constraints) was iden-tified. Then the surface boundary was tessellated to generate multiple vertices across the whole brain, and inflated. The expansion of the resulting gray matter surface created the pial surface with a point-to-point correspondence, and spherical morphing and spherical registra-tion to an atlas were performed. Cortical thickness was computed by using the methods developed by Fishl and Dale (Fischl and Dale, 2000). Cortical maps were finally smoothed with a 10-mm FWHM Gaussian kernel.
2.7. Statistical analysis
We performed a Spearman correlation test in order to evaluate the correlation between white matter lesion volume, Total Intracranial Volume (TIV)-corrected lateral ventricle volume and clinical-genetic variables.
For both TBSS and VBM analyses, a voxel-wise General Linear Model (GLM) was applied to compare DM1 group and healthy controls group by using the FSL's tool (randomise) for nonparametric permutation in-ference on neuroimaging data (Winkler et al., 2014), performing 5000 permutations. Results were corrected for multiple comparisons across space, controlling the family-wise error (FWE) and applying TFCE (threshold-free cluster enhancement) (Smith and Nichols, 2009). TBSS comparisons were performed within a white matter skeletonized mask (obtained during TBSS processing stream), and VBM comparisons were performed within a gray matter mask (obtained during FSL-VBM processing). The same method was applied to perform voxel-wise cor-relations with clinical variables.
Vertex-by-vertex multiple linear regression analysis (surface equiv-alent of voxel-wise analysis) was carried out to compare CT in DM1 pa-tients and healthy controls, and to investigate the relationship between regional CT and clinical-genetic variables, including neuropsychological tests (corrected MMSE score, VIQ, PIQ and WAIS total score, BMDB final result and the corrected results of its subtests, Verbal Fluency test corrected score, reaction time at Stroop test, WCST scores (persever-ative responses, non-persever(persever-ative errors, categories completed, learning to learn, global score)). Statistical maps were generated using FreeSurfer's QDEC 1.5 (Query, Design, Estimate, Contrast) interface. Analysis was performed over the whole brain surface and Monte Carlo simulation was conducted to correct for multiple com-parisons on the significant clusters, using a cluster-wise threshold
of p b 0.05. As for nuisance regressors, age and sex were added for TBSS analysis, while age, sex and total intracranial volume (TIV), using estimated TIV from the Freesurfer processing stream, were added for VBM and CT analysis.
Comparisons were also performed with a homogeneous sub-sample of DM1 patients constituted only by the classical and juvenile DM1 cases (n = 17, age (mean ± SD) 39.3 ± 12.5 years, 10 M), i.e. excluding congenital cases (E3, n = 7), compared to a sub-group of age- and sex-matched healthy controls (n = 17, age (mean ± SD) 39.3 ± 12.4 years, 10 M).
3. Results
3.1. Clinical and genetic features
All patients, except one, who was without motor impairment, presented muscular symptoms including myotonia (23/24 patients) and muscle weakness (21/24 patients).
As regards genetic classification of patients, 4 belonged to E1, 13 to E2 and 7 to E3 classes. Mean (±standard deviation - SD) education of cases was 10.0 ± 2.8 years. The results of the sub-sections of the clinical scale [median (range)] were 3 (0–16) for the neuropsychological area, 11 (0–23) for the motor area, 7 (0–12) for the myotonia area, 2.5 (0– 9) for the daily-life activities area with a median (range) total score of 23 (1–59) (Table 1).
In three patients out of 24, full neuropsychological evaluation was not performed: two patients refused to undergo neuropsychological testing while one patient's general conditions were too poor to allow the neuropsychological assessment. Among the other 21 cases, corrected MMSE score (mean ± SD) was 27.0 ± 2.7 with 2 cases with a score lower than 23 (both belonging to the E3 category); final result of BMDB scale was 1.6 ± 0.9 with no patients displaying pathological results (b0), and total IQ score was 81.6 ± 20.6, with 8 patients with a score between 50 and 79 (Table 1), with five belonging to E3 and two to E2 category. The results of the other neuropsychological tests are reported inTable 1.
Overall, our DM1 subjects demonstrated no significant memory def-icits, while the scores of the test investigating executive functions, i.e. reasoning ability and shifting cognitive strategies (WCST), and a mean total IQ score were at the lower limits of the normal range. Additionally, motor impairment did not systematically interfere with test perfor-mance in our sample, as can be seen from the results showing a lower performance in the test exploring cognitive domains not related to motor ability (i.e., WCST), and from the absence of evident discrepan-cies between IQ verbal and performance scores.
3.2. Conventional brain MRI
No patients or controls were excluded from the analysis because of a suboptimal quality of T2-, T1-weighted and DTI sequences. Eleven pa-tients out of 24 showed mild to moderate cortical atrophy and/or mild to severe lateral ventricle enlargement. Five out of 24 DM1 patients and all control subjects showed no white matter signal alterations at conventional brain MRI, while the other 19 showed supratentorial white matter T2-hyperintensities with a mean lesion load of 17. 2 ± 27.5 cm3. In the 19 DM1 patients with white matter lesions, we found
a direct correlation between white matter lesion load and age at evalu-ation (r = 0.644, p = 0.003) and an inverse correlevalu-ation with corrected MMSE score (r = −0.487, p = 0.48).
The correlation analysis between TIV-corrected lateral ventricle vol-ume and clinical, neuropsychological and genetic features failed to yield significant results, after Bonferroni correction for multiple comparisons. 3.3. TBSS
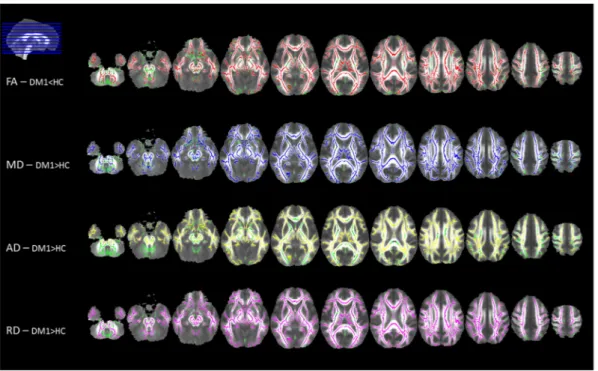
White matter voxel-wise comparison performed by using TBSS showed a widespread significant lower FA and higher MD, AD and RD in patients compared to controls (p b 0.05, corrected) (Fig. 1
and supplementary Tables 1.1–1.4). The TBSS analysis including only cases in categories E1 and E2 led to similar results (supplemen-tary Figure 1).
The analysis of the correlations among MRI-derived white matter integrity parameters and clinical-genetic features demonstrated a
Fig. 1. Tract-based spatial statistics (TBSS) group comparison results, displayed at p b 0.05 corrected for multiple comparisons. Voxel-wise differences between myotonic dystrophy type 1 (DM1) patients and healthy controls (HC) are shown for fractional anisotropy (FA; in red, decreased in patients), mean diffusivity (MD; in blue, higher in patients), axial diffusivity (AD; in yellow, higher in patients) and radial diffusivity (RD; in violet, higher in patients) values. All statistical maps are overlaid on the group mean FA image and on the white matter skeleton mask (green). Images are shown in radiological convention. (For interpretation of the references to color in this figure legend, the reader is referred to the web version of this article.)
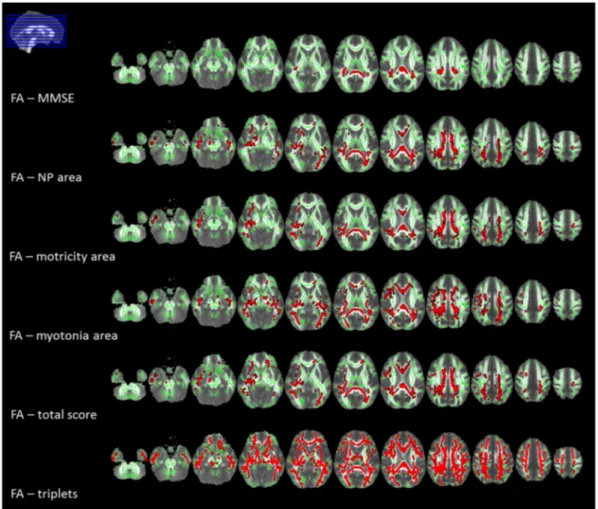
significant correlation between MMSE corrected score and DTI metrics in the splenium and the posterior part of the body of the corpus callosum (CC), posterior corona radiata and posterior
thalamic radiations, bilaterally and the right retrolenticular part of the internal capsule (p b 0.05, corrected) (Fig. 2and supplementary Table 2.1).
Fig. 2. Tract-based spatial statistics (TBSS) correlations results, displayed at p b 0.05 corrected for multiple comparisons. Voxel-wise correlations between fractional anisotropy (FA) values and clinical variables in myotonic dystrophy type 1 (DM1) patients are shown in red. The correlations are all inverse, except for FA - MMSE which showed a direct correlation. All statistical maps (with tracts thickened for visualization purposes) are overlaid on the group mean FA image and on the white matter skeleton mask (green). Images are shown in radiological convention. Legend. MMSE: Mini-Mental State Examination; NP: neuropsychological. (For interpretation of the references to color in this figure legend, the reader is referred to the web version of this article.)
Fig. 3. Voxel-based morphometry (VBM) group comparison results displayed at p b 0.05 corrected for multiple comparisons. Voxel-wise differences between myotonic dystrophy type 1 (DM1) patients and healthy controls are displayed with (1-p) values in red-to-white. Areas of gray matter atrophy are overlaid on the group gray matter template and shown in radiological convention. (For interpretation of the references to color in this figure legend, the reader is referred to the web version of this article.)
As regards the clinical scale, all DTI metrics in the CC (genu, body and splenium), supero-posterior corona radiata, posterior thalamic radia-tions, external capsule and superior longitudinal fasciculus correlated with neuropsychological, motor, myotonia areas and with the total score (p b 0.05, corrected) (Fig. 2and supplementary Tables 2.2–2.5). No correlations were found between DTI metrics and daily life activities area. Moreover, we found a correlation between triplet expansion size and white matter DTI parameters, diffuse to all white matter tracts in supra- and infratentorial compartments (p b 0.05, corrected) (Fig. 2
and supplementary Table 2.6). We found no correlation between DTI metrics and the other neuropsychological tests. No correlation with clinical, neuropsychological or genetic data and white matter disruption was found when considering E1 and E2 cases alone.
3.4. VBM
Compared to healthy controls, patients presented a bilateral signifi-cant smaller gray matter quantity in subcortical regions such as thala-mus, hippocampus, putamen and caudate, and in cingulate, frontal, parietal, occipital, insular and temporal cortices (p b 0.05, corrected) (Fig. 3and supplementary Tables 3.1–3.3). Considering patients within genetic categories E1 and E2, VBM analysis showed a comparable atrophy of subcortical gray matter, while cortical gray matter atrophy was of smaller extent (supplementary Figure 2).
We found no significant correlations of VBM results with clinical-genetic data.
3.5. Cortical thickness
Compared to controls, DM1 patients presented a significant lower CT in lateral-occipital cortex bilaterally, in the right precentral and in the left superior-parietal, superior-temporal and fusiform cortices (p b 0.05, corrected) (Fig. 4and supplementary Table 4). The analysis performed on E1 and E2 cases only showed a smaller cortical thickness differences compared to controls, restricted to portions of the left fusiform, lingual and inferior temporal gyri (supplementary Fig. 3).
No significant correlations between CT and clinical-genetic variables were found.
4. Discussion
Diffuse brain white and gray matter alterations in 24 adult DM1 patients were found on conventional brain MRI and voxel-wise MRI data analysis methods.
Nineteen out of 24 patients presented the neuroimaging hallmarks of DM1, i.e. multiple T2-hyperintense white matter lesions associated with different degrees of lateral ventricle enlargement, ranging from mild to severe. Our conventional imaging data are consistent with pre-vious studies showing brain alterations in DM1 (Antonini et al., 2004; Giorgio et al., 2006; Ota et al., 2006; Weber et al., 2010; Minnerop et al., 2011; Wozniak et al., 2011; Franc et al., 2012; Wozniak et al., 2013; Caso et al., 2014; Wozniak et al., 2014; Serra et al., 2015), although, compared to previous studies that quantified white matter lesion load (Antonini et al., 2004; Caso et al., 2014; Serra et al., 2015), our patients presented a more severe white matter involvement, in absence of overall significant cognitive deficits.
Moreover, we found a correlation between white matter lesion load, age at evaluation and MMSE corrected score. In addition, previous stud-ies demonstrated a significant correlation between white matter lesion load and clinical and genetic data (Caso et al., 2014; Serra et al., 2015), indicating that its quantification plays a fundamental role in order to better characterize the patient sample and to increase voxel-wise anal-ysis accuracy.
In addition, we confirmed a significant correlation among white and gray matter disruption, assessed by TBSS, VBM and CT analysis, global motor and cognitive functioning, and triplet expansion size.
Although previous studies evaluated gray and white matter in-tegrity in patients with DM1 by using VBM and TBSS, and demon-strated a correlation with clinical and genetic data (Minnerop et al., 2011; Caso et al., 2014; Serra et al., 2015; Schneider-Gold et al., 2015), our study is the first in which both a CT analysis and a VBM approach have been applied to the same group of DM1 in order to better investigate the different contribution of CT alter-ations and global gray matter density.
Moreover, to our knowledge, this is the first study in patients with DM1 that applies a semi-automatic lesion refilling method before performing both VBM and CT analysis, while a previous study applied a fully automated lesion refilling pipeline to VBM in DM1 and DM2 patients (Schneider-Gold et al., 2015). It has been demonstrated that le-sion refilling in patients with diffuse white matter alterations increases accuracy of VBM analysis (Ceccarelli et al., 2012). The comparison between DM1 patients and controls showed a diffuse disruption of white matter with a correlation with genetic severity, i.e. triplet expansion.
In addition, in order to evaluate if diffuse brain white and gray matter alterations could influence clinical disability, we investigat-ed the correlation between TBSS, CT analysis and VBM results and global motor and cognitive functioning measured by a clinical scale investigating neuropsychological, motor, myotonic symptoms and daily life activities (Contardi et al., 2012) and MMSE, a scale that is widely used to assess global cognitive functioning.
To our knowledge, no volumetric MR studies investigated the asso-ciation between myotonia severity and brain alterations. Only one fMRI study investigated CNS correlates of myotonia in 16 patients with DM1. It was found a bigger BOLD signal in the supplementary motor area and in the dorsal anterior cingulate cortex during myotonia phase, suggesting a role of high-order motor control areas in the genesis of this phenomenon (Toth et al., 2015). Interestingly, in our sample the severity of myotonia correlated with a diffuse white matter alteration involving also the posterior limb of the internal capsule, the corona radiata adjacent to motor areas and the splenium CC (Fig. 2). White matter differences in the same regions correlated also with the “motor area” score of the clinical scale (Fig. 2).
In addition, cognitive performance, assessed by MMSE and the neu-ropsychological area of the clinical scale, showed a correlation with
Fig. 4. Group comparison results of cortical thickness (CT) analysis displayed at p b 0.05, corrected for multiple comparisons. Whole brain vertex-wise differences of cortical thickness between myotonic dystrophy type 1 (DM1) patients and healthy controls are displayed with −log10(p) values. Areas of gray matter thinning are overlaid on a reference gray matter surface; left hemisphere is shown on right and right hemisphere on left; lateral view on top and medial view at bottom.
callosal alterations, in particular in the posterior part of the body, isthmus and splenium.
The results of our VBM analysis showed diffuse gray matter alter-ations in DM1 patients compared to controls, involving subcortical and cortical regions belonging to all lobes, while CT analysis showed a prevalent involvement of parietal-occipital regions. As previously reported, VBM analysis returns a general and mixed measure of gray matter volume, which combines different structural properties, such as CT, surface area and cortical folding (Hutton et al., 2008). However, these properties are essentially independent from each other. CT analy-sis offers a direct examination of a physical property of the cortex, providing information about the morphometric characteristics of the cortex. Nevertheless, CT analysis is necessarily constrained to the cortex, while VBM can be used to detect differences in sub-cortical gray matter as well. It is advantageous to combine these two techniques considering the complementary nature of the two methods, in order to obtain more comprehensive information about brain structure. The analyses of both CT and VBM have been simultaneously applied to the same sample of subjects in normal aging (Hutton et al., 2009) and other neurologic and psychiatric diseases, such as psychosis (Benetti et al., 2013), schizo-phrenia (Palaniyappan and Liddle, 2012), Parkinson's disease (Pereira et al., 2012), Alzheimer's disease (Lehmann et al., 2011), major depres-sive disorder (Koolschijn et al., 2010), autism (Hyde et al., 2010), and, overall, consistent results between the two techniques were observed, gaining complementary information about patterns of brain atrophy.
Taking into account these considerations, the interpretation of our results regarding cortical gray matter integrity may be that a smaller CT in DM1 plays a predominant role in parietal-occipital regions, while in frontal and temporal cortices other features, such as surface area and cortical folding, may be responsible for the alterations detected by VBM analysis.
The alterations in posterior associative fibers, i.e. splenium of CC, posterior thalamic radiations, posterior part of corona radiata, and in the parietal-occipital gray matter in which a decrease of gray matter volume due principally to CT was evident in our sample, are significant-ly correlated to a worse motor and cognitive performance, and may ex-plain cognitive deficits and personality alterations that are generally described in DM1 patients. Previous studies in DM1 patients found an association between cognitive performance and posterior associative fi-bers. In particular, posterior callosal fibers, that are more resistant to damage because they myelinate early during brain development, are re-lated to cognitive dysfunction (Di Paola et al., 2015). Moreover callosal alterations have been related to personality alterations, possible due to an altered hemispheric integration (van der Knaap and van der Ham, 2011).
We also confirmed smaller subcortical gray matter volume, in partic-ular of hippocampus, thalamus and striate nucleus, compared to con-trols. Previous neuropathological and neuroimaging studies detected alterations in the basal ganglia and hippocampus (Vermersch et al., 1996; Ota et al., 2006; Oyamada et al., 2006; Itoh et al., 2010; Weber et al., 2010; Minnerop et al., 2011; Caso et al., 2014). These regions are involved in motor control and cognitive functioning and their alter-ations may contribute to the development of CNS involvement signs.
Notably, we found a correlation between clinical and genetic fea-tures with white matter disruption but not with gray matter alterations. The clinical relevance of white matter disruption has been seen in other previous studies on DM1 (Minnerop et al., 2011; Caso et al., 2014) and are suggestive of a primarily white matter involvement in DM1 with a secondary gray matter involvement. These hypotheses are also support-ed by the results obtainsupport-ed after the exclusion of cases with more severe genetic lesions (E3), showing white matter and subcortical gray matter alterations with milder cortical alterations. Moreover, the association between white matter alterations and global cognitive performance, observed when considering all genetic categories, was no longer signif-icant after the exclusion of E3 class. This finding is in line with a previous study indicating that cognitive performance is related to callosal
alterations only in the congenital cases (Hashimoto et al., 1995). A study by Giorgio and colleagues, however, showed diffuse atrophy of the neocortex in DM1 patients without or with minimal white matter alterations (Giorgio et al., 2006). One limitation of the study is repre-sented by the higher educational level of controls compared to patients that may partially explain the differences in brain structure. Although our results showed a lower performance in a test exploring cognitive domains that are not related to motor ability (i.e., WCST) and no dis-crepancies between IQ verbal and performance scores were evident, the performance of some tests included in the neuropsychological battery, such as Stroop test, may be affected by motor impairment, and therefore, this potential confounder has to be taken into account when interpreting the results.
In addition, our study may present some technical limitations, due to the fact that the data were collected within a typical clinical framework: lesion filling is restricted to lesions larger that 3 mm along the z direc-tion; diffusion weighted images are characterized by low spatial resolu-tion and non isotropic voxels; the intensity of the static magnetic field is relatively low (1.5 T). Despite these limitations, we believe that our evaluation of both white matter and gray matter integrity in the same cohort of DM1 patients, correlated with clinical and genetic aspects, is robust and the results provide an insight into the physiopathology of the disease.
5. Conclusions
DM1 is a multisystemic disorder in which CNS involvement, correlated with clinical and genetic severity, is characterized by diffuse alterations extending to all white matter tracts in supra-and infratentorial compartments, as demonstrated by TBSS analy-sis, and to cortical-subcortical gray matter, as evidenced by VBM and cortical thickness analysis. Globally, our results indicate the complexity of CNS involvement in DM1 and further longitudinal studies are needed to clarify it.
Appendix A. Supplementary data
Supplementary data to this article can be found online athttp://dx. doi.org/10.1016/j.nicl.2016.04.012.
References
Andersson, J.L.R., Jenkinson, M., Smith, S., 2007a. Non-linear optimisation. Technical Re-port TR07JA1, FMRIB, Department of Clinical Neurology. Oxford University, Oxford, UK (Available at)http://www.fmrib.ox.ac.uk/analysis/techrep(for downloading). Andersson, J.L.R., Jenkinson, M., Smith, S., 2007b. Non-linear registration, aka spatial
nor-malization. Technical Report TR07JA2, FMRIB. Department of Clinical Neurology, Ox-ford University, OxOx-ford, UK (Available at)http://www.fmrib.ox.ac.uk/analysis/ techrep(for downloading).
Antonini, G., Mainero, C., Romano, A., et al., 2004.Cerebral atrophy in myotonic dystro-phy: a voxel based morphometric study. J. Neurol. Neurosurg. Psychiatry 75 (11), 1611–1613.
Battaglini, M., Jenkinson, M., De Stefano, N., 2012.Evaluating and reducing the impact of white matter lesions on brain volume measurements. Hum. Brain Mapp. 33 (9), 2062–2071.
Behrens, T.E.J., Woolrich, M.W., Jenkinson, M., et al., 2003.Characterization and propaga-tion of uncertainty in diffusion-weighted MR imaging. Magn. Reson. Med. 50 (5), 1077–1088.
Benetti, S., Pettersson-Yeo, W., Hutton, C., et al., 2013.Elucidating neuroanatomical alter-ations in the at risk mental state and first episode psychosis: a combined voxel-based morphometry and voxel-based cortical thickness study. Schizophr. Res. 150 (2–3), 505–511.
Caffarra, P., Vezzadini, G., Dieci, F., Zonato, A., Venneri, A., 2002.Una versione abbreviata del test di Stroop: dati normativi nella popolazione italiana. Nuova Rivista di Neurologia 12 (4), 111–115.
Caillet-Boudin, M.L., Fernandez-Gomez, F.J., Tran, H., et al., 2014.Brain pathology in myotonic dystrophy: when tauopathy meets spliceopathy and RNAopathy. Front. Mol. Neurosci. 6, 57.
Carlesimo, G.A., Caltagirone, C., Gainotti, G., 1996.The mental deterioration battery: nor-mative data, diagnostic reliability and qualitative analyses of cognitive impairment. The Group for the Standardization of the mental deterioration battery. Eur. Neurol. 36 (6) (378.84).
Caso, F., Agosta, F., Peric, S., et al., 2014.Cognitive impairment in myotonic dystrophy type 1 is associated with white matter damage. PLoS ONE 9 (8), e104697.
Ceccarelli, A., Jackson, J.S., Tauhid, S., et al., 2012.The impact of lesion in-painting and reg-istration methods on voxel-based morphometry in detecting regional cerebral gray matter atrophy in multiple sclerosis. Am. J. Neuroradiol. 33 (8), 1579–1585.
Contardi, S., Pizza, F., Falzone, F., et al., 2012.Development of a disability scale for myoton-ic dystrophy type 1. Acta Neurol. Scand. 125 (6), 431–438.
Di Paola, M., Phillips, O., Orfei, M.D., et al., 2015.Corpus callosum structure is topograph-ically correlated with the early course of cognition and depression in Alzheimer's dis-ease. J. Alzheimers Dis. 45 (4), 1097–1108.
Douaud, G., Smith, S., Jenkinson, M., et al., 2007.Anatomically related grey and white mat-ter abnormalities in adolescent-onset schizophrenia. Brain 130, 2375–2386.
Fischl, B., Dale, A.M., 2000.Measuring the thickness of the human cerebral cortex from magnetic resonance images. Proc. Natl. Acad. Sci. 97 (20), 11050–11055.
Folstein, M., Folstein, S.E., McHugh, P.R., 1975.“Mini-mental state” a practical method for grading the cognitive state of patients for the clinician. J. Psychiatr. Res. 12 (3), 189–198.
Franc, D.T., Muetzel, R.L., Robinson, P.R., et al., 2012.Cerebral and muscle MRI abnormal-ities in myotonic dystrophy. Neuromuscul. Disord. 22 (6), 483–491.
Gallassi, R., Lenzi, P., Stracciari, A., et al., 1986.Neuropsychological assessment of mental deterioration: purpose of a brief battery and a probabilistic definition of “normality” and “non-normality”. Acta Psychiatr. Scand. 74 (1), 62–67.
Gallassi, R., Morreale, A., Di Sarro, R., Lorusso, S., 2002.Value of clinical data and neuropsy-chological measures in probable Alzheimer's disease. Arch. Gerontol. Geriatr. 2002 (34), 123–134.
Giorgio, A., Dotti, M.T., Battaglini, M., et al., 2006.Cortical damage in brains of patients with adult-form of myotonic dystrophy type 1 and no or minimal MRI abnormalities. J. Neurol. 253 (11), 1471–1477.
Good, C.D., Johnsrude, I.S., Ashburner, J., Henson, R.N., Friston, K.J., Frackowiak, R.S., 2001.
A voxel-based morphometric study of ageing in 465 normal adult human brains. NeuroImage 14, 21–36.
Greve, D.N., Fischl, B., 2009.Accurate and robust brain image alignment using boundary-based registration. NeuroImage 48 (1), 63–72.
Hashimoto, T., Tayama, M., Miyazaki, M., et al., 1995.Neuroimaging study of myotonic dystrophy. I. Magnetic resonance imaging of the brain. Brain Dev. 17 (1), 24–27.
Hutton, C., De Vita, E., Ashburner, J., Deichmann, R., Turner, R., 2008.Voxel-based cortical thickness measurements in MRI. NeuroImage 40 (4), 1701–1710.
Hutton, C., Draganski, B., Ashburner, J., Weiskopf, N., 2009.A comparison between voxel-based cortical thickness and voxel-voxel-based morphometry in normal aging. NeuroImage 48 (2), 371–380.
Hyde, K.L., Samson, F., Evans, A.C., Mottron, L., 2010.Neuroanatomical differences in brain areas implicated in perceptual and other core features of autism revealed by cortical thickness analysis and voxel-based morphometry. Hum. Brain Mapp. 31 (4), 556–566.
Itoh, K., Mitani, M., Kawamoto, K., et al., 2010.Neuropathology does not correlate with regional differences in the extent of expansion of CTG repeats in the brain with myotonic dystrophy type 1. Acta Histochem. Cytochem. 43 (6), 149–156.
Jenkinson, M., Smith, S.M., 2001.A global optimisation method for robust affine registra-tion of brain images. Med. Image Anal. 5 (2), 143–156.
Jenkinson, M., Bannister, P.R., Brady, J.M., Smith, S.M., 2002.Improved optimisation for the robust and accurate linear registration and motion correction of brain images. NeuroImage 17 (2), 825–841.
Koolschijn, P.C., van Haren, N.E., Schnack, H.G., Janssen, J., Hulshoff Pol, H.E., Kahn, R.S., 2010.Cortical thickness and voxel-based morphometry in depressed elderly. Eur. Neuropsychopharmacol. 20 (6), 398–404.
Laiacona, M., Inzaghi, M.G., De Tanti, A., Capitani, E., 2000.Wisconsin card sorting test: a new global score, with Italian norms, and its relationship with the Weigl sorting test. Neurol. Sci. 21 (5), 279–291.
Lehmann, M., Crutch, S.J., Ridgway, G.R., et al., 2011.Cortical thickness and voxel-based morphometry in posterior cortical atrophy and typical Alzheimer's disease. Neurobiol. Aging 32 (8), 1466–1476.
Measso, G., Cavarzeran, F., Zappalà, G., et al., 1993.The mini-mental state examination: normative study of an Italian random sample. Dev. Neuropsychol. 9, 77–85.
Meola, G., Cardani, R., 2015.Myotonic dystrophies: an update on clinical aspects, genetic, pathology, and molecular pathomechanisms. Biochim. Biophys. Acta 1852 (4), 594–606.
Minnerop, M., Weber, B., Schoene-Bake, J.C., et al., 2011.The brain in myotonic dystrophy 1 and 2: evidence for a predominant white matter disease. Brain 134 (12), 3530–3546.
Novelli, G., Papagno, C., Capitani, E., et al., 1986.Tre test clinici di ricerca e produzione lessicale. Taratura su soggetti normal. Arch. Psicol. Neurol. Psichiatr. 47, 279–296.
Ota, M., Sato, N., Ohya, Y., et al., 2006.Relationship between diffusion tensor imaging and brain morphology in patients with myotonic dystrophy. Neurosci. Lett. 407 (3), 234–239.
Oyamada, R., Hayashi, M., Katoh, Y., Tsuchiya, K., Mizutani, T., Tominaga, I., et al., 2006.
Neurofibrillary tangles and deposition of oxidative products in the brain in cases of myotonic dystrophy. Neuropathology 26 (2), 107–114.
Palaniyappan, L., Liddle, P.F., 2012.Differential effects of surface area, gyrification and cor-tical thickness on voxel based morphometric deficits in schizophrenia. NeuroImage 60 (1), 693–699.
Pereira, J.B., Ibarretxe-Bilbao, N., Marti, M.J., et al., 2012.Assessment of cortical degenera-tion in patients with Parkinson's disease by voxel-based morphometry, cortical fold-ing, and cortical thickness. Hum. Brain Mapp. 33 (11), 2521–2534.
Rueckert, D., Sonoda, L.I., Hayes, C., Hill, D.L.G., Leach, M.O., Hawkes, D.J., 1999.Non-rigid registration using free-form deformations: application to breast MR images. IEEE Trans. Med. Imaging 18 (8), 712–721.
Schneider-Gold C, Bellenberg B, Prehn C, Krogias C, Schneider R, Klein J, et al., 2015 corti-cal and subcorticorti-cal grey and white matter atrophy in myotonic dystrophies type 1 and 2 is associated with cognitive impairment, depression and daytime sleepiness.s PLoS ONE 2015; 10(6): e0130352.
Sergeant, N., Sablonnière, B., Schraen-Maschke, S., et al., 2001.Dysregulation of human brain microtubule-associated tau mRNA maturation in myotonic dystrophy type 1. Hum. Mol. Genet. 10 (19), 2143–2155.
Serra, L., Petrucci, A., Spanò, B., et al., 2015.How genetics affects the brain to produce higher-level dysfunctions in myotonic dystrophy type 1. Funct. Neurol. 30 (1), 21–31.
Smith, S.M., 2002.Fast robust automated brain extraction. Hum. Brain Mapp. 17 (3), 143–155.
Smith, S.M., Nichols, T.E., 2009.Threshold-free cluster enhancement: addressing prob-lems of smoothing, threshold dependence and localisation in cluster inference. NeuroImage 44 (1), 83–98.
Smith, S.M., Jenkinson, M., Woolrich, M.W., et al., 2004.Advances in functional and struc-tural MR image analysis and implementation as FSL. NeuroImage 23 (S1), 208–219.
Smith, S.M., Jenkinson, M., Johansen-Berg, H., et al., 2006.Tract-based spatial statistics: voxelwise analysis of multi-subject diffusion data. NeuroImage 31, 1487–1505.
Stroop, J.R., 1935.Studies of interference in serial verbal reactions. J. Exp. Psychol. 18, 643.
Tarter, R.E., 1973.An analysis of cognitive deficits in chronic alcoholics. J. Abnorm. Soc. Psychol. 47, 546–551.
Toth, A., Lovadi, E., Komoly, S., et al., 2015.Cortical involvement during myotonia in myotonicdystrophy: an fMRI study. Acta Neurol. Scand. 132 (1), 65–72.
Udd, B., Krahe, R., 2012.The myotonic dystrophies: molecular, clinical, and therapeutic challenges. Lancet Neurol. 11 (10), 891–905.
van der Knaap, L.J., van der Ham, I.J., 2011.How does the corpus callosum mediate inter-hemispheric transfer? A review. Behav. Brain Res. 223 (1), 211–221.
Vermersch, P., Sergeant, N., Ruchoux, M.M., et al., 1996.Specific tau variants in the brains of patients with myotonic dystrophy. Neurology 47 (3), 711–717.
Weber, Y.G., Roebling, R., Kassubek, J., et al., 2010.Comparative analysis of brain structure, metabolism, and cognition in myotonic dystrophy 1 and 2. Neurology 74 (14), 1108–1117.
Wechsler, D., 1997.Wechsler Adult Intelligence Scale–. third ed. The Psychological Corpo-ration, San Antonio.
Winkler, A.M., Ridgway, G.R., Webster, M.A., Smith, S.M., Nichols, T.E., 2014.Permutation inference for the general linear model. NeuroImage 92, 381–397.
Wozniak, J.R., Mueller, B.A., Ward, E.E., Lim, K.O., Day, J.W., 2011.White matter abnormal-ities and neurocognitive correlates in children and adolescents with myotonic dystro-phy type 1: a diffusion tensor imaging study. Neuromuscul. Disord. 21 (2), 89–96.
Wozniak, J.R., Mueller, B.A., Bell, C.J., Muetzel, R.L., Lim, K.O., Day, J.W., 2013.Diffusion ten-sor imaging reveals widespread white matter abnormalities in children and adoles-cents with myotonic dystrophy type 1. J. Neurol. 260 (4), 1122–1131.
Wozniak, J.R., Mueller, B.A., Lim, K.O., Hemmy, L.S., Day, J.W., 2014.Tractography reveals diffuse white matter abnormalities in myotonic dystrophy type 1. J. Neurol. Sci. 341 (1–2), 73–78.