PhDTUTOR Prof. Marco Marcelli
~,u
~L;.,fa,
PhD COURSE COORDINATOR Prof. Daniele Canestrelli
Daniele Piazzolla PhDSTUDENT
BI0/07 PhDTHESIS
Distribution of trace metals in coastal sediments of the physiographical
unit Capo Linaro - Monte Argentario
Ecology and sustainable management of environmental resources - XXIX cycle PhD COURSE
TUSCIA UNIVERSITY
DEPARTMENT OF ECOLOGICALAND BIOLOGICAL SCIENCES (DEB)
UNNERSITÀ
Abstract
Trace metal pollution is a serious threat particularly in the marine environment.
In this context, the present work shows the spatial and temporal assessment of the pollution degree and potential toxicity of trace metal in marine sediments of the coastal area enclosed between Montalto di Castro and Capo Linaro, in northern Latium, Italy. The distribution pattern and pollution levels of As and Mn in surface sediments highlight two hotspots. These hotspots are due to the naturally high levels of As and Mn in the Mignone River and Marangone Stream as well as the intense human activity in the area including the Torrevaldaliga Nord power plant and the Port of Civitavecchia.
The high Hg concentrations detected in surface sediments confirm the extension of the Hg anomaly of the coastal area of northern Latium, profoundly influenced by the contributions of the Fiora and Mignone Rivers.
Trace metal concentrations detected in soft tissues of Paracentrotus lividus reflect the presence of the hotspots and describe a detectable level of bioaccumulation throughout the study area.
Furthermore, the temporal assessment carried out by the analysis of PT50 and MRG50 core samples taken in the southern sector of the study area shows the evolution of the sediment mass accumulation rate values and the trace metal values within the last 60 years.
CONTENTS Abstract 1 Contents 2 List of tables 5 List of figures 7 Acknowledgements 10 1. Introduction 11
2. Objectives and scope 14
3. Trace-Metal Enrichment and Pollution in Coastal Sediments
in the Northern Tyrrhenian Sea, Italy. 16
3.1 Abstract 18
3.2 Introduction 18
3.3 Materials and Methods 19
3.3.1 Study area 19
3.3.2 Sample Collection and Analysis 22
3.3.3 Trace-Metal Analysis 23
3.4 Results 26
3.5 Discussion 34
4. Mercury Enrichment in Sediments of the Coastal Area
of Northern Latium, Italy. 39
4.1 Abstract 40
4.2 Introduction 40
4.3 Materials and Methods 44
4.4 Results and Discussion 46
5. Concentrations of As, Cd, Cr, Ni, and Pb in the echinoid
Paracentrotus lividus on the coast of Civitavecchia, northern
Tyrrhenian Sea, Italy. 50
5.1 Abstract 52
5.2 Introduction 53
5.3 Materials and Methods 54
5.3.1 Paracentrotus lividus as a sentinel organism 54
5.3.2 Study area 55
5.3.2.1 Sedimentological and geochemical setting 56
5.3.3 Sample collection 63
5.3.4 Sample analysis 64
5.4 Results 65
5.5 Discussion 68
5.6 Conclusions 74
6. Temporal distribution of trace metals in recent sediments in
6.1.2 Sample analysis 79
6.2 Results and Discussion 79
6.2.1 Radionuclide measurements 79
6.2.2 Major and trace elements analysis 85
6.3 Conclusions 96
7. Overall conclusions 97
8. Future perspectives 99
List of tables
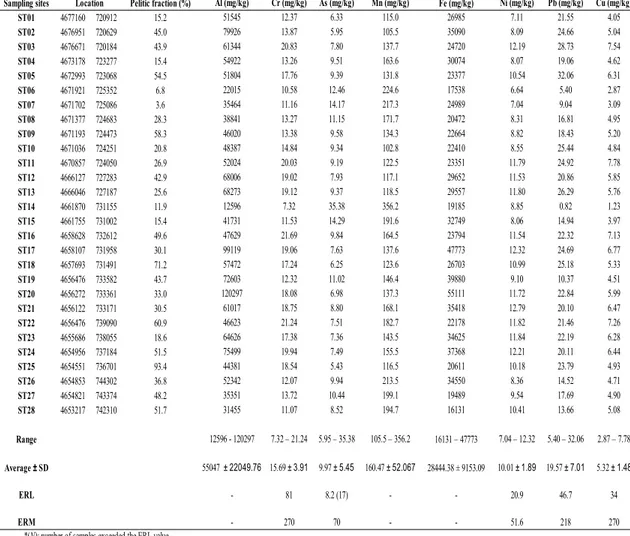
Table 1: This table shows the original data set, which includes the pelitic fraction
percentages for all surface sediment sampling stations, ranges, averages, standard deviations, ERL and ERM values of Al, Cr, As, Mn, Fe, Ni, Pb and Cu.
Table 2: Pearson’s correlation of normalized Cr, As, Mn, Fe, Ni, Pb and Cu values
detected in surcace sediment samples.
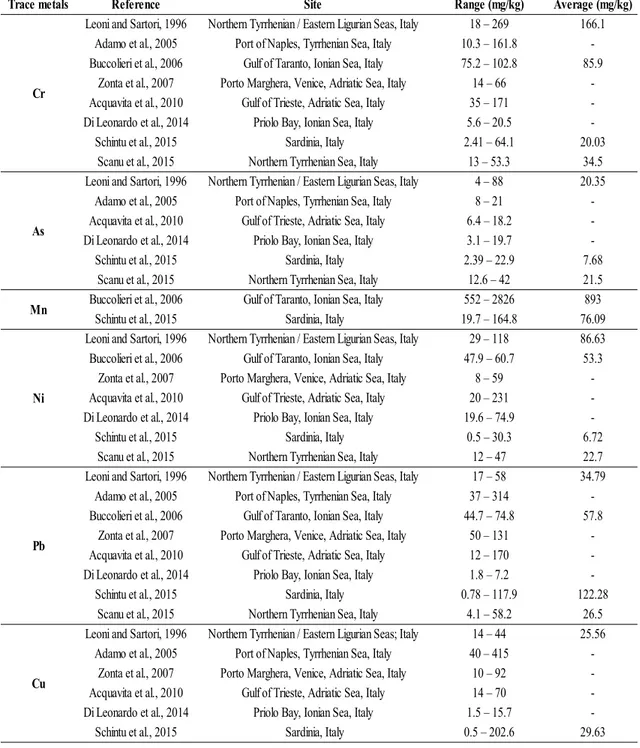
Table 3: Mean concentrations from the literature for Cr, As, Mn, Ni, Pb, and Cu (mg/kg)
in Italian coastal areas.
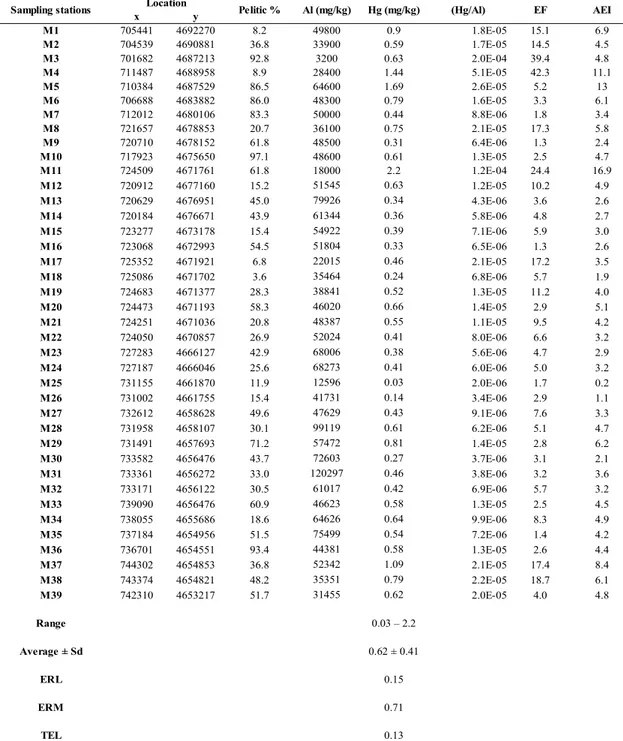
Table 4: This table reports the Hg values detected in surface sediment samples, the
pelitic fraction percentage, the Al values, the ratio Hg/Al, the Hg EF values and AEI values in the study area.
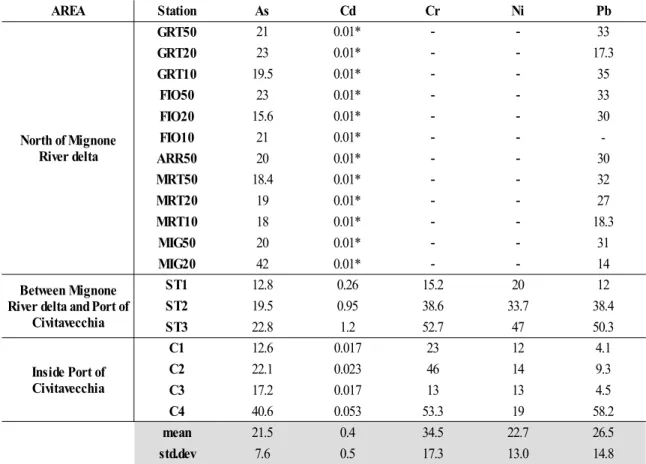
Table 5: As, Cd, Cr, Ni, and Pb concentrations in sediments from the study area (Scanu
2012; Molino 2013). Dashes indicate ‘‘not analyzed’’. *Values below detection limit.
Table 6: Sediment enrichment factors in the physiographic unit between Monte
Argentario and Capo Linaro.
Table 7: Classification of sediments found in the physiographic unit between Monte
Argentario and Capo Linaro, according to United States Environmental Protection Agency sediment quality guidelines criteria (Giesy and Hoke, 1990; Long and Morgan, 1990).
Table 9: Concentration of As, Cd, Cr, Ni, and Pb in P. lividus from the Civitavecchia
area.
Table 10: Literature mean concentrations of As, Cd, Cr, Pb, and Ni in P. lividus (mg/kg
dry weight, whole organism or soft tissues). Minima and maxima are in parentheses.
Table 11: Mean concentrations in P. lividus (Nascetti et al. 2011a, 2012b, modified). A is
a sampling point in the Tarquinia salt marsh north of Mignone River delta, B is a sampling point near the Mignone River delta, and C is a sampling point near sampling station R9.
Table 12: PT50 and MRG50 SARs values comparison with litterature data for the study
area.
Table 13: Al2O3, Fe2O3, As, Cr, Cu, Ni, Pb and Zn raw values and ERL – ERM, TEL – PEL values of the considered elements.
Table 14 A: Pearson's correlation among trace metal values measured in PT50 core. Table 14 B: Pearson's correlation among trace metal values measured in MRG50 core.
List of figures
Fig. 1: This figure shows the study area related to the surface sediment sampling
campaign. The study area is located in the northern Tyrrenian Sea in northern Latium.
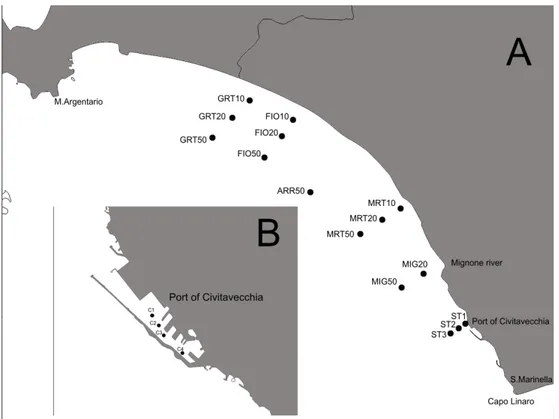
Fig. 2: Surface sediment sampling locations. Surface sediment samples are located
between -50 and -10 m were sampled.
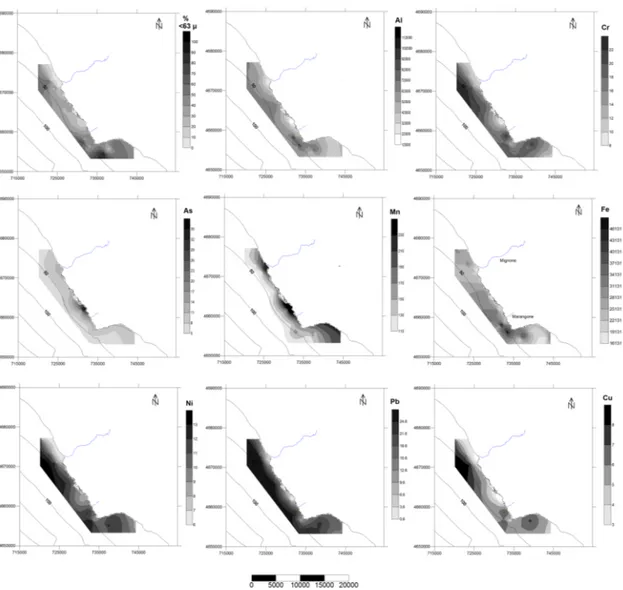
Fig. 3: Spatial distribution of the pelitic fraction percentage and Al, Cr, As, Mn, Fe, Ni,
Pb and Cu values.
Fig. 4: Spatial distributions of Cr, As, Mn, Fe, Ni, Pb and Cu EF values. Fig. 5: Spatial distributions of Cr, As, Mn, Fe, Ni, Pb and Cu Igeo values. Fig. 6: Spatial distribution of the potential toxicity response index (RI).
Fig. 7: As and Mn hotspots in the study area including the wind regime at the
Torrevaldaliga Nord site and mining waste deposits on the Marangone basin.
Fig. 8: Study area and sampling locations related to surface sediment samples campaign
for the study of Hg concentrations.
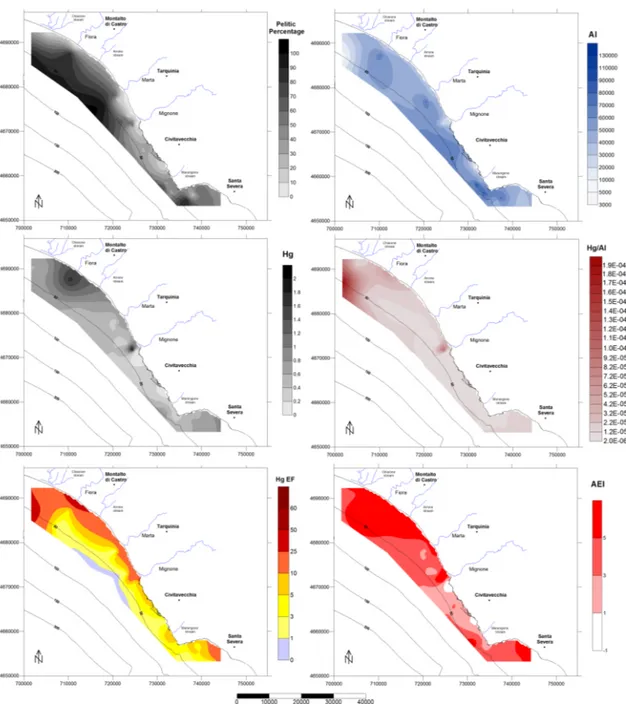
Fig. 9: Distribution pattern of pelitic percentage, Al (mg/kg), Hg (mg/kg), Hg/Al, EF,
and AEI in coastal sediments of northern Latium.
Fig. 11: Sediment samples from the physiographic unit between Monte Argentario and
Capo Linaro (A) and the port of Civitavecchia (B). (Scanu 2012, modified; Molino 2013, modified).
Fig. 12: Water samples from inside the port of Civitavecchia. Fig. 13: P. Lividus sampling plan.
Fig. 14: Concentrations (mg/kg) of As, Cd, Cr, Ni, and Pb in P. lividus from the
Civitavecchia coastal area.
Fig. 15: As hotspot between the Port of Civitavecchia and Marangone stream delta
(circle), winds at the Torrevaldaliga site, and locations of mine waste deposits.
Fig. 16: Spatial distribution of the sampling points in Nascetti et al. (2012b) and in this
study.
Fig. 17: Bayesian estimation supersedes the t-test analysis of trace metals comparing our
results with those of Nascetti et al. (2012b).
Fig. 18: PT50 and MRG50 core samples locations.
Fig. 19: Total 210Pb activity values and unsupported 210Pb values of PT50 and MRG50.
Fig. 20: CFCS model results for PT50 and MRG50 cores.
Fig. 21: SARs values obtained through the CRS model for PT50 and MRG50 cores. Fig. 22: 137Cs profile in MRG50 core.
Fig. 23 A: Trace metal values measured in PT50 core with respect to TEL and PEL values.
Fig. 23 B: Trace metal values measured in MRG50 core with respect to TEL and PEL values.
Fig. 24: Pearson's correlation between trace metal values and Al2O3 and Pearson's correlation between trace metal values and Fe2O3.
Fig. 25 A: Temporal distribution of As, Cr, Cu, Ni, Pb and Zn values normalized with
Al2O3 concentrations in PT50 core.
Fig. 25 B: Temporal distribution of As, Cr, Cu, Ni, Pb and Zn values normalized with
Acknowledgements
This thesis represents the culmination of my work into a topic which has been of interest to me for some 3 years. During this period I have had the priviledge of being supported by some excellent people who I pay my thanks to here.
Firstly thanks to my PhD tutor, Prof. Marco Marcelli, for his advice and support all the way from my graduate thesis to completion of this PhD.
Thanks all the guys of the Laboratory of Experimental Oceanology and Marine Ecology, University of Tuscia (DEB), always willing to help me in difficult times.
The results obtained during this years of PhD studies are fruit of the collaboration of several people who contributed to make this PhD possible.
In particular, I would like to thank Prof. Maria Violetta Brundo and all her staff (University of Catania, Italy) for the advice and the collaboration.
A big thanks goes to Prof. Ian Croudace of the National Oceanography Centre (Southampton, UK) and to all his staff for the great availability, the hospitality and the help that was given to me during the training experience at GAU laboratories.
This project probably would not have been possible without the help and support of Dr. Sergio Scanu for his incredibly practical and logical approach to teaching and guiding me day after day.
Finally, I must thank my mom and my dad for their patience, advice and abilities to help me take a step back and gain perspective in some of the less exciting moments of the project.
1. Introduction
The coast is generally defined as the transition area between the environments perennially occupied by marine water bodies and land surfaces. However, this apparently simple definition describes an incredibly complex and differentiated environment.
The high number of chemical, physical and biological agents that characterize these areas consequently leads to identifying several coastal types with unique characteristics dictated by the interaction of environmental factors.
This heterogeneity makes the coastal study an extremely delicate and complex process that requires an extensive knowledge of the considered area.
The high degree of complexity of these areas becomes more complicated when considering the multiple effects and profound changes caused by numerous human activities existing in coastal areas.
Historically, coastal areas have always been considered preferred locations for the development of multiple economic activities. Currently, approximately 44% of the world's population live within 150 kilometers from the shore line, and this number is rising rapidly (UN Atlas of the Oceans).
The strong dynamism of coastal areas, created by the continuous action of marine weather forces and human activities, has resulted in extreme sensitivity of these areas. Therefore, it is essential to frame the study of coastal areas holistically, taking into account both the events on a local scale, such as coastal erosion, and the boundary conditions, which can have a lasting effect on the Physiographical Unit (the physical framework within which the transport processes of sandy materials remain confined). In this context, the study of sedimentary contributions from the continent to the sea are of crucial importance: they are constantly affected by weather events (e.g. flooding) and by human activities in the territories of the river basins or directly located on the coast.
substantial alterations in the sedimentary balance and the potential increase in organic and inorganic pollutants.
Among the existing inorganic pollutants, trace metals are considered a serious threat in the marine environment due to their toxicity, abundance and persistence.
Trace metals have both natural and anthropogenic origins (Nriagu 1989; Veena et al. 1997). The principal natural source of trace metals is from crustal material that is either weathered on and eroded from the Earth’s surface or released into the atmosphere by volcanic activity (Callender 2003). These natural sources of trace metals account for 80% of all the natural sources whereas forest fires and biogenic sources account for 10% each (Nriagu 1990).
Furthermore, there are a multitude of anthropogenic sources of trace metals: rapid industrialization, urbanization, and increased human activity have resulted in an increased quantity of trace metals accumulated in air, water, soil, and sediment as described in several works (Nriagu and Pacyna 1988; Varol 2011; Chaudhari et al. 2012; Suresh et al. 2012; Bastami et al. 2014).
The major anthropogenic source of trace metals is from mining and smelting. Mining activity releases metals to the fluvial environment as tailings and to the atmosphere as metal-enriched dust. Moreover, smelting releases metals to the atmosphere as a result of high temperature refining processes (Callender 2003). Other important anthropogenic sources of trace metals include fossil-fuel combustion, municipal waste incineration, cement production, phosphate mining and the use of commercial fertilizers and pesticides (Nriagu and Pacyna 1988).
Trace metals released from natural and anthropogenic sources are then transported to the marine environment by different pathways including river basin runoff, atmospheric deposition and discharge of sewage (Callender 2003; Gao and Li 2012; Xu et al. 2016). It is widely shown in the international literature that particular affinity exist between the finer grain size of sediment and the chemical species present in the water column: potentially chemical pollutant, such as trace metals, tend to bond with the pelitic sediment particles, and then they follow the sediment fate (Salomons and Förstner 1984;
Windom et al. 1989; Horowitz 1991; Ligero et al. 2001; Mil-Homens et al. 2013).
As a result, the final receptors of pollutants in the sea are the depositional areas of the pelitic fraction which are internationally considered as the main "archive integrator" of pollutants reflecting the pollution levels in the water column (Chengxin et al. 2002; Selvaraj et al. 2004; Brondi et al. 2008).
The detailed study of the depositional areas of pelitic fractions can provide important informations regarding the degree of pollution on both spatial and temporal scale and can be used as a valuable tool for assessing the enrichment of trace metals caused by human activities with respect to the "natural geochemical background values" which identify the condition of natural chemical element concentration in a given area (Matschullat et al. 2000; Reimann et al. 2005; Song et al. 2014; Xu et al. 2016).
Furthermore, the assessment of the degree of pollution and the potential toxicity of trace metals in marine sediments assumes a higher value if accompanied by analyses of the biological tissue of "sentinel organisms" or "bio-indicators" strictly connected with the substrate and particularly sensitive to changes induced by polluting agents (Rainbow 1995; Warnau et al. 1998; Soualili et al. 2008).
In the light of the scientific state of the art presented, this PhD work proposes a detailed survey of the pollution degree and potential toxicity of trace metals in the marine coastal environment of the northern Latium, Italy. The results of this study can be usefull to target ecological investigations of the processes of bioaccumulation and biomagnification along the marine food chains in the study area.
2. Objectives and scope
The present work proposes a detailed survey of the pollution degree and potential toxicity of trace metals in marine sediments of the coastal area enclosed between Montalto di Castro and Capo Linaro, in northern Latium, Italy.
This coastal stretch has been chosen as the investigation area because it appears to be the area with the greatest human pressure enclosed between the morphological constraints of the physiographic unit of Capo Linaro - Monte Argentario.
Moreover, given the small number of studies carried out in physiographic unit, this coastal area does not have a complete framework of the distribution, the degree of enrichment and the potential toxicity of marine sediments.
The examined coastal stretch includes the Civitavecchia area which is home to many human activities of national and international importance.
The Port of Civitavecchia is a major hub for national and international commercial traffic and one of the main Italian ports for passenger traffic with over two million passengers in transit each year.
The northern border of the Civitavecchia area hosts the thermal coal power plant ENEL Torrevaldaliga North with a total power of 1980 MW. The thermal power plant fueled with natural gas from Tirreno Power consists of two production modules, respectively, with power of 400 and 800 MW.
The study area is also characterized by the alluvial deposits of the Fiora, Marta and Mignone rivers and from several small streams, which influence marine sedimentation during intense rainfall events and during subsequent flooding (Angelucci et al. 1979; Carboni et al. 1980).
The Fiora river basin is affected by cinnabar (HgS), a geologic anomaly of Mt. Amiata, but more so by the Hg extraction that lasted from Etruscan times (the eight to the first century B.C.) to 1980 (Barghigiani et al. 1996).
The areas drained by the Mignone river basin and by the Marangone stream have been the subject of past mining activities related to the extraction of sulphides (Pyrite,
Marcasite and Galena) from the nineteenth century through the early part of the twentieth century (Spadoni et al. 2005; Kreidie et al. 2011).
Considering the different human activities occurring over the years in the hinterlands and the human activities currently located in this coastal stretch, the present study shows a qualitative and quantitative evaluation of the influence of human activities in the examined coastal area with respect to the natural conditions.
In particular, the chemical elements taken into account included trace metals, which are affected by possible changes induced by human activities.
The degree of enrichment and potential toxicity evaluation of marine sediments was performed both spatially and temporally throughout the study area by sampling surface sediments and core samples.
For the enrichment degree and potential toxicity evaluation, numerical thresholds described in US EPA Sediment Quality Guidelines have been used to perform an immediate comparison (Long et al. 1995). Moreover, different indices (enrichment factor, geoaccumulation index, potential toxicity response index, adverse effect index) widely described in the international literature were used (Hakanson 1980; Morillo et al. 2004; Shafie et al. 2013; Muñoz-Barbosa et al. 2012).
The temporal evaluations were carried out assessing the variations of trace metals in a time span which extends from the early 1950s until the present time.
Therefore, this work shows the spatial and temporal assessment of trace metal concentrations in the coastal marine environment of the considered physiographic unit in order to lay a solid foundation for future studies concerning the propagation of chemical pollutant species along the marine food chains in the studied area.
3. Trace Metal Enrichment and Pollution in Coastal Sediments in the Northern Tyrrhenian Sea, Italy.
The first part of the project involved the study of the qualitative and quantitative distribution of some trace metals in surface sediments of the coastal area between Santa Severa and Tarquinia Lido.
In particular it was possible to delineate: (i) the spatial distribution and the current granulometric characteristics of coastal surface sediments of the study area, (ii) the spatial distribution of Cr, As, Mn, Ni, Pb, and Cu associated with surface marine sediments, and (iii) the enrichment degree and the potential toxicity induced by trace metals through the use of some indices (enrichment factor, geo-accumulation index, potential toxicity response index) and by comparison with the US EPA sediment quality guidelines.
The results obtained from the analysis of coastal marine sediments show the abundance of some of these trace metals.
In particular, the results show the presence of two hotspots characterized by high concentrations of As and Mn: (i) the coastal area next to the mouth of the Mignone river, and (ii) the coastal area located between the port of Civitavecchia and the Marangone stream mouth.
The hotspot located in the area near the Mignone river mouth is characterized by high Mn and As values, probably the result of sedimentary productivity and abundance of Mn and As in the territories drained by the Mignone stream.
The contribution of these two elements is due to the geological formations in the same catchment area. Regarding Mn, the sedimentary succession called "the series of Tolfa Flysch and Pietraforte" shows limestone and clay units with discontinuous superposition of clays rich in manganese (Fazzini et al. 1972; Spadoni et al. 2005).
Considering the Mignone basin size and the distribution of prevailing winds near Civitavecchia, it is reasonable to assume that such enrichment is of natural origin and overlaps with the significant contributions from human activities including the
Civitavecchia harbor and the Torrevaldaliga Nord coal-fired power plant.
Several studies have described coal combustion as the main source of anthropogenic As and Mn in natural environments (Nriagu and Pacyna 1988; Yudovich and Ketris 2005; Henke 2009).
The second hotspot, located between the port of Civitavecchia and the Marangone stream mouth, is affected by the presence of abandoned pyrite, marcasite and galena mines, located in the territories drained by the Marangone stream basin (Kreidie et al. 2011).
Urban pollution seems to be a much less important contribution, (e.g., sewage discharges, urban runoff and maritime emissions). The As concentrations and enrichments in this hot spot seem to be dominated by mineral deposits.
Moreover the wind regime and the small size of the Marangone stream basin suggest that emissions of the Torrevaldaliga North plant and of the port of Civitavecchia do not substantially affect the enrichment values of the considered hotspot.
This Chapter is adapted from a manuscript published in 2015 in “Archives of environmental contamination and toxicology”.
Piazzolla D, Scanu S, Frattarelli FM, Mancini E, Tiralongo F, Brundo MV, Tibullo D, Pecoraro R, Copat C, Ferrante M, Marcelli M (2015). Trace-Metal Enrichment and
Pollution in Coastal Sediments in the Northern Tyrrhenian Sea, Italy. Arch Environ Contam Toxicol 69(4), 470-481.
DOI:10.1007/s00244-015-0166-3. 3.1 Abstract
This study evaluated the distribution pattern and pollution of chromium, arsenic (As), manganese (Mn), nickel, lead, and copper in surface sediments along the northern Latium coast of the Tyrrhenian Sea in Italy. The enrichment factor, geoaccumulation index, and potential toxicity response index were used to evaluate the degree of contamination. These results show As and Mn contamination. The high enrichment and contamination levels of As and Mn are located in two hot spots. These elevations are due to naturally high levels of As and Mn in the Mignone River and the Marangone Stream as well as the intense human activity in the area including the largest energy production site in Europe (Torrevaldaliga Nord coal-fired power plant) and of one of the most important ports for cruise traffic in the Mediterranean Sea.
3.2 Introduction
Trace-metal pollution is a serious threat particularly in the marine environment. Trace metals have both natural and anthropogenic origins with human activities supplementing natural geochemical background values of the pollutants.
Rapid industrialization, urbanization, and increased human activity in coastal areas have resulted in an increased quantity of trace metals accumulated in air, water, soil, and sediment as described in several works (Nriagu and Pacyna 1988; Varol 2011; Chaudhari et al. 2012; Suresh et al. 2012; Bastami et al. 2014). These chemical elements are
transported to the sea by various pathways including river basin runoff, atmospheric deposition, discharge of sewage, industrial emissions, etc.
Trace metals in marine sediments have a particular affinity for finer-particle grain sizes and bind to the surface of fine particles by different processes (Forstner and Wittman 1984; Horowitz 1991; Ligero et al. 2001). They then follow the sedimentary fate of fine particles. The marine depositional areas of the pelitic fraction represent the principal trace metals archive and reflect the pollution levels in the water column (Chengxin et al. 2002; Selvaraj et al. 2004).
Other variations in physical and chemical parameters (e.g., pH, Eh, temperature, and salinity) may cause chemicals to be released from the more stable pelitic deposits. This alters the ecological balance of the surrounding area.
Trace metals are a particular threat for marine ecosystems. They bioaccumulate and biomagnify, which results in the exponential accumulation of toxic elements within various trophic chains and levels (Liu et al. 2009; Zhan et al. 2010; Ghrefat et al. 2011; Gao and Chen 2012). The purpose of this research was to (1) determine the spatial distribution of trace metals (chromium [Cr], arsenic [As], manganese [Mn], nickel [Ni], lead [Pb], and copper [Cu]) associated with marine sediments; and (2) explore the sediment’s enrichment and pollution using multiple contamination indices. This evaluates the present contribution of various industrial activities in the area with particular attention given to coal combustion at the Torrevaldaliga Nord power plant and Civitavecchia harbor, which is an important port for cruise traffic in the Mediterranean Sea.
3.3 Materials and Methods
3.3.1 Study area
in the physiographical unit (PU) M. Argentario–Capo Linaro (Fig. 1).
Several investigators have exhaustively described the geological and morphological features of the PU. They have identified a series of stratigraphic marine and/or riverine units that define a series of terraces. These morpho-stratigraphic features are the result of interactions between sea-level glacial fluctuations and lifting of the zone during the Pleistocene (Fazzini et al. 1972; Ambrosetti et al. 1978, 1981; Conato and Dai Pra 1980; Bosi et al. 1990; De Rita et al. 2002; Aureli et al. 2012).
Sediment in the study area mainly comes from the Mignone River and subordinately from other smaller rivers, but these only influence marine sedimentation locally and during high flood phases (Angelucci et al. 1979; Carboni et al. 1980; Tortora 1989a, 1989b).
The Mignone River basin (500 km2) is located between the Tyrrhenian margin (to the west) and the Pleistocenic volcanic reliefs of the Sabatini and Cimino–Vicano Mounts. Its complex geological setting includes the presence of many sulphide mineral ores linked to the upwelling of hydrothermal fluids. More than half of the Mignone River basin is set on hilly morphotypes (65 %). Of this, 44 % is marl, 11 % is arenaceous conglomerate, and 10 % is clay. The volcanic formations occupy 15 % of the river basin surface. The sediment is sandy for the conglomeratic formations and clay-like in the marl formations (Spadoni et al. 2005; Scanu 2012). Among the smaller rivers making local contributions, the most important is the Marangone basin. Its delta is located to the south of the Civitavecchia harbor, which has the same geologic characteristics as the Mignone basin. Although modest in size (only 23 km2), the Marangone stream basin has abandoned pyrite, marcasite, and galena mines as well as marcasite mine waste deposits and galena small pits (Kreidie et al. 2011).
The Civitavecchia compound located in the study area has the largest energy-production site in Europe as well as one of the most important cruise traffic ports of the Mediterranean sea. The recent history of Civitavecchia (i.e., after World War II) is marked by various industrial activities that have continuously influenced the concentrations of trace metals in all environmental compartments particularly in the
sedimentary matrix. To understand the effective contribution of the anthropic activities in the northern Tyrrenian Sea—including Cr, As, Mn, Ni, Pb and Cu levels in sediments —one must consider the complex overlap of potential pollution sources. Most important is the Torrevaldaliga Nord plant and other industrial stressors such as the Civitavecchia harbour.
3.3.2 Sample collection and analysis
Sediment sampling was performed in July 2013 using a Van Veen grab (18-L volume). Surface sediment samples (n = 28) located between -50 and -10 m were sampled (Fig. 2). The surface layer (1 cm) of each sample was subsampled, homogenized, and placed into polyethylene bags. Once transported (at 4 °C) to the laboratory, sediments were dried in an oven at 40 °C for 48 h, crushed, and stored in polyethylene bags for subsequent analysis. Grainsize analysis was performed through wet sieving on sediment samples previously treated with H2O2 vol. 16 solution (Spagnoli et al. 2014). Surfer 8.0 (Golden Software Inc., USA) was used for drawing the distribution maps of the pelitic fraction percentage as well as the trace-metal concentrations in the surface sediments. Kriging interpolation method was used.
Fig. 2 Sediment sampling locations.
3.3.3 Trace metal analysis
Metal extraction from sediments and analytical determination was performed according to United States Environmental Protection Agency 3051A:2007 and 6010C:2007, respectively. Specifically, 1 g of each analytical sample group was weighed with an analytical scale (Mettler Toledo xs105) and mineralized in a microwave system Ethos Touch Control (MILESTONE S.r. l.—Italy) with a digestion solution prepared using 9
mL. The trace metals analysis was performed with an inductively coupled plasma-optical emission spectrometer Optima 2000DV (Perkin Elmer-USA). Standards for the instrument calibration were prepared using a multielement certified reference solution ICP Standard (Merck). The system was calibrated using a calibration line made up of five different concentrations for each element. The linear regression (R2) for the calibration line was between 0.9972 and 0.9989.
Analytical blanks and recovery samples were run in the same way as the real samples, and concentrations were determined using standard solutions prepared in the same acid matrix to validate the calibration. An analytical quality-control procedure was performed with standard reference material NIST-2711a- Montana II Soil with a recovery range between 95 and 110 % for selected metals.
To assess the trace-metal enrichment and contamination degree in sediments, three different indices were used: enrichment factor (EF), geoaccumulation index (Igeo), and potential toxicity response (RI). Moreover, the mean concentrations of Cr, As, Ni, Pb, and Cu were compared witheffect range low (ERL) and effect range median (ERM) values (Long et al. 1995).
Finally, Pearson’s correlation matrix of raw data set was performed to evaluate the possible correlation between the trace-metal concentrations in the sediment samples. For the Pearson’s correlation, all trace-metal values were normalized with aluminum (Al) concentrations to account for grain-size differences.
EF was previously described and used by several investigators (Morillo et al. 2004; Adamo et al. 2005; Vald’es et al. 2005). It is widely used to study the degree of sediment contamination. For normalization of metal concentrations, the EF method normalizes the measured trace metals with respect to a sample reference metal such as iron (Fe) or Al (Ravichandran et al. 1995). In this approach, the Fe or Al is considered as a ‘‘proxy’’ for the clay content (Windom et al. 1989; Din 1992). Al was used for the normalization as described by Lee et al. (1998), Huang and Lin (2003), and Woitke et al. (2003). The enrichment factor is determined by the following equation:
EF = (Hs/ Als)/(Hc/Alc)
where Hs and Hc are the sample and background tracemetal concentrations, respectively, and Als and Alc are the sample and background reference levels of Al. For background concentrations, the values reported by Turekian and Wedepohl (1961) were used considering the different sedimentary matrix (sandstone or shale). Sakan et al. (2009) suggested that EF values < 1 indicates no enrichment; < 3 indicates minor enrichment; 3 to 5 indicates moderate enrichment; 5 to 10 indicates moderately severe enrichment; 10 to 25 indicates severe enrichment; 25 to 50 indicates very severe enrichment; and > 50 indicates extremely severe enrichment.
Igeo is defined by the following equation:
Igeo = log2 (Cn / kBn)
Here, Cn is the metal concentrations of the examined sediment samples and Bn is the metal's geochemical background value. The factor k (1.5) is the background correction factor due to lithospheric effects (Müller 1969, Rubio et al. 2000; Shafie et al. 2013). Igeo classifies sediments into 7 classes: Class 0 (practically uncontaminated, Igeo ≤ 0); Class 1 (uncontaminated or moderately contaminated, 0 < Igeo < 1); Class 2 (moderately contaminated, 1 < Igeo < 2); Class 3 (moderate to heavily contaminated, 2 < Igeo < 3); Class 4 (heavily contaminated, 3 < Igeo < 4); Class 5 (heavily to extremely contaminated, 4 < Igeo < 5); and Class 6 (extremely contaminated, Igeo > 5) (Muller, 1969; Jiang et al., 2014).
The RI was described by Hakanson (1980) and is defined as follows: RI = ∑ Eif
where Ei
where Tif is the response coefficient for the toxicity of the single metal, e.g. Cr = 2, Ni =
Cu = Pb = 5, and As = 10 (Hakanson 1980). Term Cif is the monomial contamination factor defined as:
Cif = Cis /Cib
where Cis and Cib are the trace metal concentrations in the samples and background respectively. The RI grading standards are: RI < 150 = low grade; 150 < RI < 300 = moderate grade; 300 < RI < 600 = severe grade; and RI > 600 = serious grade.
3.4 Results
Trace metal concentrations in the surface sediments collected from the study area follow the scheme: Mn > Pb > Cr > Ni > As > Cu.
Table 1 shows the original data set, which includes the pelitic fraction percentages for all sediment sampling stations, ranges, averages, standard deviations, ERL and ERM values of the considered elements. Overall, the mean concentrations of all trace metals are below their ERM guidelines. However, the mean concentration of As is above the ERL value (17 sampling stations exceeded the ERL value). This effect represents contamination in most of the sampling locations.
The spatial pattern of metals (Al and Fe included) in sediments as well as the spatial distribution of the pelitic fraction percentages are shown in Figure 3.
Sampling sites Location Pelitic fraction (%) Al (mg/kg) Cr (mg/kg) As (mg/kg) Mn (mg/kg) Fe (mg/kg) Ni (mg/kg) Pb (mg/kg) Cu (mg/kg) ST01 4677160 720912 15.2 51545 12.37 6.33 115.0 26985 7.11 21.55 4.05 ST02 4676951 720629 45.0 79926 13.87 5.95 105.5 35090 8.09 24.66 5.04 ST03 4676671 720184 43.9 61344 20.83 7.80 137.7 24720 12.19 28.73 7.54 ST04 4673178 723277 15.4 54922 13.26 9.51 163.6 30074 8.07 19.06 4.62 ST05 4672993 723068 54.5 51804 17.76 9.39 131.8 23377 10.54 32.06 6.31 ST06 4671921 725352 6.8 22015 10.58 12.46 224.6 17538 6.64 5.40 2.87 ST07 4671702 725086 3.6 35464 11.16 14.17 217.3 24989 7.04 9.04 3.09 ST08 4671377 724683 28.3 38841 13.27 11.15 171.7 20472 8.31 16.81 4.95 ST09 4671193 724473 58.3 46020 13.38 9.58 134.3 22664 8.82 18.43 5.20 ST10 4671036 724251 20.8 48387 14.84 9.34 102.8 22410 8.55 25.44 4.84 ST11 4670857 724050 26.9 52024 20.03 9.19 122.5 23351 11.79 24.92 7.78 ST12 4666127 727283 42.9 68006 19.02 7.93 117.1 29652 11.53 20.86 5.85 ST13 4666046 727187 25.6 68273 19.12 9.37 118.5 29557 11.80 26.29 5.76 ST14 4661870 731155 11.9 12596 7.32 35.38 356.2 19185 8.85 0.82 1.23 ST15 4661755 731002 15.4 41731 11.53 14.29 191.6 32749 8.06 14.94 3.97 ST16 4658628 732612 49.6 47629 21.69 9.84 164.5 23794 11.54 22.32 7.13 ST17 4658107 731958 30.1 99119 19.06 7.63 137.6 47773 12.32 24.69 6.77 ST18 4657693 731491 71.2 57472 17.24 6.25 123.6 26703 10.99 25.18 5.33 ST19 4656476 733582 43.7 72603 12.32 11.02 146.4 39880 9.10 10.37 4.51 ST20 4656272 733361 33.0 120297 18.08 6.98 137.3 55111 11.72 22.84 5.99 ST21 4656122 733171 30.5 61017 18.75 8.80 168.1 35418 12.79 20.10 6.47 ST22 4656476 739090 60.9 46623 21.24 7.51 182.7 22178 11.82 21.46 7.26 ST23 4655686 738055 18.6 64626 17.38 7.36 143.5 34625 11.84 22.19 6.28 ST24 4654956 737184 51.5 75499 19.94 7.49 155.5 37368 12.21 20.11 6.44 ST25 4654551 736701 93.4 44381 18.54 5.43 116.5 20611 10.18 23.79 4.93 ST26 4654853 744302 36.8 52342 12.07 9.94 213.5 34550 8.36 14.52 4.71 ST27 4654821 743374 48.2 35351 13.72 10.44 199.1 19489 9.54 17.69 4.90 ST28 4653217 742310 51.7 31455 11.07 8.52 194.7 16131 10.41 13.66 5.08 Range 12596 - 120297 7.32 – 21.24 5.95 – 35.38 105.5 – 356.2 16131 – 47773 7.04 – 12.32 5.40 – 32.06 2.87 – 7.78 28444.38 ± 9153.09 ERL - 81 8.2 (17) - - 20.9 46.7 34 ERM - 270 70 - - 51.6 218 270 Average ± SD 55047 ± 22049.76 15.69 ± 3.91 9.97 ± 5.45 160.47 ± 52.067 10.01 ± 1.89 19.57 ± 7.01 5.32 ± 1.48
*(N): number of samples exceeded the ERL value.
Fig. 3 Spatial distribution of the % of pelitic fraction, Al, Cr, As, Mn, Fe, Ni, Pb and Cu.
The results highlight two different patterns: (i) Mn and As concentrations; and (ii) Cu, Pb, Ni, and Cr concentrations.
Figure 3 shows that the Mn and As spatial distributions have a different pattern. It is not possible to identify a bathymetric or grain size gradient, and there are two hotspots that affect their distributions. The hotspots are located near the Mignone and Marangone Deltas in the northern and southern part of the study area, respectively.
to the bathymetric depth of -50 m. There is a slight anomaly located near the Santa Marinella touristic harbor. This progressive gradient agrees with the pelitic fraction percentage and Al concentration, which increase with depth. The distribution pattern of Fe is similar to the Al and pelitic fraction distributions.
The calculated EF values follow the scheme: Mn > As > Ni > Cu > Pb > Cr.
The EF spatial distributions (Fig. 4) of As and Mn follow a similar pattern as the raw data. The As and Mn show a severe enrichment (10 < EF < 25) in the area close to the coast. There is extremely severe enrichment (EF > 50) near the Marangone Delta. Ni follows a similar pattern to As and Mn, but with lower values; Ni EF is moderately high near the Mignone Delta and moderately severe south of the Civitavecchia harbor near the Marangone Delta. For Cu, there are two moderate enrichment values (3 < EF < 5). One is located close to the Mignone River Delta and the other is at the Marangone Stream Delta. The Pb EF pattern follows the pelitic percentage distribution but with lower values near the coast and moderate values away from the coast. However, Cr shows no enrichment.
The Igeo results (Fig. 5) follow a similar pattern as the EF data. There is heavy to extreme Mn contamination (4 < Igeo < 5) near the Mignone River mouth and the Marangone Delta. There is heavy to extreme As contamination near the Marangone Delta and heavy contamination (3 < Igeo < 4) near the Mignone River Delta. The Ni and Cu Igeo values follow a similar pattern with moderate to heavy Igeo values (2 < Igeo < 3) near the Marangone Stream. Only Ni is visible with the same Igeo value near the Civitavecchia harbor entrance. The Mignone Delta area shows moderate Igeo values (1 < Igeo < 2).
The Pb Igeo distribution is similar to the EF distribution with a concentration increases from the coast-line (0 < Igeo < 1) up to a bathymetric depth of -50 m (1 < Igeo < 2). The Cr Igeo values show no contamination.
Statistical analyses (i.e., Pearson's correlation matrix) reveal two groups with a strong positive correlation: (i) Mn with As and Ni; and (ii) Ni with As (Table 2).
Positive correlation between the trace metals suggest that metals have common sources, mutual dependence, and identical behavior during transport.
The RI spatial distribution (Fig. 6) reports severe grade of toxicity in the area between the Civitavecchia harbor and the Marangone Delta (300 < RI < 600) as well as a moderate grade of toxicity (150 < RI < 300) in the coastal area between Capo Linaro and the mouth of the Mignone River.
Cr Mn Ni Cu As Pb Cr 1 Mn 0,671 1 Ni 0,822 0,942* 1 Cu 0,731 0,154 0,410 1 As 0,604 0,981* 0,916* 0,051 1 Pb 0,204 -0,438 -0,196 0,592 -0,456 1
*Correlation is significant at 0.01 level
Table 2 Pearson’s correlation of normalized trace-metal values.
3.5 Discussion
Several studies have investigated the concentrations of trace metals in coastal sediments. A compendium of concentrations in Italy is summarized in Table 3.
The average concentration of Cr (15.7 mg/kg) is slightly less then that found in the reference averages and is comparable to the Sardinia values. The As average concentration (9.97 mg/kg) is comparable to other Tyrrhenian coastal areas and are less than the values found in the area to the north of the Mignone river. The Mn average value (160.5 mg/kg) is twice the Sardinia average but is less than the value in the Gulf of Taranto. The average concentrations of Ni (10 mg/kg), Pb (19.6 mg/kg) and Cu (5.3 mg/kg) are far from the average values found in literature.
The results obtained from the coastal surface sediment analysis highlight an abundance trace metals, especially As, Mn, and Ni, and to a lesser extent Cu and Pb. Several studies have described how pollutants, especially trace metals, bind to the finer grain size particles. This facilitates transport and distribution of pollutants in marine sedimentary environments (Forstner and Wittman 1984; Horowits 1991b; Ligero et al. 2001; Alyazichi et al. 2015). However, the distribution of As and Mn do not conform to the bathymetric and grain size gradients in the study area. Moreover, the mean concentration of As exceeds the ERL value; this effect represents contamination in most of the sampling locations. Our results highlight the presence of two As and Mn hotspots: (i) the coastal area near the Mignone River mouth; and (ii) the coastal area between the Civitavecchia harbor and the Marangone Stream Delta. The distribution of these two trace metals was also confirmed by EF and contamination indices (Igeo and RI).
Trace metals Reference Site Range (mg/kg) Average (mg/kg)
Cr
Leoni and Sartori, 1996 Northern Tyrrhenian / Eastern Ligurian Seas, Italy 18 – 269 166.1 Adamo et al., 2005 Port of Naples, Tyrrhenian Sea, Italy 10.3 – 161.8 -Buccolieri et al., 2006 Gulf of Taranto, Ionian Sea, Italy 75.2 – 102.8 85.9
Zonta et al., 2007 Porto Marghera, Venice, Adriatic Sea, Italy 14 – 66 -Acquavita et al., 2010 Gulf of Trieste, Adriatic Sea, Italy 35 – 171 -Di Leonardo et al., 2014 Priolo Bay, Ionian Sea, Italy 5.6 – 20.5 -Schintu et al., 2015 Sardinia, Italy 2.41 – 64.1 20.03
Scanu et al., 2015 Northern Tyrrhenian Sea, Italy 13 – 53.3 34.5
As
Leoni and Sartori, 1996 Northern Tyrrhenian / Eastern Ligurian Seas, Italy 4 – 88 20.35 Adamo et al., 2005 Port of Naples, Tyrrhenian Sea, Italy 8 – 21 -Acquavita et al., 2010 Gulf of Trieste, Adriatic Sea, Italy 6.4 – 18.2 -Di Leonardo et al., 2014 Priolo Bay, Ionian Sea, Italy 3.1 – 19.7 -Schintu et al., 2015 Sardinia, Italy 2.39 – 22.9 7.68
Scanu et al., 2015 Northern Tyrrhenian Sea, Italy 12.6 – 42 21.5
Mn Buccolieri et al., 2006 Gulf of Taranto, Ionian Sea, Italy 552 – 2826 893
Schintu et al., 2015 Sardinia, Italy 19.7 – 164.8 76.09
Ni
Leoni and Sartori, 1996 Northern Tyrrhenian / Eastern Ligurian Seas, Italy 29 – 118 86.63 Buccolieri et al., 2006 Gulf of Taranto, Ionian Sea, Italy 47.9 – 60.7 53.3 Zonta et al., 2007 Porto Marghera, Venice, Adriatic Sea, Italy 8 – 59 -Acquavita et al., 2010 Gulf of Trieste, Adriatic Sea, Italy 20 – 231 -Di Leonardo et al., 2014 Priolo Bay, Ionian Sea, Italy 19.6 – 74.9 -Schintu et al., 2015 Sardinia, Italy 0.5 – 30.3 6.72
Scanu et al., 2015 Northern Tyrrhenian Sea, Italy 12 – 47 22.7
Pb
Leoni and Sartori, 1996 Northern Tyrrhenian / Eastern Ligurian Seas, Italy 17 – 58 34.79 Adamo et al., 2005 Port of Naples, Tyrrhenian Sea, Italy 37 – 314 -Buccolieri et al., 2006 Gulf of Taranto, Ionian Sea, Italy 44.7 – 74.8 57.8
Zonta et al., 2007 Porto Marghera, Venice, Adriatic Sea, Italy 50 – 131 -Acquavita et al., 2010 Gulf of Trieste, Adriatic Sea, Italy 12 – 170 -Di Leonardo et al., 2014 Priolo Bay, Ionian Sea, Italy 1.8 – 7.2
-Schintu et al., 2015 Sardinia, Italy 0.78 – 117.9 122.28 Scanu et al., 2015 Northern Tyrrhenian Sea, Italy 4.1 – 58.2 26.5
Cu
Leoni and Sartori, 1996 Northern Tyrrhenian / Eastern Ligurian Seas; Italy 14 – 44 25.56 Adamo et al., 2005 Port of Naples, Tyrrhenian Sea, Italy 40 – 415
-Zonta et al., 2007 Porto Marghera, Venice, Adriatic Sea, Italy 10 – 92 -Acquavita et al., 2010 Gulf of Trieste, Adriatic Sea, Italy 14 – 70 -Di Leonardo et al., 2014 Priolo Bay, Ionian Sea, Italy 1.5 – 15.7 -Schintu et al., 2015 Sardinia, Italy 0.5 – 202.6 29.63
basin. Spadoni et al. (2005) assessed the abundance of trace metals in stream sediment samples taken from the Mignone River and found average As and Mn values of 44.8 mg/kg and 1168 mg/kg, respectively. These two elements are due to the geological formations present in the Mignone River basin. Regarding Mn, the sedimentary succession called “serie dei Flysch tolfetani e della Pietraforte” (Fazzini et al. 1972) has a clay-like calcareous unit at its bottom that discontinuously overlaps with polychrome manganese rich clay.
This includes the Pietraforte lens and calcareous-marly units that are interbedded with the Mignone formation. Regarding As, high concentrations are found in areas where the sulfide ore mining industry was active up to a few years before this study as well as in the western part of the Mignone River.
This area was seemingly unconnected to the mineralized areas (Spadoni et al. 2005). Considering the Mignone basin size and the distribution of prevailing winds near Civitavecchia (Fig. 7), it is reasonable to assume that such enrichment is of natural origin and overlaps with the significant contributions from human activities including the Civitavecchia harbor and the Torrevaldaliga Nord coal-fired power plant. Several studies have described coal combustion as the main source of anthropogenic arsenic (Henke 2009; Yudovich and Ketris 2005), and manganese (Nriagu et al. 1988) in natural environments.
Fig.7 As and Mn hotspots in the study area including the wind regime at the Torrevaldaliga Nord site and mining
waste deposits on the Marangone basin.
The hotspot located between the Civitavecchia harbor and the Marangone Stream Delta is influenced by the presence of abandoned mines of pyrite, marcasite, and galena including the presence of marcasite mine waste deposits (Kreidie et al. 2011) in the Marangone basin. Urban pollution seems to be a much less important contribution (e.g., sewage discharges, urban run-off and maritime emissions). As concentrations and enrichments in this hotspot seem to be dominated by mineral deposits. In addition, the wind regime and the small size of the Marangone basin suggest that the Torrevaldaliga Nord power plant should not make significant contributions to the enrichment values of
result of an overlap between intense human activities with high natural levels of these elements, further geochemical and mineralogical investigations should be performed to quantitatively determine the contribution from anthropogenic sources.
3.6 Conclusions
This study analyzed the concentrations of six trace metals (Cr, As, Mn, Ni, Pb, and Cu) in surface coastal sediments collected from 28 sampling stations in the northern Tyrrhenian Sea.
The Cu, Pb, Ni, and Cr show a progressive gradient (from the coast line up to the bathymetric depth of -50 m) according to previous studies. There was a light anomaly located near the Santa Marinella tourist harbor.
Higher concentrations of Mn and As were found in the area close to the coast. In particular, two hotspots were identified, one located near the Mignone River Delta and another in the coastal area between the Civitavecchia harbor and the Marangone Stream. These Mn and As hotspots were confirmed by EF and contamination indices (Igeo and RI).
These high enrichment and contamination levels are probably the result of overlap between the high natural levels of As and Mn from the Mignone River and the Marangone Stream with intense human activity including the largest energy production site in Europe and one of the most important ports for cruise traffic in the Mediterranean sea. The effects of these anthropic stressors, especially coal combustion at Torrevaldaliga Nord, could be more relevant to the northern zone of the study area because the Mignone River basin may suffer from higher atmospheric fallout contributions due to wind regimes.
This complex overlap between the various pollution sources suggests that further geochemical and mineralogical studies are needed to better discriminate between the anthropogenic contributions and naturally high sources.
4. Mercury Enrichment in Sediments of the Coastal Area of Northern Latium, Italy.
A separate discussion involves the spatial distribution of Hg concentrations in coastal sediments of the examined physiographic unit in view of previous studies conducted in the northern sector of the physiographic unit in the late 1980s and early 1990s (Barghigiani et al. 1981; Barghigiani and Bauleo 1992; Barghigiani and Ristori 1994, 1995).
Specifically the study of Hg concentrations covered the coastal stretch between Santa Severa and the Fiora river mouth, located in Montalto di Castro. The Hg enrichment factor (EF) compared to the crustal background values derived from the literature have been evaluated. Moreover, the possible "adverse effect" on the biotic component through the use of the synthetic index AEI (Adverse Effect Index) was made (Muñoz-Barbosa et al. 2012).
The Hg distribution shows the existence of two anomalies. The first occurs in the northern part of the study area, enclosed between the Fiora river mouth and the Mignone river mouth. The second anomaly occurs in the coastal area south of the port of Civitavecchia, from the Marangone stream mouth to the south of Capo Linaro.
The Hg anomaly located south of the port of Civitavecchia, spatially less extensive than the northern anomaly, is presumably the result of the geological characteristics of the local river basins, characterized by an enrichment of sulphides and by the past presence of extractive mining activities (Spadoni et al. 2005; Kreidie et al. 2011).
Regarding the nature of the northern Hg anomaly, it is reasonable to assume that natural Hg enrichment values are affected by anthropogenic input that overlaps with the already high baseline values.
These values are also affected by the prevailing wind direction and the coastal sediment transport directed from the southeast to the northwest.
This Chapter is adapted from a manuscript published in 2016 in “Bulletin of environmental contamination and toxicology”.
Scanu S, Piazzolla D, Frattarelli FM, Mancini E., Tiralongo F, Brundo MV, Tibullo D, Pecoraro R, Copat C, Ferrante M, Marcelli M (2016). Mercury Enrichment in Sediments of the Coastal Area of Northern Latium, Italy. Bull Environ Contam
Toxicol 96(5), 630-637. DOI 10.1007/s00128-016-1776-9. 4.1 Abstract
The purpose of this study was to evaluate the extent of the Hg geochemical anomaly arising in the Amiata and Tolfa complex to the coastal area of northern Latium and to examine the possible influence on this area by the Mignone River, and by the small coastal basins, which are characterized by both previous mining activities and decades of past industrial impact. The results confirm the extension of the anomaly of concentrations of Hg in the coastal area of northern Latium, with the northern sector influenced by the contributions of the Fiora and Mignone Rivers and the southern sector influenced by the contributions of minor basins. The results show high values of the Adverse Effect Index (AEI) throughout the considered area and highlight the need for further investigation in order to assess the impact of human activities on the present and past values of Hg in marine sediments.
4.2 Introduction
Today, mercury is re-emerging as a pollutant of concern for both environmental and human health. Current global atmospheric deposition of mercury (Hg) has been estimated to be three times higher than preindustrial levels, reaching values of potential toxicity for many living organisms (Goodsite et al. 2004; Mirlean et al. 2005; Di Leonardo et al. 2006; Selin et al. 2008).
Trace elements, such as Hg, in marine sediments have a particular affinity for finer particle grain sizes, binding to the surface of fine particles by different processes (Ligero et al. 2001) and following fine particles’ sedimentary fate. Sediment can receive Hg from both natural and anthropogenic sources such as river basin runoff, atmospheric deposition, discharge of sewage, and industrial emissions.
Rapid industrialization, urbanization, and the increase of human activity in coastal areas has resulted in an increased quantity of pollutants, such as Hg, that accumulate in air, water, soil, and sediment, as described in several works (Nriagu and Pacyna 1988; Varol 2011; Chaudhari et al. 2012; Bastami et al. 2014). Therefore, the study of Hg distribution in coastal sediments is a realistic way to understand the Hg cycle in a marine environment and to explore the history of the possible anthropogenic Hg emissions at the land-ocean interface zone.
In the Mediterranean area, there are some studies of Hg related to the atmospheric compartment (Pyle and Mather 2003), as well as several studies about the Hg distribution in aquatic environments and in dissolved gaseous Hg concentrations (Ferrara et al. 2003; Horvat et al. 2003; Maffucci et al. 2005). But, there is a lack of information about the Hg spatial and temporal distribution in Latium coastal sediments. Northern Tyrrhenian Sea sediments were previously studied by some authors (Leoni and Sartori 1996; Barghigiani et al. 1996; Baldi and Bargagli 1982) and an anomaly of Hg concentration was identified. As the southern Tuscany region has had an extended history as associated with Hg contamination (Rimondi et al. 2012), this study aimed to investigate the concentrations of Hg in the northern Latium coastal area, with particular reference to: (i) the spatial distribution of Hg associated with marine sediments in order to assess the extent of the Hg anomaly, (ii) the degree of Hg in sediments, and (iii) the potential toxicity and adverse effects of Hg in biota.
The study area is located in the Tyrrhenian Sea, in northern Latium, and it included the coastal platform that extends from Santa Severa (42.01676 N–11.95604 E), located
geomorphological features of this Physiographic Unit, a series of stratigraphic marine and/or riverine units that define a series of terraces were identified. This geomorphological features are the result of interactions between lifting of the zone during the Pleistocene and sea-level glacial fluctuations. (De Rita et al. 2002; Aureli et al. 2012). The seaward margin in this area (begin of the continental slope), can be found at depths between 120 m and 150 m. Moving from the north to the south, the seabed becomes shallower and particularly in the section between Sant’Agostino and Capo Linaro the slope of the continental platform increases (Chiocci and La Monica 1996, La Monica and Raffi 1996). The sediment transport along the shore occurs in a southeast to northwest direction (Anselmi et al. 1976, Berriolo and Sirito 1985, Noli et al. 1996) and it's also confirmed by the northern orientation of the Marta and Mignone rivers.
The study area is characterized by the sedimentary contributions of three important river basins (Fiora, Marta, and Mignone) and, subordinately, from the contributions of other smaller rivers, which influence marine sedimentation only locally and during strong flood phases (Angelucci et al. 1979; Carboni et al. 1980).
The geological features and the sedimentary productivity of these river basins have been exhaustively described in several works (Spadoni et al. 2005; Scanu 2012; Scanu et al. 2015a). The Fiora River basin (which springs from the southern flank of the Monte Amiata) is mainly situated on tuff and volcanic formations, respectively characterized by predominantly sand and clay type sedimentary production. Furthermore, the Amiata district is characterized by several inactive Hg mines (Rimondi et al., 2012). The Marta river basin originates from Lake Bolsena and is mainly covered by volcanic formations, tuff reliefs, lakes and marl. The sedimentary production is clayey for the volcanic formations and sandy for the tuffaceous formations. The Mignone River basin is largely set on hilly topography consisting of marl, arenaceous conglomerate, and clay materials and it includes the presence of many sulphide mineral ores linked to the upwelling of hydrothermal fluids. The sedimentary production is sandy for the conglomeratic formations and clayey for the marl formations (Spadoni et al. 2005, Scanu 2012). The most important local contributions come from the Marangone basin which has the same
geologic characteristics of the Mignone basin. The Marangone small basin is characterized by abandoned iron sulphide (pyrite, marcasite) and galena mines. Furthermore, marcasite mine waste deposits and galena small pits are presents (Kreidie et al. 2011).
Regarding Hg levels in these river basins, several studies have shown that the Fiora River area is affected by cinnabar (HgS), a geologic anomaly of Mt. Amiata, but more so by the Hg extraction that lasted from Etruscan times (the eight to the first century B.C.) to 1980. This gave rise to high soil and vegetation contamination in much of the Amiata area (Barghigiani et al. 1981; Barghigiani and Bauleo 1992; Barghigiani and Ristori 1994, 1995; Rimondi et al. 2012).
4.3 Materials and Methods
Sediment sampling was performed using a Van Veen grab (18 L). A total of 39 surface sediment samples, located between a depth of -50 m and -10 m, were sampled between 2011 and 2013 (Fig. 1). The surface layer (1 cm) of each sample was subsampled, homogenized, and placed into a polyethylene bag. Once transported (at 4 °C ) to the laboratory, sediments were dried in an oven at 40 °C for 48 hours, crushed, and stored in polyethylene bags for subsequent analysis. Grain-size analysis was performed through wet sieving on sediment samples previously treated with 16% solution of H2O2 (Spagnoli et al. 2014).
Hg extraction from sediments and analytical determination was performed according to EPA 3051A:2007 and 6020A:2007, respectively. In particular, for the lab tests, 1 g of each analytical sample group was weighed with an analytical scale (Mettler Toledo xs105) and mineralized in a microwave system, Ethos Touch Control (Milestone S.r.l.-Italy), with a digestion solution prepared with 9 mL of 65% nitric acid (HNO3) (Carlo Erba) and 3 mL of 30% chloridric acid (HCl) (Carlo Erba). After mineralization, ultrapure water (Merck) was added to the samples up to 50 mL. The test for Hg analysis was performed with an ICP-MS DRC-e (Perkin Elmer-USA). Standards for the instrument calibration were prepared on the basis of a certified reference solution ICP Standard (Merck). The system was calibrated using a calibration line made up of five points of increasing concentration for each element, with a linear regression (R2) for the calibration line between 0.9972 and 0.9989. Analytical blanks and recovery samples were run in the same way as the real samples, and concentrations were determined using standard solutions prepared in the same acid matrix to validate the calibration. Analytical quality control was performed with standard reference material NIST-2711a-Montana II Soil, with recovery ranging between 95–110%. The cartographic elaborations were made using Surfer 8 (Golden Software, USA) and the Kriging interpolation method was used. To assess the Hg enrichment degree in sediments, enrichment factor (EF) has been used in other studies. It has been previously described by several authors (Morillo et al. 2004; Adamo et al. 2005; Vald'es et al. 2005) and is widely used to study
sediment-contamination degree. For the normalization of Hg concentrations in EF aluminum was used, as previously described by Huang and Lin (2003) and Woitke et al. (2003). The enrichment factor is determined as:
EF = (Hs/ Als)/(Hc/Alc),
where Hs and Hc are the sample and background trace metal concentrations, respectively, and Als and Alc represent the sample and background reference of aluminum contents. As background concentrations, the values described by Turekian and Wedepohl (1961) were used because of the different sedimentary matrix (Sandstone or shale). Values of EF less than 1 indicate no enrichment, of less than 3 indicate minor enrichment, of equal to 3–5 indicate moderate enrichment, of equal to 5–10 indicate moderately severe enrichment, of equal to 10–25 indicate severe enrichment, of equal to 25–50 indicate very severe enrichment, and of greater than 50 indicate extremely severe enrichment (Sakan et al. 2009).
In order to assess the potential ecological risk and toxicity of Hg, the measured concentrations in the sediment samples were compared with the effects range low (ERL) and the effects range medium (ERM) values. These numerical values are sediment quality guidelines (SQGs) originally determined by Long and Morgan (1990) and later refined by Long et al. (1995). The ERL was calculated as the lower 10th percentile of “effects” concentrations and the ERM as the 50th percentile of “effects” concentrations. Moreover, AEI values described by Muñoz-Barbosa et al. (2012) were calculated using the following equation:
AEI = [X]/[TEL],
where X is the metal concentration, and TEL is the Threshold Effect Levels derived by Long et al. (1995). If AEI is less than or equal to 1 then the metal concentration in the
effects (Muñoz-Barbosa et al. 2012).
4.4 Results and Discussion
The results are shown in Table 4 and the superficial distribution patterns of pelitic fraction, Al, Hg, Hg/Al, EF, and AEI are reported in Figure 9. The maximum concentration is 2.20 mg/kg (M11), while the minimum is concentration is 0.03 mg/kg (M25). The average value for the area is 0.62 mg/kg, but there is great variability in the data. Overall, the mean Hg concentration is above the ERL value. Moreover, eight sampling stations exceed the ERM value.
The distribution pattern of Hg clearly shows the existence of two Hg anomalies. The first occurs in the northern part of the study area, near the Fiora River delta, that extends to the coastal area of the Mignone River delta, north of Civitavecchia. The second occurs in the coastal area south of the Port of Civitavecchia, from the Marangone Stream delta to the south of Capo Linaro. The central stretch of coastline, corresponding to the urban area of Civitavecchia, shows rather low values of Hg. There is also a decreasing gradient in Hg values with increasing depth.
The distribution of EF values shows that the northern coastal area is characterized by severe enrichments, with maximum values at the Fiora River delta (very severe enrichment, EF > 60), while the southern area has enrichments from severe to moderately severe, corresponding to the coastal area south of the Port of Civitavecchia towards Santa Severa. In general, enrichment values show a distribution with maximum values at the north and south end of the study area and minimal values in the central coastal area of Civitavecchia.
The distribution of AEI values shows a similar pattern to EF values in the coastal area of Civitavecchia that is enclosed between two areas having values well above the limit of possible adverse effect.
The concentrations of Hg and the other indices show that the anomaly of Hg of the southern Tuscany extends further south than Cape Linaro. More specifically, the coastal
area south of the Port of Civitavecchia is characterized by a second geochemical anomaly of Hg, spatially smaller than the northern one.
Considering the coastal area south of the Port of Civitavecchia, it is reasonable to assume that the Hg anomaly is due to the geological characteristics of the minor local basins that are all characterized by enrichment of sulfides and past mining activities (Kreidie et al. 2011; Scanu et al. 2015b; Spadoni et al. 2005; Piazzolla et al. 2015). The same geogenic origin is presumable for the northern Hg anomaly from the Fiora River delta to Mignone River mouth. The Amiata distric, that is part of the "circum-Mediterranean Hg belt" (Bargagli et al. 1986), has several inactive Hg mines with the extraction of cinnabar being completely stopped by the 1980’s. Assuming the geogenic nature of Hg anomalies it is appropriate to consider the possibility that the concentrations are also influenced by anthropogenic inputs which overlap with the already high baseline values. The main potential anthropogenic source of Hg in the area is the coal fired power plant of Torrevaldaliga Nord with an installed capacity of 1,980 MW and more than 4 million tons of coal burned per year (National Entity for Electricity 2014). Hg is a volatile element emitted to the atmosphere through flue gas generated in coal power plants and it tends to be adsorbed onto the atmospheric dust particles, which are subsequently deposited in the aqueous and terrestrial systems by dry or wet deposition (Haykiri-Acma et al. 2011; Tang et al. 2013). This fallout can affect hydrographic basins and can lead to an enrichment of Hg in coastal marine environment. In this context, the main river basins of the area (Fiora, Marta and Mignone), may be subject to emissions from the Torrevaldaliga Nord coal fired power plant also considering the prevailing wind direction and the coastal sediment transport (Scanu et. 2015a; Scanu et. 2015b; Piazzolla et al. 2015).
The study area characteristics imply to deepen the knowledge of the source of the enrichment of Hg in marine sediments through the quantification of the real weight of the anthropogenic sources even in the high values of natural origin.