arXiv:0911.2994v3 [cond-mat.mes-hall] 1 Apr 2010
of nanosized systems: Evidence of nanosecond-decoupling of electron
and phonon temperatures
F. Banfi,1, ∗ F. Pressacco,2 B. Revaz,3 C. Giannetti,1 D. Nardi,1, 4 G. Ferrini,1 and F. Parmigiani2
1Dipartimento di Matematica e Fisica, Universit`a Cattolica, I-25121 Brescia, Italy
2Dipartimento di Fisica, Universit`a degli Studi di Trieste and Sincrotrone Trieste, Basovizza, I-34012 Trieste, Italy 3Ecole Polytechnique F´´ ed´erale de Lausanne, Laboratoire de Microsyst`emes 3, CH-1015 Lausanne, Switzerland
4Dipartimento di Fisica, Universit`a degli Studi di Milano, I-20122 Milano, Italy
(Dated: April 2, 2010)
The thermal dynamics induced by ultrashort laser pulses in nanoscale systems, i.e. all-optical time-resolved nanocalorimetry is theoretically investigated from 300 to 1.5 K. We report ab-initio calculations describing the temperature dependence of the electron-phonon interactions for Cu nan-odisks supported on Si. The electrons and phonons temperatures are found to decouple on the ns time scale at ∼ 10 K, which is two orders of magnitude in excess with respect to that found for standard low-temperature transport experiments. By accounting for the physics behind our results we suggest an alternative route for overhauling the present knowledge of the electron-phonon decoupling mechanism in nanoscale systems by replacing the mK temperature requirements of con-ventional experiments with experiments in the time-domain.
PACS numbers: 65.80.+n, 78.47.jc, 44.10.+i, 82.60.Qr
In the last decade the advent of nanoprocessing tech-niques has emphasized the need for designing non-invasive methodologies to access the realm of the ther-mal properties of nanoscale systems.1–4However,
conven-tional calorimetry is limited to samples of few tens of mi-crograms. A successful improvement recently arose from the micro-membrane-based nanocalorimeters.2,5 These
devices perform well, in terms of sensitivity, but they are limited to cryogenic temperatures and to time-integrated applications and need on-chip integration.
When confronted with the problem of measuring the specific heat of nanoscale objects, a fast non-contact probe is an optimal choice, the speed requirement be-ing dictated by the fact that the time for heat exchange between the sample and the thermal reservoir is propor-tional to the sample mass6 and the non-contact probe
avoids the addendum heat capacitance contribution, i.e. the heat capacity of the probe itself.
In these last years experiments have been reported, along with the all-optical schemes,6–11that unlocked the
gate for all-optical time-resolved nanocalorimetry. How-ever, the physical mechanism involved in an all-optical time-resolved nanocalorimetry are, over a wide temper-ature range, still unexplored. All-optical time-resolved nanocalorimetry consists of a system where a nanosam-ple, a metallic nanodisk in the present work, is placed in thermal contact on a substrate serving as a thermal bath. An ultrafast laser pump beam delivers an energy density δUV to the nanodisk. The sample’s temperature time
re-laxation to the substrate is measured via a time-delayed probe beam. Several detection schemes can be exploited or envisioned. Time Resolved Thermoreflectance (TR-TR) measures the temperature dependent changes in the optical reflectivity,1,12 Time-Resolved Spatial
Modula-tion Spectroscopy (TR-SMS)11 and time-resolved
Near-Infrared Diffraction (TR-NIRD)6,8 detect the
transmis-sion and reflectivity changes modulated by the nano-object thermal expansion, whereas Time-Resolved X-ray diffraction (TR-XRD) reveals the transient lattice ther-mal expansion.13,14
In the present work the thermal dynamics occurring in time-resolved all-optical calorimetry is theoretically in-vestigated from ambient to pumped liquid Helium tem-peratures. The theoretical frame accounts for temper-ature dependent material properties. In particular the microscopic electron-phonon interaction term Γ is calcu-lated within the frame of Allen theory,15 starting from
ab-initio Density Functional Theoretical calculations of the Eliashberg function. The nanodisk electrons Tel and
phonons Tph temperatures are found to decouple on the
ns time scale at ∼ 10 K, that is two orders of magni-tude in excess with respect to standard low-temperature transport experiments. The temperature decoupling ex-tent, and the time scale over which it occurs, are ruled by the Γ(Tel, Tph) landscape. These findings set the limits
of applicability of ultrafast nanocalorimetry well above 1.5 K while suggesting a new route to investigate the physics of electron-phonon interaction where the sub-K temperature requirement can be substituted by the ns time resolution.
The physics is here investigated considering a lattice of Cu nanodisks deposited on a Si substrate which unit cell dimensions are reported in inset of Fig. 1. The bot-tom of the Si substrate is kept at constant temperature Tcryo by a cryostat, whereas insulating boundary
condi-tions apply to the Si cell lateral boundaries. Assuming sample’s excitation by a single Ti:sapphire pump pulse (120 fs pulse duration, 1 nJ per pulse, 800 nm central wavelength, 40 µm spatial extension at FWHM, and 1 MHz repetition rate), the thermal evolution problem can be conveniently envisaged by a three steps mechanism. In the first step, the laser pulse heats the electron gas of
109 1011 1013 1015 1017 1019 I / V (Wm -3 ) 1 2 3 4 5 6 10 2 3 4 5 6 100 2 3 4 5 6 Temperature (K) 0.15 0.10 0.05 0 α 2 F 8 6 4 2 0 Frequency (THz) 200 µ m 2r 600 nm h ~ ~
.
Top SideFIG. 1: Interaction term I(T )/V in log-log scale obtained from numerical integration of Eq. 3. Insets: Eliashberg func-tion α2
F obtained from ab-initio Density Functional-based calculations (top left). Unit cell geometry (bottom right): h= 30 nm, r=150 nm.
the metallic nanodisks (sub-ps time scale). In the second step, the hot electron gas thermalizes with the phonons within the disk (ps time scale). The physics entailed in the first two steps is well modeled by the Two Tempera-tures Model:16
Cel(Tel)∂tTel = Pp(t) − Γ(Tel, Tph) + ~∇ ·(kel(Tel)~∇Tel)
Cph(Tph)∂tTph= Γ(Tel, Tph) + ~∇ ·(kph(Tph)~∇Tph) (1)
where T , k and C indicate the temperature, thermal diffusion coefficient and specific heat per unit volume, respectively, the reference to the electrons (el) or Cu phonons (ph) being indicated by the subscript, and Pp
is the profile of the pulsed power per unit volume ab-sorbed by the sample. The energy density abab-sorbed by the sample is peaked within the nanodisk, because of the difference in the optical penetration depth between Cu and Si. This occurrence gives rise, in the third step, to the onset of an heat flux from the nanodisk to the sub-strate (ns time scale). The thermal link translates in the following boundary conditions at the disk-substrate interface:
b
nph·kph∇~Tph+ (Tph−TSi)/ρth(Tph) = 0
−nbSi·kSi∇~TSi−(Tph−TSi)/ρth(Tph) = 0 (2) b
nph and bnSi being the outward unit vector normal to
the disk and Si boundary, respectively, and ρth the
tem-perature dependent boundary thermal resistivity. The temperature within the Si substrate is calculated via the standard Fourier heat transfer equation. This three-steps sequence repeats itself upon arrival of a new laser pulse, once every 1µs. The steady-state temperature distribu-tion, due to the pulses train, is modeled following Ref. 8. This distribution serves as the initial boundary condition for the thermal dynamics following the arrival of a single pulse and is rather constant within the first few microns
83 82 81 80 79 78 6 5 4 3 2 1 Time (ns) 301 300 299 298 Temperature (K) Temperature (K) 2 4 6 1 2 4 Tph - T 0 (K) 6 5 4 3 2 1 Time (ns) Tcryo = 297.5 K Tel Tph TSi Tcryo = 77 K Tel Tph TSi (a) (b) 0.1 0.1 200 µ m 300 nm 30 nm ~ ~
.
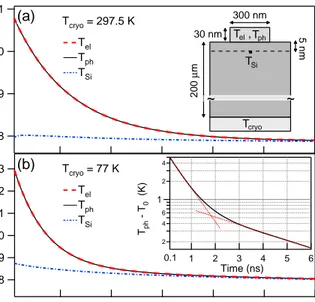
TSi Tph Tel 5 nm Tcryo ,FIG. 2: (Color online) Simulations results for Tcryo=297.5
and 77 K. Insets. Panel (a): locations within the sample were the temperatures are calculated. Panel (b): the difference between Tph and its asymptotic value T0, in semi-log scale;
dashed red lines are a guide to the eye, showing double expo-nential behavior.
region beneath the Si-nanodisk interface. In the following the temperature in this region will be addressed as TSi,
the temperature calculated at a point 5 nm beneath the disk-Si interface [inset of Fig. 2(a)]. The temperature-dependent specific heats and thermal conductivities en-tering the equations have been taken from data available in the literature.17
A fundamental issue is the temperature dependence of the electron-phonon coupling which, in the high temper-ature limit, reads Γ = G(Tel−Tph). This approximation
fails when the thermal dynamics spans the entire range from hundreds of degrees K to liquid Helium tempera-ture. For instance, with Tcryo set at 4.2 K, Tel rises to
∼100 K within the pump pulse time width, relaxing back to ∼ 4.2 K on the ns time scale. In order to properly ac-count for the temperature dependence over such a wide temperature range, the electron-phonon coupling is cast as Γ = [I(Tel) − I(Tph)]/V where
I(T ) = 2πNcNEF
Z ∞ 0
dωα2F (ω)(~ω)2n
BE(ω, T ) (3)
with Nc the number of cells in the sample, NEF the
elec-tronic DOS at the Fermi level, nBE the Bose-Einstein
distribution and α2F the Eliashberg function,15here
cal-culated ab-initio within the frame of Density-Functional Theory.18 Simulations results are reliable down to 0.6
THz, the electron-phonon interaction calculation failing for longer phonon wavelengths. For lower frequencies α2F = eλω2/ω2
D,15 ωD being the Debye frequency and
I(T ) matching the experimental data reported at sub-K temperatures.3The coefficient G occurring in the
expres-sion for the high temperature electron-phonon interac-tion, obtained from the linear fit of I(T )/V for T > ΘD,
with ΘDthe Debye temperature, is 8.43 · 1016W/(m3K),
in good agreement with experimental values reported in the literature.19,20 Results for both I(T )/V and α2F are
shown in Fig. 1. Attention is drawn on the nine orders of magnitude change of the interaction term in the temper-ature range of interest for this work, i.e. from ambient temperature to 1.5 K.
The thermal boundary resistivity is modeled by the Acoustic Mismatch Model (AMM): ρth(T ) = AbdT−3for
T 6 eT = 30 K with Abd= 1.4 · 10−3K4m2W−1 specific
for a Cu-Si interface.21 For higher temperatures, ρ th is
taken at the constant value AbdTe−3, that is within the
range of values reported for ambient temperature. Never-theless, to dissipate all doubts regarding the dependence of our findings on the detailed value of eT , calculations have been performed with values of eT spanning the range 20-50 K without affecting the physics.
The energy density delivered to the nanodisk reads δUV=δQV + δWV, where δQV and δWV are the
ther-mal and mechanical energy density respectively. In the present theoretical description only the thermal channel has been considered: δUV ≃ δQV = CphδTph, hence
yielding a temperature increase δTph ≃ δUV/Cph. In
order to justify the above mentioned approximation we calculate the ratio of the mechanical energy correction to the thermal energy term. The temperature increase δTph triggers a thermal expansion δr/r = αδTph, δr/r
being the disk’s strain and α the linear thermal ex-pansion coefficient. Associated with the disk thermal expansion is an increase in mechanical energy density. We estimate the system’s mechanical energy density as-suming it concentrated in a nanodisk radial breathing mode, δWV = (Y /2)(δr/r)2 = (Y /2)(αδTph)2, Y being
the nanodisk Young Modulus. The sought ratio reads δWV/δQV = (Y /2)(α2/Cph)δTph∼ 10−5, as obtained
upon substitution of the ambient temperature values Y =1.2×10¹¹Pa,22α= 1.6×10⁻⁵K−1,23and δT
ph≃3 K
as calculated following electron-phonon thermalization on the ps time scale. A mechanical energy correction five order of magnitudes smaller with respect to the thermal channel justifies our initial assumption.
The focus of the present paper is on the temperature relaxation dynamics relevant for nanocalorimetry, there-fore only the time scale from 100 ps to 10 ns will be discussed. Simulations results at ambient and liquid Ni-trogen temperatures are reported in Fig. 2. In both cases the temperature within the nanodisk is well de-fined (Tph=Tel) and remains homogeneous throughout
its volume, thus assuring thermodynamical equilibrium between electrons and phonons and, consequently, the technique’s applicability to investigate the nanodisk ther-mal dynamics.
At Tcryo=297.5 K the Si substrate acts as a
ther-mal reservoir at constant temperature, while the disk’s
temperature time dependence follows a single exponen-tial decay with time constant τ1= 1.1 ns [Fig. 2(a)]. The
maximum relative change of the nanodisk specific heat, ∆Cph/Cph=1.14·10−3, allows to ignore its temperature
dependence. These numerical results suggest modeling the problem as an isothermal disk, with initial temper-ature 301 K, thermally linked with a reservoir at TSi =
298 K. A value of the Biot number Bi = h/kphρth∼10−3
guarantees the disk remains isothermal throughout the thermal relaxation process. Under these circumstances the analytic solution for the disk temperature follows a single exponential decay24 with time constant τ = 1 ns,
in agreement with the numerical simulation, and the nan-odisk specific heat is readily accessible as τ /hρth.
At Tcryo = 77 K, the nanodisk temperature
dynam-ics, obtained from the numerical simulation, follows a double exponential with decay times τ1 = 0.617 ns and
τ2 = 6.286 ns, respectively [Fig. 2(b)]. On the contrary
to the previous case, TSi is not constant, due to the
di-minishing of CSi with temperature. The physics can be
rationalized as follows: the isothermal nanodisk ”feels” a substrate constant temperature on the sub-ps time scale and it thermalizes with it with τ = 0.622 ns, as calcu-lated on the basis of the isothermal disk model exploited above. This interpretation is supported by the agree-ment between the model-calculated τ and the value τ1
from numerical simulations. On the longer time scale the disk and the Si substrate portion in close proximity to the disk-Si interface jointly thermalize with the rest of the Si substrate.
The physics changes drastically for Tcryo in the range
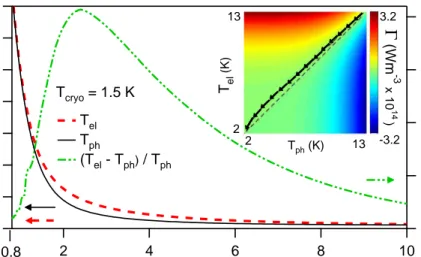
of liquid He temperatures. Simulations results for Tcryo=1.5 K are reported in Fig. 3. Tel and Tph
de-couple around 13 K, 1 ns after the pump pulse arrival, with a maximum relative temperature variation of 22%, for a time delay of 2.2 ns. A similar result, with relative temperature variation of 6%, is found for Tcryo= 4.2 K.
From transport measurements in mesoscopic structures the electron-phonon temperature decoupling occurs at sub-K temperatures,3,25 whereas for the present system
our model foresees the decoupling at temperatures about two orders of magnitude higher. Interestingly here is to point out that the electron-phonon decoupling pre-dicted in the present work, cannot be observed by trans-port measurements because of the lack of time resolu-tion, rising a strong demand for ultrafast time-resolved nanocalorimetry. A fast version of Normal Superconduc-tor InsulaSuperconduc-tor thermometer actually achieved sub-µs read out resolution, thus, foreseeing the possibility to access thermal relaxations rates with transport measurements in the µs time-window. Nevertheless the time-window over which the decoupling here addressed occurs is on the ns-10 ns time scale, that is two orders of magnitude faster.
The physics entailed in the calculations is conveniently unfolded as follows. The substrate temperature beneath the nanodisk reaches its asymptotic value of 2.2 K for a time delay of 1 ns. The system thermal dynamics is then
20 15 10 5 0
(T
el- T
ph) / T
ph (%) 10 8 6 4 2Time (ns)
16 14 12 10 8 6 4 2Temperature (K)
Tcryo = 1.5 K Tel Tph (Tel - Tph) / Tph Tph (K) Tel (K)Γ
(Wm -3 x 10 14 ) 2 13 2 13 -3.2 3.2 0.8FIG. 3: (Color online) Simulations results for Tcryo= 1.5 K. Left axis: Tph and Tel. Right axis: relative temperature variation
in percentage. Inset: nanodisk trajectory in phase space for T < 13 K (arrows) and Tel=Tphreference line (dashed) superposed
on the interaction landscape Γ.
well described in a Two Dimensional (2D) phase space of coordinates (Tph, Tel) by the following set of equations:
∂tTel= −Γ(Tel, Tph)/Cel(Tel) (4)
∂tTph= −Ω(Tph)/Cph(Tph) + Γ(Tel, Tph)/Cph(Tph)
where the thermal flux per unit volume to the Si slab is taken into account by Ω(Tph)=(Tph−2.2K)/hρth(Tph).
The thermal conductivities within the disk have been omitted, the simulation results showing that the tem-perature distribution within the disk is spatially uniform over the ns time scale, for both electrons and phonons temperatures. Eq. 4 represents the velocity component in the 2D phase space, the initial conditions being the tem-peratures (Tph, Tel) reached for a 1 ns delay. The
nan-odisk trajectory in phase space is tangent to the velocity field, (∂tTph, ∂tTel). The trajectory is the line Tph= Tel
for time delays spanning the ps to 1 ns range, the ve-locity vector pointing along this direction. At 13 K, ∂tTph > ∂tTel and the trajectory changes accordingly,
hence Tph< Tel. The velocity field is ruled by the
inter-play among Ω, the specific heats and Γ. The Γ interaction term is large enough in proximity of the line Tph= Telto
keep Tphand Telanchored down to 13 K, not so between
13 and 2.2 K. The system trajectory in phase space for T < 13 K is reported, superimposed on the landscape Γ, in the inset of Fig. 3.
When compared with the results obtained for Cu nan-odisks, the values for Ω, Γ and the specific heats for sev-eral metals in the temperature range were the decoupling is here shown to take place, suggest the present finding should occur in a wider range of materials other than Cu. To this aim an approximate analytic approach is here proposed, also serving as a valuable tool to further high-light the physical quantities ruling the electron-phonon temperature decoupling. In the low temperature limit,
T ≪ ΘD, well satisfied in the temperature range were
the decoupling occurs, the interaction term approximates to I(T ) = (Σ0/V )T5, Σ0/V being the sub-K
electron-phonon coupling constant.3 The Debye model for C ph
applies, and Eq. 4 reads: ∂tTel= −C1( Σ0 V ) 1 NEF (T 5 el−Tph5 Tel ) (5) ∂tTph= −C2 Θ3 D nAbd (Tph−TSi) + C3( Σ0 V ) Θ3 D n ( T5 el−Tph5 T3 ph ) (6) with C1, C2 and C3 positive material-independent
con-stants, and n the number of ions per unit volume of the chosen metal. In the case of a Cu nanodisk, ∂tTph < 0
at all times, thus ∂tTph is ruled by the power density
delivered from the nanodisk’s phonons to the substrate rather than the power density input from the electron to the phonon gas, hence the first term of the sum in Eq. 6 dominates over the second term.
Let’s now consider Al nanodisks instead and compare it to the Cu nanodisks case. With reference to Eq. 6, the following ratios are calculated:
(∂tTel)Al/(∂tTel)Cu ∼0.05 ( Θ 3 D nAbd )Al/( Θ3 D nAbd )Cu∼2.37 (Σ0 V Θ3 D n )Al/( Σ0 V Θ3 D n )Cu ∼0.2
The first ratio signifies that Te remains rather constant
in the Al nanodisk as compared to the Cu case, whereas the last two ratios imply that the main contribution to ∂tTph, also for the Al case, is the power density flow from
to the substrate temperature two times faster than in the case of Cu nanodisks. The electron-phonon temperature decoupling is therefore expected to be more drastic in Al nanodisks as compared to the Cu case, the main role be-ing played by ΘD and the material-dependent constants
entering Σ0.
Care is to be taken when addressing the system di-mensions issue. In order to perform nanocalorimetry the condition Bi < 1 needs to be fulfilled. This require-ment poses constraints on the maximum disk height in relation to the adopted metals, i.e. pure metals versus metals alloys. For instance, investigating a Permalloy nanodisk at 300 K (kP y=20 WK−1m−1 and ρth∼10−8
W−1m2K),21,26 Bi ∼1 for h=200 nm, whereas for a Cu
nanodisk Bi ∼ 1 for h = 3.81 µm. Furthermore, for low k materials the laser penetration depth to disk height ratio can be an issue with regards to the disk temper-ature homogeneity. The nanoscale range guarantees for an isothermal nanodisk over a wide range of metals sam-ples. On the other side, when dealing with metals nano-clusters, the low frequency vibrational eigenmodes aris-ing from the cluster finite-size, 0.1 THz and below, should
be accounted for in the Eliashberg function calculation. In conclusion, by modeling ab-initio the thermal dy-namics induced by ultrashort laser pulses in nanoscale systems we show that the break-down of thermodynam-ical equilibrium between electrons and phonons on the ns time scale takes place at ∼10 K. This temperature is two orders of magnitude higher then that observed in standard transport measurements. These findings set the limits of applicability of ultrafast nanocalorimetry well above liquid He temperature, the electron-phonon temperature decoupling preventing a proper definition of the temperature concept of the nanosample as a whole. Finally, the present work, while making available a proper tool for interpreting all-optical time-resolved nanocalorimetry experiments, suggests a new route for investigating the physics of the electron phonon decou-pling where the sub-Kelvin temperature requirement is substituted by the ns time resolution. If confirmed by the experiments, this discovery will bridge the fields of ultrafast optics and cryogenic transport in mesoscopic systems, while setting the investigation of the thermody-namics at the nanoscale into a new perspective.
G. Cahill, W. K. Ford, K. E. Goodson, G. D. Mahan, A. Majumdar, H. J. Maris, R. Merlin, and S. R. Phillpot, J. Appl. Phys. 93, 793 (2003).
2
K. Schwab, E. Henriksen, J. Worlock, and M. Roukes, Na-ture 404, 974 (2000).
3
F. Giazotto, T. T. Heikki, A. Luukanen, A. M. Savin, and J. P. Pekola, Rev. Mod. Phys. 78, 217 (2006).
4
V. Juv´e, M. Scardamaglia, P. Maioli, A. Crut, S. Merabia, L. Joly, N. D. Fatti, and F. Vall´ee, Phys. Rev. B 80, 195406 (2009).
5
W. C. Fon, K. C. Schwab, J. M. Worlock, and M. L. Roukes, Nano Lett. 5, 1968 (2005).
6
C. Giannetti, F. Banfi, D. Nardi, G. Ferrini, and F. Parmi-giani, IEEE Photonics Journal 1, 21 (2009).
7
A. Comin, C. Giannetti, G. Samoggia, P. Vavassori, D. Grando, P. Colombi, E. Bontempi, L. E. Depero, V. Metlushko, B. Ilic, et al., Phys. Rev. Lett. 97, 217201 (2006).
8
C. Giannetti, B. Revaz, F. Banfi, M. Montagnese, G. Fer-rini, F. Cilento, S. Maccalli, Vavassori, G. Oliviero, E. Bon-tempi, et al., Phys. Rev. B 76, 125413 (2007).
9
D. Nardi, F. Banfi, C. Giannetti, B. Revaz, G. Ferrini, and F. Parmigiani, Phys. Rev. B 80, 104119 (2009).
10
M. Siemens, Q. Li, M. Murnane, H. Kapteyn, R. Yang, E. Anderson, and K. Nelson, Appl. Phys. Lett. 94, 093103 (2009).
11
O. L. Muskens, N. D. Fatti, and F. Vall´ee, Nano Lett. 6, 552 (2006).
12
R. J. Stoner and H. J. Maris, Phys. Rev. B 48, 16373 (1993).
13
A. Plech, S. Kurbitz, K.-J. Berg, H. Graener, G. Berg, S. Gr´esillon, M. Kaempfe, J. Feldmann, M. Wulff, and
G. von Plessen, IBM J.Rev.Dev. 61, 762 (2003).
14
A. Plech, S. Gr´esillon, G. von Plessen, K. Scheidt, and G. Naylor, Chem. Phys. 299, 183 (2004).
15
P. B. Allen, Phys. Rev. Lett. 59, 1460 (1987).
16
M. I. Kaganov, I. M. Lifshitz, and L. V. Tanatarov, Sov. Phys. JEPT 4, 173 (1957). 17 Cel= γelTelwith γel= 1.065 · 10 3 Jm−3K3 taken from P. B. Allen, Phys. Rev. B 36, 2920 (1987), Cphis calculated
with PCWS, CSiis derived from the Debye Model, keland
kph are taken from C. Y. Ho et al., J. Phys. Chem. Ref.
Data 7, 959 (1978), kSi is taken from Glassbrenner et al.,
Phys. Rev. 134, A1058 (1964).
18
The function α2
F and the DOS for Cu have been calcu-lated implementing the code PWscf part of the Quantum ESPRESSO program.
19
S. D. Brorson, A. Kazeroonian, J. S. Moodera, D. W. Face, T. K. Cheng, E. P. Ippen, M. S. Dresselhaus, and G. Dres-selhaus, Phys. Rev. Lett. 64, 2172 (1990).
20
H. E. Elsayed-Ali, T. B. Norris, M. A. Pessot, and G. A. Mourou, Phys. Rev. Lett. 58, 1212 (1987).
21
E. D. Swartz and R. O. Pohl, Appl. Phys. Lett. 51, 2200 (1987).
22
D. R. Lide, ed., CRC Handbook of Chemistry and Physics (CRC Press, Boca Raton, FL, 2001).
23
M. J. Weber, ed., CRC Handbook of Optical Materials (CRC Press, Boca Raton, FL, 2003).
24
M. N. ¨Ozisik¸ , Heat Conduction, II Ed. (Wiley-Interscience, Malabar, FL, 1993).
25
M. L. Roukes, M. R. Freeman, R. S. Germain, R. C. Richardson, and M. B. Ketchen, Phys. Rev. Lett. 55, 422 (1985).
26