2020-11-02T13:52:19Z
Acceptance in OA@INAF
AGB stars in the SMC: evolution and dust properties based on Spitzer observations
Title
Dell'Agli, Flavia; D. A. García-Hernández; VENTURA, Paolo; SCHNEIDER,
RAFFAELLA; DI CRISCIENZO, Marcella; et al.
Authors
10.1093/mnras/stv2298
DOI
http://hdl.handle.net/20.500.12386/28115
Handle
MONTHLY NOTICES OF THE ROYAL ASTRONOMICAL SOCIETY
Journal
454
Number
AGB stars in the SMC: evolution and dust properties
based on Spitzer observations
F. Dell’Agli
1,2, D. A. Garc´ıa–Hern´
andez
3,4, P. Ventura
2, R. Schneider
2,
M. Di Criscienzo
2, C. Rossi
11Dipartimento di Fisica, Universit`a di Roma “La Sapienza”, P.le Aldo Moro 5, 00143, Roma, Italy 2INAF – Osservatorio Astronomico di Roma, Via Frascati 33, 00040, Monte Porzio Catone (RM), Italy 3Instituto de Astrof´ısica de Canarias, C/ Via Lctea s/n, E-38205 La Laguna, Tenerife, Spain
4Departamento de Astrof´ısica, Universidad de La Laguna (ULL), E-38206 La Laguna, Tenerife, Spain
Accepted, Received; in original form
ABSTRACT
We study the population of asymptotic giant branch (AGB) stars in the Small Magellanic Cloud (SMC) by means of full evolutionary models of stars of mass 1 M 6 M 6 8 M , evolved through the thermally pulsing phase. The models
also account for dust production in the circumstellar envelope. We compare Spitzer infrared colours with results from theoretical modelling.
We show that ∼ 75% of the AGB population of the SMC is composed by scarcely obscured objects, mainly stars of mass M 6 2M at various metallicity, formed
be-tween 700 Myr and 5 Gyr ago; ∼ 70% of these sources are oxygen–rich stars, while ∼ 30% are C–stars.
The sample of the most obscured AGB stars, accounting for ∼ 25% of the total sample, is composed almost entirely by carbon stars. The distribution in the colour– colour ([3.6] − [4.5], [5.8] − [8.0]) and colour–magnitude ([3.6] − [8.0], [8.0]) diagrams of these C–rich objects, with a large infrared emission, traces an obscuration sequence, according to the amount of carbonaceous dust in their surroundings. The overall popu-lation of C–rich AGB stars descends from 1.5−2 M stars of metallicity Z = 4×10⁻³,
formed between 700 Myr and 2 Gyr ago, and from lower metallicity objects, of mass below 1.5 M , 2-5 Gyr old.
We also identify obscured oxygen-rich stars (M ∼ 4 − 6M ) experiencing hot
bottom burning. The differences between the AGB populations of the SMC and LMC are also commented.
Key words: Stars: abundances – Stars: AGB and post-AGB. ISM: abundances, dust
1 INTRODUCTION
Stars evolving through the AGB phase are regarded as im-portant dust manufacturers (Gehrz 1989). The winds of AGB stars are an extremely favourable environment to dust formation, owing to the high densities and the relatively low temperatures, which favour condensation of gas molecules into dust grains (Gail & Sedlmayr 1985, 1999). For these rea-sons, knowledge of dust production from AGB stars proves important for a number of astrophysical contexts: the in-terpretation of the spectral energy distribution (SED) of high–redshift quasars (Bertoldi et al. 2003; Wang et al. 2008, 2013); the study of dust evolution in galaxies of the Local Group (Dwek 1998; Calura et al. 2008; Schneider et al. 2014; De Bennassuti et al. 2014); the possible explanations of the presence of dust at early epochs (Valiante et al. 2009, 2011;
Pipino et al. 2011). Furthermore, the debate concerning the relative contributions from different kinds of stars to the overall dust budget is still alive: the early claim of a domi-nant contribution from SNe (Maiolino et al. 2004) was chal-lenged by following investigations, focused on the effects of the reverse shocks on dust destruction (Bianchi & Schneider 2007). The important contribution from AGB stars to dust production at high redshifts was outlined by Valiante et al. (2009).
Modelling dust formation around AGB stars have made significant progresses in the last few years. The pioneering investigations by the Heidelberg group (Ferrarotti & Gail 2001, 2002, 2006) were followed by works from other re-search teams (Ventura et al. 2012a,b; Di Criscienzo et al. 2013; Ventura et al. 2014a; Nanni et al. 2013a,b, 2014). The results found by the various groups present considerable
ferences in the amount of dust produced by AGB stars and the kind of particles formed (Nanni et al. 2013b). This is due to the different input physics used, particularly for what concerns the most relevant factors affecting AGB evolution, i.e. convection and mass loss (Ventura & D’Antona 2005a,b; Doherty et al. 2014).
Unfortunately, despite some admirable attempts (Canuto 1992, 1993), we are still far from an exhaustive de-scription of the convective phenomenon, accounting for non locality, based on a self–consistent solution of the Navier– Stokes equations; this approach would be the only way to determine, based on first principles, the efficiency of the vective transport of energy and the mixing induced by con-vective eddies.
Therefore, the only possibility to achieve a more reli-able description of the AGB phase, with a higher predictive power of the results obtained, is to fix the main proper-ties of AGB stars via a detailed comparison with the ob-servations. The Magellanic Clouds (MCs) are the ideal en-vironments to this aim, owing to the relatively short dis-tance (51 Kpc and 61 Kpc, for the LMC and SMC, re-spectively, Cioni et al. 2000, Keller & Wood 2006) and the low reddening (EB−V = 0.15 mag and 0.04 mag, for the
LMC and SMC, respectively, Wasterlund 1997). The study of MCs, AGB stars offers better observational constraints to the theoretical models than their Galactic counterparts (e.g., Garc´ıa–Hern´andez et al. 2006, 2007, 2009) because of the unknown distances (and larger reddening) in our own Galaxy. The Spitzer Space Telescope made available to the community data of millions of AGB stars in the MCs: “Sur-veying the Agents of a Galaxy Evolution Survey” (SAGE– LMC, Meixner et al. 2006) and the Legacy program entitled “Surveying the Agents of Galaxy Evolution in the tidally stripped, low metallicity Small Magellanic Cloud” (SAGE– SMC, Gordon et al. 2011) have provided spatially and pho-tometrically complete infrared surveys of the evolved star population in the MCs.
Dell’Agli et al. (2015) (hereinafter D15), in a recent investigation, used dusty AGB models to study the AGB population of the LMC. The theoretical results were com-pared to Spitzer data from Riebel et al. (2012). D15 pre-sented an interpretation of the observed sample of AGB stars, by characterizing the stars in terms of age, mass of the progenitors, chemical composition, dust in the circum-stellar envelope. The comparison among the observed and expected distribution of AGB stars in the colour–colour and colour–magnitude diagrams obtained with the Spitzer in-frared bands allowed the determination of the relative contri-butions from C–stars and oxygen–rich AGB stars. The most relevant result was the study of the most obscured sources, called “ extreme” : the stars were identified as a majority of C–rich stars, in the final evolutionary AGB phases, and a smaller group of younger objects, undergoing Hot Bottom Burning (hereinafter HBB). The study of D15 provided an important feedback on the details of AGB modelling, partic-ularly for what concerns the depth of the Third Dredge–Up (TDU). The possibility that the IR colours of massive AGB stars, associated with a measure of the C/O ratio, can be used to determine the efficiency of HBB, was investigated by Ventura et al. (2015).
In the present paper we extend to the SMC the analysis applied by D15 to the LMC. The goal of the present
inves-tigation is to compare our interpretation of the SMC pop-ulation of AGB stars with the classification of the sources observed, present in the literature. To this aim, similarly to D15, we attempt a characterization of the stars observed to infer their mass, formation epoch, surface chemistry and the dust in their surroundings. A particular attention is ded-icated to the stars with the largest infrared emission, to de-rive their contribution to dust production in the SMC. For this reason, we base the comparison among models and ob-servations on the 4 IRAC filters centered at 3.6µm, 4.5µm, 5.8µm, 8.0µm, covering the wavelength range where most of the infrared emission from obscured, dusty AGB stars occurs.
The present investigation will be an important test for the theories regarding the evolution of AGB stars and the dust formation process in their winds. The analysis by D15 showed that the current generation of AGB models is able to satisfactorily reproduce the obscured AGB population in the LMC. To assess the reliability of these models, it is crucial to understand whether the same description of convection and mass loss used in D15, and the schematisation of the dust formation process adopted in that work, allows the de-scription of the AGB population in a galaxy with a different total mass, star formation history, age-metallicity relations, as the SMC is. Because the SFH of the LMC and SMC show important differences (Harris & Zaritsky 2004, 2009), the present work offers the opportunity to test AGB models in a different range of mass and metallicity, with respect to those used by D15 (see also Schneider et al. 2014).
This work is to be considered a first, important step, towards the description of the AGB population in more dis-tant environments, and to estimate their contribution to dust production. This study will help to be prepared in the future, to take advantage of the many, challenging opportu-nities, offered by the incoming observational facilities.
The paper is organized as follows: the data set of AGB stars in the SMC used for our analysis is described in section 2; the numerical and physical input used to model the AGB phase and the dust formation process, and to produce the synthetic population of AGB stars are given in section 3; section 4 presents the main results concerning the evolution properties of AGB stars and of the dust in their surround-ings; the interpretation of the observations is discussed in section 5, while a comparison of our results with the classi-fication by Boyer et al. (2011) is given in section 6. Finally, Section 7 compares the AGB populations in the SMC and LMC and our conclusions are offered in Section 8.
2 AGB STARS IN THE SMC: OBSERVATIONS AND CLASSIFICATIONS
The SMC is a valuable environment to study evolved stars and their contribution to life cycle of dust in the Universe. This stems from the relative proximity (∼ 61kpc) and the low ISM metallicity. Several SMC infrared surveys have been conducted so far: IRAS (Schwering & Israel 1989; Miville-Deschenes & Lagache 2005), the Infrared Space Observatory (ISO) (Wilke et al. 2003), and MSX (Price et al. 2001). The growing interest towards this galaxy has stimulated more recent near-IR and mid-IR surveys of the SMC: the AKARI survey (Ita et al. 2010) of small selected regions within the
SMC bar and the Spitzer Survey of the Small Magellanic Cloud (S3MC; Bolatto et al. 2007), which imaged the SMC bar.
The photometric data from the Spitzer Legacy program “Surveying the Agents of Galaxy Evolution in the SMC” (SAGE-SMC Gordon et al. 2011) provides a high–resolution, uniform, unbiased survey of the whole galaxy, including bar, wing and tail. Images were obtained in a 30 deg2 field with IRAC (3.6, 4.5, 5.8, and 8 µm) and MIPS (24, 70, and 160 µm) at two epochs.
Boyer et al. (2011) used the SAGE-SMC survey to in-vestigate the infrared properties of the evolved stars in the SMC. On the basis of the position in photometric planes, they classified AGB stars into four groups: oxygen–rich stars (O-AGB), anomalous oxygen–rich (aO-AGB), carbon stars (C-AGB) and “extreme” stars (X-AGB). C-AGB and O-AGB stars were classified in the J − Ksvs Ksplane,
follow-ing the cuts proposed by Cioni et al. (2006a) and rescalfollow-ing for metallicity and distance, as in Cioni et al. (2006b) (see also section 3.1.1 in Boyer et al. 2011). To exclude contam-ination from RGB stars, the authors considered only ob-jects brighter than the tip of the red giant branch (TRGB), with K < KT RGB
s = 12.58 mag (Cioni et al. 2000) and
[3.6] < [3.6]T RGB = 12.6 mag. The X-AGB are the most
obscured AGB stars in the sample. Owing to their effi-ciency in producing dust and their infrared emission, part of these objects fall below the cuts used for the C-AGB and O-AGB (see section 3.1.2 in Boyer et al. 2011). Therefore, these sources were defined as those brighter than [3.6]T RGB
and with J − [3.6] > 3.1. If the near–IR radiation is com-pletely obscured by dust, stars with [3.6] − [8.0] > 0.8 are included in the X-AGB. Equation (1) and (2) in Boyer et al. (2011) describe the cuts used to minimize the contam-ination from young stellar objects (YSOs) and unresolved background galaxies.
In this paper, we compare the results from our the-oretical models with the AGB sample presented in Boyer et al. (2011), following the selection described above. Our analysis is focused on the IRAC filters, therefore we exclude from the observational sample by Boyer et al. (2011) the objects which are missing the detection in at least one of these bands, which account for 1% of the total. The result-ing sample is constituted by ∼ 5700 stars.
We further tested our interpretation of the AGB popu-lation of the SMC against spectroscopically confirmed sam-ples, observed in the last decades. Our analysis is mainly based on the recent work by Ruffle et al. (2015), who pre-sented a detailed classification of 58 AGB stars of the SMC, using spectra taken with the Spitzer Infrared Spectrograph. We also compare our predictions with the stars analyzed by Smith et al. (1995) and the results by Garc´ıa–Hern´andez et al. (2009), that presented high-resolution optical spectra (lithium and/or s-process element abundances) of a sample of unobscured and obscured AGB stars in the Magellanic Clouds. For these samples we did a cross–correlation with the observations by Boyer et al. (2011), to obtain the Spitzer magnitudes.
Figure 1. The star formation history of the SMC as a function of stellar age (present time is t = 0), according to Harris & Zaritsky (2004). The solid (black) line gives the total SFH, whereas the dotted (blue), dashed (red), dotted–dashed (green) tracks give the contributions from stellar populations of metallicity, respectively, Z = 10−3, Z = 4 × 10⁻³and Z = 8 × 10⁻³.
3 THE SIMULATION OF THE AGB POPULATION OF THE SMC
To compare the expected and observed distribution of stars in the various colour–colour and colour–magnitude diagrams obtained with the different IRAC filters, we followed a syn-thetic approach.
We assume the Star Formation History (SFH) of the SMC given by Harris & Zaritsky (2004). A plot of the varia-tion with time of the Star Formavaria-tion Rate (SFR) is given in Fig. 1. Note that in the work by Harris & Zaritsky (2004) the total SFH is split into 3 stellar components, of metallicity Z = 10−3, Z = 4 × 10⁻³ and Z = 8 × 10⁻³.
3.1 Stellar evolution modelling
The evolutionary sequences of central stars were calculated by means of the ATON code for stellar evolution (Mazzitelli 1989). The numerical structure of the code is described in details in Ventura et al. (1998), whereas the latest updates are given in Ventura & D’Antona (2009).
As stated previously, we used three sets of models, with metallicity Z = 10−3, Z = 4 × 10⁻³ and Z = 8 × 10⁻³. The initial helium was Y = 0.25 for the most metal–poor population, and Y = 0.26 for Z = 4×10⁻³and Z = 8×10⁻³. The relative percentages of the various chemical species are taken from Grevesse & Sauval (1998). We assumed an alpha– enhancement [α/F e] = +0.4 for the Z = 10−3 case, and [α/F e] = +0.2 for the higher metallicities.
pre–main sequence, until the almost total consumption of the external envelope.
We recall here the main physical input used in the com-putations, most relevant for the present work.
The convective instability was described according to the Full Spectrum of Turbulence (hereinafter FST) model, discussed in details in Canuto & Mazzitelli (1991). Convec-tion modelling is the most relevant factor in determining the time scale of the AGB evolution and the modification of the surface chemistry. As shown by Ventura & D’Antona (2005a), use of the FST description makes massive AGB stars, with initial mass above ∼ 3M , to experience strong
HBB. This has the double effect of shortening the evolution-ary times and to modify the surface chemistry, according to the equilibria of proton–capture nucleosynthesis.
Mixing in convective regions is treated as a non– instantaneous process, coupled with nuclear burning. For each chemical species we solve a diffusion–like equation, fol-lowing the schematization by Cloutmann & Eoll (1976). This approach demands the computation of convective velocities, entering the diffusive coefficient. Within this framework, the overshoot phenomenon, i.e. the penetration of convective ed-dies in regions formally stable against convective motions, is described via the decay of velocities beyond the formal border, fixed via the Schwarzschild criterion. We use an exponential decay of velocities into radiatively stable re-gions, with an e–folding distance l = ζHp, where the
pres-sure scale–height, Hp, is calculated at the formal border of
convection. During the core hydrogen and helium burning phases, we used ζ = 0.02 to describe overshoot from the border of the convective core and the base of the stellar envelope; this is in agreement with the calibration of the width of the main sequences of open clusters, given in Ven-tura et al. (1998). During the thermal pulses phase, we used ζ = 0.002 to model extra–mixing from the bottom of the surface mantle and the borders of the convective shell which forms in conjunction with the ignition of each thermal pulse; the latter value is based on the calibration of the luminosity function of carbon stars in the LMC (Ventura et al. 2014a). The description of mass loss is also a crucial ingredient for the modelling of the AGB phase. The rate of mass loss determines the duration of the whole AGB evolution, the number of thermal pulses experienced and, consequently, the modification of the surface chemistry (Ventura & D’Antona 2005b; Doherty et al. 2014). For oxygen–rich stars we used the description of mass loss by Bl¨ocker (1995), based on hy-drodynamic simulations by Bowen (1988). For carbon stars, we used the formulae giving the mass loss rate as a function of luminosity and effective temperature published by the Berlin group (Wachter et al. 2002, 2008). This treatment is based on pulsating hydrodynamical models, in which mass loss is driven by radiation pressure on dust grains.
For what concerns the modelling of carbon stars, the computation of the low–temperature molecular opacities for carbon–rich mixtures has a great impact on the results. This is because when the C/O ratio becomes larger than unity, the formation of CN molecules favours a considerable in-crease in the molecular opacities of the external layers of the star; this, in turn, leads to an overall expansion of the whole outer region of the stars, and to an increase in the rate of mass loss. Under these conditions, the star looses the external mantle very rapidly, thus limiting the number
of thermal pulses experienced (Marigo 2002). The interested reader may find in Ventura & Marigo (2009, 2010) a detailed discussion on this argument, and the relative implications for the AGB evolution.
In the models used here we calculated the molecular opacities in the stellar surface layers (temperatures below 10,000K) by means of the AESOPUS tool (Marigo & Aringer 2009). The tables generated with the AESOPUS code are available in the range of temperatures 3.2 6 log T 6 4.5. The reference tables assume the same initial composition of the models used in the present work. For each combi-nation of metallicity and α−enhancement, additional tables are generated, in which the reference mixture is altered by varying the abundances of C, N and O. This step is done by introducing the independent variables fC, fN, fCO, that
correspond to the enhancement (in comparison with the ini-tial stellar chemistry) of carbon, nitrogen and of the C/O ratio, respectively.
3.2 The formation and growth of dust grains The winds of AGB stars are a favourable environment for the formation and growth of dust grains. This stems for the low temperatures of their surface layers, which allow the formation of dust grains close to the stellar surface, at typical distances of ∼ 1 − 10R∗(R∗is the stellar radius): in
those regions the gas densities are sufficiently large to allow dust formation in great quantities (Gail & Sedlmayr 1985, 1999).
The model for the growth of dust grains in the circum-stellar envelopes of AGB stars is described in details in the previous papers by our group (Ventura et al. 2012a,b; Di Cri-scienzo et al. 2013; Ventura et al. 2014a), where all the rel-evant equations, describing the thermodynamic structure of the wind and the rate of growth of the various dust species, are given.
The outflow is spherically symmetric, and it expands isotropically from the surface of the star, with an initial velocity v0= 1km/s. The formation of dust particles favours
the acceleration of the wind, owing to the action of radiation pressure on the dust grains. The latter effect depends on the extinction coefficient, describing the interaction between the radiation from the star and the solid particles of a given species.
The kind of particles formed is determined by the sur-face C/O ratio. In the winds of oxygen–rich stars forma-tion of silicates occurs, at a distance that, depending on the effective temperature, is in the range d ∼ 5 − 10R∗ from
the stellar surface; also small quantities of solid iron are present. The most stable species is alumina dust (Al2O3),
which forms at a typical distance of ∼ 1 − 3 stellar radii from the stellar surface (Dell’Agli et al. 2014b). In carbon– rich environments we find a similar situation, with a sta-ble and extremely transparent dust species, silicon carbide (SiC), forming close to the surface of the star (d ∼ 1 − 2R∗),
surrounded by a more external region (d ∼ 5R∗), where solid
carbon grains form and grow.
The amount of a given dust species which can be formed depends on the surface mass fraction of the so called “key– element”, i.e. the least abundant chemical species, concur-ring in the condensation process.
Table 1. The dust species considered in the present work
Dust species Formula environment key–species optical constants Olivine M g2SiO4 O–rich Si Ossenkopf et al. (1992)
Pyroxene M gSiO3 O–rich Si Ossenkopf et al. (1992)
Quartz SiO2 O–rich Si Ossenkopf et al. (1992)
Corundum Al2O3 O–rich Al Koike et al. (1995)
Iron Fe O–rich; C–rich Fe Ordal et al. (1988)
Carbon C C–rich C Hanner (1988)
Silicon carbide SiC C–rich Si Pegourie (1988)
work, with the list of key–species and the references for the optical constants adopted, are given in Table 1.
The description of the wind is interfaced with the AGB evolution modelling, because the results obtained depend on the main physical quantities of the central stars, namely ef-fective temperature, mass loss rate, luminosity, surface grav-ity.
3.3 Synthetic spectra
The evolutionary models of AGB stars provide the variation of the main physical and chemical quantities of the star dur-ing the whole thermal pulses phase, allowdur-ing to follow the behaviour of luminosity, effective temperature, rate of mass loss, and of the surface chemical composition. The applica-tion of the dust formaapplica-tion model, described in secapplica-tion 3.2, leads to the determination of the amount of dust formed in the wind, distributed among the different dust species, re-ported in Table 1. The knowledge of the density and grain size stratification of the wind allows the computation of the optical depth, which gives an indication of the degree of ob-scuration of the radiation emitted from the surface of the star.
All these ingredients are used to derive the spectral en-ergy distribution of the star for some selected models along the evolutionary sequence. To this aim, we used the code DUSTY (Nenkova et al. 1999).
The input radiation from the central star was ob-tained by interpolating in gravity and effective temperature among the appropriate tables of the same metallicity: we used the NEXTGEN atmospheres (Hauschildt et al. 1999) for oxygen–rich stars, whereas the COMARCS atmospheres (Aringer et al. 2009) were adopted for carbon stars; in the latter case we interpolated among the C/O values.
The effects of dust on the redistribution of the radiation from the star was calculated by accounting for the effects of two dusty layers. In the innermost regions we consider the contribution from the most stable dust species, i.e alumina dust for oxygen–rich AGB stars and SiC for carbon stars. The radiation emerging from this more internal zone is fur-ther reprocessed by a more external dusty layer, populated by grains of alumina dust and silicates in case of stars with a surface C/O < 1; for carbon stars, this more external re-gion is populated by solid particles of SiC and amorphous carbon.
Convolution of the emerging flux with the transmission curves of the different bands allows calculating the various magnitudes and colours.
4 THE EVOLUTION OF AGB STARS
The present work is based on the models of AGB evolu-tion and of the dust formaevolu-tion process in the wind, used in D15. Section 3 of D15 provides an exhaustive description of the evolution of AGB stars of different mass, in the range of metallicities of interest here, and of the change in their spectral energy distribution during the various AGB phases: this allows the description of the path traced by the evolu-tionary tracks in the colour–colour and colour–magnitude planes. An overview of the main results discussed in D15 is given in the following.
4.1 AGB stars: physical properties and the surface chemistry
The main evolution properties of the models used here are discussed in details in Ventura et al. (2013) for the metal-licities Z = 10−3 and Z = 8 × 10⁻³, and in Ventura et al. (2014b) for Z = 4 × 10⁻³. The interested reader is referred to these two papers for a detailed description of the AGB phase. Here we give a summary of the main evolutionary properties.
During the AGB phase the stars undergo a series of thermal pulses, when ignition of 3α reactions in a helium– rich buffer above the degenerate core occurs, and the CNO burning shell is temporarily extinguished. The external en-velope is gradually lost by stellar wind. Eventually, nuclear reactions in the H–burning shell are extinguished, and the evolutionary tracks first moves to the blue region of the Hertzsprung-Russell diagram, before beginning the White Dwarf cooling. This event marks the end of the AGB phase, thus determining its overall duration.
The luminosity of AGB stars increases with the initial mass, Minit, of the star: the higher is Minit, the higher is
the mass of the degenerate CO core1, the brighter is the
star (see left panel of Fig. 1 in Ventura et al. 2013). The luminosities of AGB stars cover a range of approximately one order of magnitude, from L ∼ 104L
(Minit∼ 1 M ),
to L ∼ 105L , for Minit∼ 7.5 − 8 M
This reflects into a difference in the duration of the whole AGB phase, depending on the stellar mass (see Ta-ble 1 in Dell’Agli et al. 2015). Our computations indicate that the AGB phase of low–mass AGB stars lasts ∼ 1Myr,
1 Indeed, models with mass in the range 6.5M
6 M 6 8M
develop a core made up of oxygen and neon, after an off–center carbon ignition, and the following development of a convective flame, propagating inwards, until reaching the center of the star.
whereas their counterparts of highest mass loose the external envelope within a few tens of kyr. We reiterate here that the evolution times are rather uncertain, as they depend on the input physics used to calculate the evolutionary sequences (Ventura & D’Antona 2005a; Doherty et al. 2014).
The surface chemical composition changes during the AGB life, according to the relative contributions of TDU and HBB. The former favours a gradual increase in the sur-face carbon, that eventually can lead to the formation of a carbon star. HBB consists in the ignition of nuclear burn-ing in the innermost regions of the convective envelope; the resulting change in the surface chemistry reflects the equi-libria of proton–capture nucleosynthesis. HBB is activated when the temperature at the bottom of the convective enve-lope exceeds ∼ 40M K. This demands a minimum core mass of ∼ 0.8 M , which reflects into a constrain on the initial
mass of the star: Minit> 3 M (see right panel of Fig. 1 in
Ventura et al. 2013). The most prominent effect of HBB is the destruction of the surface carbon, via proton capture.
This introduces a dichotomy in the evolution of the sur-face chemistry of AGB stars:
• Low–mass AGB stars, 1 M < Minit < 3 M 2,
evolve as carbon stars. The enrichment in carbon depends on the number of TDU episodes experienced, and is there-fore higher for larger values of Minit: models with Minit∼
2.5−3 M achieve the largest surface abundances of carbon.
The ejecta of these stars will therefore be enriched in carbon and, at a lower extent, in oxygen.
• High–mass AGB stars, with Minit > 3M , experience
HBB, thus remaining oxygen–rich. The temperatures of the regions close to the bottom of the convective envelope in-crease with Minit (see right panel of Fig. 1 in Ventura et
al. 2013). However, the trend of the degree of the nucle-osynthesis experienced with Minitis not straightforward, as
it depends on the delicate interplay between the tempera-tures in the envelope and the rate of mass loss (Ventura, & D’Antona 2011). The gas expelled by massive AGB stars will be greatly enriched in nitrogen, and reduced in carbon and oxygen (see Figure 1 in Ventura et al. 2014b).
The modification of the surface chemistry is sensitive to the metallicity of the star. Models of smaller metallicity ex-perience stronger HBB, thus the proton–capture nucleosyn-thesis occurs at higher temperatures, provoking a greater change in the mass fractions of the various elements in-volved. This not only reflects into the CNO elements, as shown in Figure 1 in Ventura et al. (2014b), but also into the production of sodium and aluminium (see Fig. 2 and 3 in Ventura et al. 2014b). Turning to the AGB stars of lower mass, the C–star stage is reached more easily in models of smaller metallicity, owing to the lower initial content of oxy-gen in the gas from which the star forms.
2 The threshold mass separating stars evolving as carbon stars
from more massive objects, experiencing HBB, changes with the metallicity. It is 3 M for Z > 4 × 10⁻³, whereas it is ∼ 2.5 M
for lower metallicity stars (see, e.g, Ventura et al. 2013)
4.2 Dust from AGB stars
As discussed in section 3.2, the latest generation of AGB models involve also dust formation in the circumstellar enve-lope. The models published so far rely on the schematisation by the Heidelberg group (Ferrarotti & Gail 2006), where the growth of dust grains takes place in an isotropically, expand-ing wind, movexpand-ing outwards from the surface of the star. This schematisation was used in the recent explorations by Nanni et al. (2013a,b, 2014) and in the previous works on this ar-gument by our group (Ventura et al. 2012a,b; Di Criscienzo et al. 2013; Dell’Agli et al. 2014b).
The dependence of dust production on the initial mass and the metallicity of AGB stars was described in details in Ventura et al. (2014a), where the uncertainties affecting the results are also discussed.
Based on the arguments of the previous section, SiC and solid carbon grains form in the winds of AGB stars of initial mass 1 M < Minit < 3 M , whereas AGB stars
of higher mass will be surrounded by silicates and alumina dust grains.
The amount of SiC formed in low–mass AGB stars scales with metallicity, as the corresponding key–element, silicon, is proportional to Z. We find that the typical size of SiC grains formed is 0.05µm, 0.07µm, 0.08µm, for AGB stars of metallicity Z = 10−3, Z = 4 × 10⁻³, Z = 8 × 10⁻³ (see Fig. 5 in Ventura et al. 2014a). The mass of sili-con carbide produced is MSiC ∼ 10−5− 4 × 10⁻⁵M for
Z = 10−3, MSiC ∼ 3 × 10⁻⁵− 3 × 10⁻⁴M for Z = 4 × 10⁻³,
MSiC∼ 10−4− 10−3M for Z = 8 × 10⁻³(Fig. 4 in Ventura
et al. 2014a).
In C–rich environments the dust species produced in greatest quantities is solid carbon, despite being less sta-ble than SiC: the reason is the much larger availability of carbon compared to silicon in the atmosphere of carbon stars. The amount of carbon–dust formed increases with the stellar mass, because stars of higher mass experience more TDU episodes, thus achieve a greater carbon enrichment at the surface. Stars of initial mass Minit ∼ 2 − 2.5 M are
therefore the most efficient producers of carbon–dust, with grain sizes of the order of ∼ 0.2µm in the circumstellar en-velope (see Fig. 5 in Ventura et al. 2014a). This results is approximately independent of metallicity, because the car-bon accumulated at the surface is synthesised in the He– burning shell, and is independent of Z. The overall mass of carbon dust produced by low–mass AGB stars ranges from Md ∼ 10−3M for stars of initial mass Minit ∼ 1 M , to
Md∼ 10−2M for Minit∼ 2−2.5 M (see Fig. 3 in Ventura
et al. 2014a).
In oxygen–rich stars, the mass of dust formed depends on the metallicity, because the key–elements of the dust species formed, alumina dust and silicates, are aluminium and silicon, both dependent on Z. The size of the alu-mina grains formed are in the range 0.03 − 0.07µm, ac-cording to Minit and Z. The mass of alumina dust
pro-duced is below ∼ 10−4M for Z = 10−3, whereas it is
10−5M < MAl2O3 < 10 −3
M for the higher metallicities
(see right panel of Fig. 9 in Ventura et al. 2014a). Most of the dust produced by oxygen–rich AGB stars is under the form of silicates, because the silicon content largely ex-ceeds aluminium in the surface layers. The size of the dust grains formed increases with mass and metallicity. The
sil-Figure 2. The variation during the AGB evolution of the optical depth, τ10, of AGB models of different initial mass and metallicity
Z = 10−3(left panel), Z = 4 × 10⁻³ (middle) and Z = 8 × 10⁻³(right). Times on the abscissa are normalised to the total duration of
the AGB phase. Blue squares along the tracks mark the beginning of the C–star phase. In the right panel we do not show 1M model
at Z = 8 × 10⁻³, which does not become a C–star.
icates with the largest size (∼ 0.15µm) form in the winds of massive AGB stars of metallicity Z = 8 × 10⁻³ (Fig. 8 in Ventura et al. 2014a). The overall mass of silicates pro-duced is 10−4M − 10−3M for Z = 10−3, and in the range
10−3M − 10−2M for Z = 4, 8 × 10⁻³.
4.3 The infrared spectra of AGB stars
Understanding the dust formation process in the wind of AGB stars is crucial to interpret the spectra of these stars, because the radiation emitted from the central star is re-processed by dust particles in the infrared. The shape of the spectral energy distribution is determined by the dust species in the circumstellar envelope and by the optical depth, indicating the degree of obscuration of the star. Here we use τ10, the optical depth at the wavelength of 10µm.
Fig. 2 shows the evolution of τ10for the models used in
this work; each panel corresponds to a single metallicity. For clarity reasons, we show only some of the masses involved in the present analysis. To show all the tracks in the same plot we use as abscissa the evolution time, normalised to the overall duration of the AGB phase.
Low-mass stars evolve initially as oxygen–rich; the op-tical depth is extremely small during this phase, because of the small amount of silicate–dust in the envelope. After the carbon star stage is reached, τ10increases because more
and more carbon is accumulated at the surface of the star, owing to the effects of TDU. In agreement with the dis-cussion in section 4.2, the highest τ10 are reached by AGB
stars of initial mass ∼ 2 − 2.5M , in the final evolutionary
phases. The largest values of the optical depth, τ10∼ 3, are
reached by the Z = 8 × 10⁻³models; low–mass AGB stars of Z = 10−3 evolve at optical depths below unity, whereas the Z = 4 × 10⁻³ models show an intermediate behaviour. This can be explained as follows: higher–Z models evolve at lower effective temperatures, which favours dust formation, because the region where gas molecules condense into dust is closer to the surface of the star, in a region of higher density. The stars with initial mass above 3 M experience HBB
and behave differently. While in their counterparts of lower mass the optical depth depends strongly on the amount of carbon in the convective envelope, in massive AGB stars the dust formation process is mainly determined by the strength of HBB (Ventura et al. 2012a). The phase with the high-est infrared emission occurs during the phase of stronghigh-est HBB, when both luminosity and mass loss rate reach their maximum values. The luminosity in these stars peaks in an intermediate evolutionary stage (see Fig. 6 in Ventura et al. 2014a), when τ10 is the highest shown. The tracks of the
4 M and 5.5 M models in the three panels of Fig. 2 reach
the maximum τ10 during the largest luminosity phase.
In-spection of Fig. 2 confirms that oxygen–rich models of higher mass have a stronger infrared emission, because the strength of HBB increases with the initial mass of the star; this holds independently of the metallicity.
The highest degree of obscuration reached in these mod-els, τ10∼ 1, is smaller than in their counterparts of smaller
mass τ10∼ 3; this is due to the larger content of carbon in
low–mass AGB stars compared to the silicon in the external regions of more massive AGB stars; an additional motiva-tion is that the extincmotiva-tion coefficient of solid carbon dust is higher than the corresponding coefficients of silicates.
4.4 The infrared colours of AGB stars
Fig. 3 and 4 show the evolutionary tracks of AGB mod-els of various initial mass in the colour–colour ([3.6] − [4.5], [5.8] − [8.0]) diagram (hereinafter CCD) and in the colour– magnitude ([3.6] − [8.0], [8.0]) plane (CMD). For clarity rea-sons, we show some stellar models which, according to the star formation history and the age–metallicity relationship of the SMC (see Fig. 1), will dominate the predicted syn-thetic population (see Fig. 5). In the same figures we show the observations from Boyer et al. (2011).
As shown in Fig. 2, stars with mass 1 M < Minit <
3 M evolve at larger and larger optical depths as their
en-velope becomes more enriched in carbon. The tracks evolve to redder infrared colours, owing to the presence of
car-Figure 3. Evolutionary tracks in the colour–colour ([3.6] − [4.5], [5.8] − [8.0]) plane of AGB stars of different initial mass and metallicity Z = 10−3(left panel), Z = 4 × 10⁻³(middle) and Z = 8 × 10⁻³(right). The grey points represent data of AGB stars in the SMC from Boyer et al. (2011). Full circles indicate phases during which the stars are oxygen–rich, whereas full triangles correspond to carbon–rich objects.
Figure 4. Evolutionary tracks in the colour–magnitude ([3.6] − [8.0], [8.0]) plane of AGB stars of different initial mass and metallicity. The meaning of the symbols is the same as in Fig. 3.
bonaceous dust particles in the surroundings of the star. In the CCD the models define an evolutionary line of con-stant slope. Only models of mass M > 2 M evolve at
[3.6] − [4.5] > 1.5, because they accumulate more carbon in the external regions, due to the higher number of thermal pulses experienced. The models of low metallicity do not reach such red colours; this is an effect of their higher effec-tive temperature, as discussed in section 4.3. In the CMD the main effect of the gradual carbon enrichment in the ex-ternal regions of the stars is the rightwards excursion of the tracks, towards redder [3.6] − [8.0] colours. In this plane the threshold colour separating the Z = 10−3models from their more metal rich counterparts is [3.6] − [8.0] ∼ 3.
The stars with mass Minit> 3 M experience HBB and
produce mainly silicates, with traces of alumina dust. Dur-ing the maximum luminosity phase the stars reach their
red-dest IR colours. The infrared emission during these phases is sensitive to mass and metallicity, according to the discus-sion in the previous section (see Fig. 2). In the CCD the evolutionary tracks (see right panel of Fig. 3) evolve to the region at [3.6] − [4.5] ∼ 0.2, [5.8] − [8.0] ∼ 0.8. The tracks of these obscured AGB stars bifurcate from their counterparts of lower mass, owing to the presence of the silicates feature at 9.7µm, affecting the 8.0µm flux. A bifurcation among the C–rich and the oxygen–rich tracks is also found in the CMD (see right panel of Fig. 4), the latter evolving along a more vertical sequence.
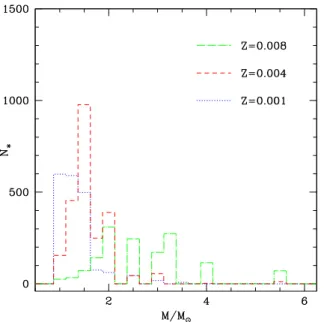
Figure 5. The mass distribution of the AGB population of the SMC, according to our synthetic modelling. The various masses are separated among the three different metallicities used in the present analysis: Z = 10−3 (dotted, blue histogram), Z = 4 × 10⁻³(dashed, red), Z = 8 × 10⁻³(dotted–dashed, green).
5 AGB STARS IN THE SMC:
UNDERSTANDING THE IR COLOURS To interpret the Spitzer observations of AGB stars in the SMC, we produced synthetic diagrams in the CCD and CMD planes, with the same methods described in D15. For each epoch, we extracted a number of stars, proportional to the SFR by Harris & Zaritsky (2004), shown in Fig. 1. The mass distribution follows a standard Salpeter IMF with index x = −1, whereas the number of extractions for each mass scales with the overall duration of the AGB phase.
The mass and metallicity distribution of the stars ex-tracted is shown in Fig. 5. In the mass domain of the stars experiencing HBB, Minit > 3 M , we note two peaks, at
M ∼ 4, 5.5 M ; the first corresponds to the peak in the SFH
which occurred 150Myr ago (see Fig. 1), whereas the max-imum at M ∼ 5.5 M concerns younger epochs, ∼ 90Myr
ago. These stars belong to the more metal–rich population, with metallicity Z = 8 × 10⁻³, which provided the great-est contribution during epochs younger than ∼ 1Gyr. In the low–mass domain the dominant AGB population is given by Z = 4 × 10⁻³ stars, with also a significant contribution from the low–metallicity component. The peak in the mass distribution around M = 1.5 M correspond to the peak in
the SFH which occurred ∼ 2.5Gyr ago (see Fig. 1). The comparison among the observations of SMC AGB stars and the results from our synthetic modelling are shown in Figs. 6 and 7. In the two figures we compare the ob-served (left panels) and expected (right panels) distribution of AGB stars in the CCD (Fig. 6) and CMD (Fig. 7) planes. The samples of spectroscopically confirmed AGB stars, de-scribed in section 2, are also shown in the same figures. Fig.
8 and 9 also show the comparison among the observation and theoretical predictions in the CCD and in CMD planes; in this case, however, the two panels show the distribution of carbon–rich stars (right) and oxygen–rich stars (left), di-vided among the various metallicity components.
5.1 Unobscured stars
The region of the CCD centered at [3.6]−[4.5] ∼ −0.1, [5.8]− [8.0] ∼ +0.1 is populated by AGB stars with an extremely small degree of obscuration, whose spectrum is not expected to show significant dust features. The red border of this region, (hereinafter region I), is represented by the diagonal line in Fig. 6, indicating stars with τ10∼ 0.001; this choice
is such that almost the totality of the oxygen–rich objects evolve bluewards of this line in the CCD (see Fig. 8). As shown in Fig. 3, the only exception here is represented by stars of initial mass above ∼ 3 M , whose tracks cross the
afore mentioned line when HBB begins.
According to our interpretation, the majority (∼ 67%) of AGB stars in region I are low–mass, oxygen–rich stars, in the first part of the AGB phase, before the C–star stage is reached. They are distributed among Z = 4 × 10⁻³stars of mass 1 − 2 M (∼ 27%), Z = 8 × 10⁻³ AGB stars of mass
2 − 3 M (∼ 23%), Z = 10−3 objects, of mass below 2 M
(∼ 17%).
A low fraction (∼ 4%) of stars in region I of the CCD is composed of Z = 8 × 10⁻³AGB stars of higher mass, in the phases previous to ignition of HBB; as discussed previously, and shown in Fig. 5, the mass distribution of these stars peaks at M ∼ 4 M and M ∼ 5.5 M . Scarcely obscured
objects, classified as oxygen–rich stars in the sample by Ruf-fle et al. (2015) and Smith et al. (1995), occupy this region of the CCD. The oxygen–rich stars presented by Smith et al. (1995) are divided among AGB stars with or without lithium. Unfortunately, the detection of lithium is of little help in the present analysis, owing to the peculiar behavior of this fragile element during the AGB evolution. Lithium is heavily destroyed by proton capture as soon as the AGB phase begins and is produced in great quantities when the temperature at the bottom of the surface convective region reaches ∼ 40M K (Cameron & Fowler 1971). The lithium– rich phase lasts until some3He is available in the envelope (Sackmam & Boothroyd 1992), thus it is limited to the ini-tial part of the HBB phase (Mazzitelli et al. 1999). Based on these arguments, it is not surprising that some of the stars in the Smith et al. (1995) sample present evidence of lithium in their spectra; for similar reasons we understand that some of the oxygen–rich stars studied by Smith et al. (1995) with a large infrared emission (see section 5.3 below) show no signature of lithium in their spectra.
As shown in the right panel of Fig. 8, according to our modelling, ∼ 29% of the sources populating region I are car-bon stars, either at the very beginning of the C–star evolu-tion, or in the evolutionary phases immediately following the ignition of each thermal pulse; these objects have a mixed metallicity: half of them are Z = 4×10⁻³AGB stars of mass M < 2 M , the remaining have metallicity Z = 10−3 and
mass below M < 1.5 M . A word of caution is needed here.
The comparison among the observations and our synthetic model shows the presence of a group of stars, in the region at [3.6]−[4.5] ∼ −0.2, [5.8]−[8.0] ∼ +0.7, not reproduced by
the models. We identify these stars as carbon–rich objects, not heavily obscured. The synthetic spectrum of these AGB stars is determined by the spectral energy distribution from the central object, substantially unchanged by the optically thin envelope. The blue [3.6] − [4.5] colours of these stars are not reproduced by the GRAMS atmosphere models used to produce the synthetic SED. This same problem was already addressed by D15, and is discussed in details by Srinivasan et al. (2011) (section 4.2.5). CO and C3absorption bands could
be a possible explanation of this discrepancy. We therefore suggest that part of the unobscured C–stars, which in our modelling evolve into region I of the CCD, would indeed populate the region in the higher portion of the CCD, cur-rently uncovered by the models. C-stars in the Smith et al. (1995) sample populate this region of the color–colour plane. In the CMD, the group of scarcely obscured AGB stars populate the lower–left region. The [8.0] > 12 mag zone (see left panel of Fig. 9) is composed of stars of various surface chemistry. The sequences of C–stars and oxygen–rich AGB stars begin to bifurcate for [3.6] − [8.0] ∼ 0.3 and [8.0] < 12 mag (see left panel of Fig. 4): oxygen–rich stars trace a more vertical sequence, with [3.6] − [8.0] colours bluer than ∼ 0.3, whereas carbon stars populate the region [3.6] − [8.0] > 0.3. This effects, discussed in D15, originates from the silicate feature at ∼ 9.7µm, present in the spectra of dusty, oxygen– rich AGB stars: for a given [3.6]−[8.0] colour, the latter stars are brighter in the 8.0µm band, compared to their carbon– rich counterparts.
For what concerns oxygen–rich objects, the analysis of the distribution of the stars in the CMD, compared to the CCD, offers a better opportunity to disentangle stars of dif-ferent metallicity; this is clearly shown in the left panel of Fig. 10. While for magnitudes [8.0] > 11.5 most of the stars belong to the population of lower metallicity, in the 11 mag < [8.0] < 11.5 mag region we mainly find Z = 4 × 10⁻³ objects, while for magnitudes [8.0] < 11 we practically have only stars of metallicity Z = 8 × 10⁻³. This is because the surface regions of higher metallicity models contain more silicon and aluminum, which favour the formation of larger amounts of silicates and alumina dust, and a higher degree of obscuration of the radiation from the central stars, hence a higher flux in the 8.0µm band. An additional motivation for this behaviour is that low–mass, higher metallicity AGB stars evolve longer as oxygen–rich objects, compared to their counterparts of lower Z (see Fig. 2); while the evolutionary tracks of the Z = 8 × 10⁻³ (and, to a lower extent, of the Z = 4 × 10⁻³) models follow the almost vertical sequence traced by oxygen–rich stars for the majority of the AGB life, the corresponding tracks of the Z = 10−3 models turn ear-lier (at higher [8.0] magnitudes) towards redder [3.6] − [8.0] colours.
5.2 Carbon stars
In the CCD, carbon stars populate a diagonal strip of con-stant slope, from the edge of region I towards red infrared colours. This is shown in Fig. 3, where the evolutionary tracks of low–mass AGB stars overlap with the observations by Boyer et al. (2011).
Similarly to D15, we interpret the AGB stars in region II of the CCD as an obscuration sequence of carbon stars: the objects with the largest infrared emission are those with the
higher surface carbon content, which experienced a higher number of TDU episodes. The optical depth increases to-wards the red side of the sequence, owing to the large quanti-ties of dust (mainly solid carbon grains) in the surroundings of these stars.
As stated previously, the blue border of region II was chosen in such a way that this regions is almost exclusively populated by carbon stars; however, a small fraction of C– rich objects is also expected to populate region I in the CCD (see right panel of Fig. 8).
The results shown in Fig. 6 indicate a satisfactory agree-ment among the observed and expected distribution of AGB stars in this region of the CCD; the colours of the theoret-ical models nicely fit the position of the carbon AGB stars sample by Ruffle et al. (2015).
Our analysis indicate that the carbon star sample in the SMC is composed of objects of metallicity Z = 4 × 10⁻³ of mass 1.5 M 6 M 6 2 M , formed between 700Myr
and 1.5Gyr ago and, in equal part, by low–mass (M < 1.5 M ) stars belonging to the Z = 10−3stellar component,
1.5 − 5Gyr old. Only 8% of the carbon stars are objects of metallicity Z = 8 × 10⁻³ of mass 1.5 M < M < 3.5 M ,
formed between 300Myr and 1.7Gyr.
The stars with the largest infrared emission, with [3.6]− [4.5] > 1, populating region III in the CCD, descend from stars of metallicity Z = 4 × 10⁻³ (see right panel of Fig. 8) and initial mass M ∼ 1.5 M ; according to our
interpre-tation, these highly obscured objects formed ∼ 1.5Gyr ago. The dust in their circumstellar envelope is mainly composed of solid carbon particles with size ∼ 0.2µm; the optical depth of these stars is τ10> 0.5. Fig. 6 shows that the number of
stars in this region of the CCD decreases as the colours be-come redder. This is partly because only the Z = 4 × 10⁻³ stars reach the zone populated by the most obscured AGB stars; an additional reason is that the stars with the largest infrared emission lose more rapidly their external envelope, which makes the remaining evolutionary phases shorter (see Fig. 3 in D15). The two carbon stars in the Ruffle et al. (2015) sample with the largest infrared emission belong to this group.
In the CMD plane, obscured carbon stars populate the region extending from [3.6] − [8.0] ∼ 0.3 to [3.6] − [8.0] ∼ 4. The group of stars in the region included between the two lines in the CMD (see Fig. 7) is interpreted as composed mainly of carbon stars, with a small contribution from ob-scured, oxygen–rich AGB stars (see next section). The ver-tical line at [3.6] − [8.0] ∼ 2.2 delimits the region where the most obscured C–stars, populating region III in the CCD, evolve.
The position of the C–rich stars in the Ruffle et al. (2015) sample is nicely reproduced also in this plane.
5.3 AGB stars experiencing Hot Bottom Burning In the observed CCD of the SMC, (see Fig. 6), we see a few stars within region IV, with colours [3.6] − [4.5] ∼ 0.1 − 0.3, [5.8] − [8.0] ∼ 0.5 − 1. According to our interpretation, based on the evolutionary tracks shown in the right panel of Fig. 3, these are the descendants of stars formed 100 − 400Myr ago, with initial mass peaking at 4M and 5.5M , currently
ex-periencing HBB. This group correspond to the AGB stars defined as “HBBS” in D15 and it is composed only by stars
Figure 6. Left: the distribution of the AGB sample of the SMC by Boyer et al. (2011) in the colour–colour ([3.6]−[4.5], [5.8]−[8.0]) plane. We show several spectroscopically confirmed samples: Ruffle et al. (2015), separated into carbon stars (black open triangles), oxygen–rich objects (black open circle) and early oxygen–rich objects (black open diamond), carbon stars (green full square) and oxygen–rich objects (violet full reversed triangle) by Smith et al. (1995) and oxygen–rich stars (blue open square) from Garc´ıa–Hern´andez et al. (2009). NGC 371 (Blue full diamond) and HV 12149 (blue tar) are discussed in sec. 5.3. Right: the results from our synthetic modelling in the same plane shown in the left panel. Stars expected to be oxygen–rich are shown in green, whereas carbon stars are indicated in magenta. The spectroscopically confirmed samples by Ruffle et al. (2015), Smith et al. (1995) and Garc´ıa–Hern´andez et al. (2009) are also shown. The open square and the full triangle within region IV indicate, respectively, stars HV1375 and IRAS00483-7347, discussed in section 5.3. The lines in the figure delimit regions I, II, III, IV, populated, respectively, by scarcely obscured AGB stars, carbon stars, extremely obscured carbon stars and stars experiencing Hot Bottom Burning.
with metallicity Z = 8 × 10⁻³, as shown in the left panel of Fig. 8. The number of stars expected within region IV is a factor 2 greater than observed. If confirmed, this discrep-ancy would suggest that a significant production of dust in M > 4M stars is limited to the phases close to the peak
of HBB, with the highest rate of mass loss. This would de-mand a partial revision of the description of the massive AGB winds, which currently predicts considerables silicates formation since the early AGB phases (see Fig. 5 in Dell’Agli et al. 2015). Alternatively, we would consider possible effects of assuming the upper/lower limits of the SFH given by Har-ris & Zaritsky (2009) . The relative contribution of stars formed in different epochs assuming the standard and lower limit are almost undistinguishable, while in the upper limit case a significantly higher number of massive AGB stars, formed 50-100 Myr ago, would be expected. This would fur-ther exacerbate the discrepancy among the observed and expected number of AGB stars in region IV of the CCD, pointing in favor of the standard or the lower limit. This cannot be a definitive conclusion though, as the low numbers involved (10 stars observed vs 20 expected) would require a deeper analysis of the statistical completeness of the sources detected in region IV. We leave this problem open.
In the CMD plane, the brightest oxygen–rich stars pop-ulate the region with 6 mag < [8.0] < 8 mag and colours 1 < [3.6]−[8.0] < 2; their position partially overlaps with the
AGB stars belonging to the sequence of C–rich objects. The colours and magnitudes of these objects are in nice agree-ment with the position of the most obscured, O–rich stars in the samples of spectroscopically confirmed stars in the CCD and CMD by Ruffle et al. (2015), Garc´ıa–Hern´andez et al. (2009) and Smith et al. (1995). It is very interesting that the most obscured (and extreme) O-rich SMC AGB stars, HV 1375 and IRAS 00483-7347 (spectroscopically confirmed by Smith et al. (1995) and Garc´ıa–Hern´andez et al. (2009), re-spectively), are inside region IV in the CCD. This seems to support our models: i) HV 1375 is a high-luminosity, Li-rich (HBB) AGB star, which is rich in s-process elements, like Zr and Nd, but Rb poor (Plez et al. 1993). The position in the CCD and CMD diagrams (Figs. 6-7) is consistent with our predictions for a 4-5.5 solar mass AGB experiencing HBB, something consistent with the lack of Rb in this star (see Garc´ıa–Hern´andez et al. 2006, 2009); ii) IRAS 00483-7347 is the most massive HBB AGB star known to date in the SMC (as indicated by its extremely large Rb enhancement Garc´ıa–Hern´andez et al. 2009). Its position in the CMD, particularly the brightenss in the 8.0µm band ([8.0] ∼ 4.7 mag), indicates that this source is an AGB star of mass ∼ 6 − 7M .
We note in Fig. 6 the presence of two stars in the Ruf-fle et al. (2015) sample, RAW 631 and HV 12956, out of the region IV, in a zone of the CCD not covered by the
Figure 7. The same as Fig. 6, but referred to the colour–magnitude ([3.6] − [8.0], [8.0]) plane. The line on the lower–left side of the diagram separates scarcely obscured objects (left) from C–stars (right), whereas the line at [3.6] − [8.0] ∼ 2.2 corresponds to the line on the right side of the CCD shown in Fig. 6. The spectroscopically confirmed samples by Ruffle et al. (2015), Garc´ıa–Hern´andez et al. (2009) and Smith et al. (1995) are shown, with the same symbols as in Fig. 6.
Figure 8. Left: the expected distribution of oxygen–rich stars from our synthetic modelling in the colour–colour ([3.6] − [4.5], [5.8] − [8.0]) plane. We show the three metallicity components in different colours: Z = 8 × 10⁻³in green, Z = 4 × 10⁻³ in red and Z = 10−3 in blue. The observed AGB sample from Boyer et al. (2011) is also shown in grey. Right: the expected distribution of carbon stars from our synthetic modelling in the colour–colour, with the same colour coding as in the left panel.
Figure 9. The same as Fig. 8, but referred to the colour–magnitude ([3.6] − [8.0], [8.0]) plane.
evolutionary tracks (see Fig. 3). Both stars are heavily em-bedded and are sufficiently red ([8.0] − [24] > 2.39 mag) to be classified as Far–IR objects, although they are not back-ground galaxies, YSOs or PNe (see section 3.1.6 in Boyer et al. 2011 and section 5.1.3 in Ruffle et al. 2015). Their spectra also show evidence of crystalline silicates. RAW 631 present a dual chemistry, with absorption features from C2H2 and
HCN and strong features from crystalline silicates, reason why it was classified as oxygen-rich by Ruffle et al. (2015). These two objects present several peculiarities which ren-ders difficult the modeling of their colors with the method we used for the other AGB stars.
Stars NGC 371, in the samples by Smith et al. (1995), and HV 12149, from Smith et al. (1995) and Ruffle et al. (2015), populating region II, were classified as oxygen–rich. We interpret these objects as descendants of stars of mass ∼ 4 − 5.5M that have just started to experience HBB, in
the phase when the evolutionary tracks move towards region IV of the CCD (see Fig. 3)
The identification of stars in region IV of the CCD with AGB stars experiencing HBB can be tested through spectroscopic analysis: their surface chemical composition would show the signature of HBB, with a C/O ratio be-low 0.05 and12C/13C close to the equilibrium value, ∼ 3.3.
Both these quantities can provide important information on the strength of HBB experienced by massive AGB stars of metallicity Z = 8 × 10⁻³(Ventura et al. 2015).
For what concerns the dust in their surroundings, stars in this region of the CCD are surrounded by alumina dust particles of size ∼ 0.07µm and silicate grains of dimension ∼ 0.1µm; the latter particles give the dominant contribution to the degree of obscuration of these stars, with optical depths in the range 0.2 < τ10< 0.8.
6 A COMPARISON WITH THE ANALYSIS BY BOYER ET AL. (2011)
Boyer et al. (2011) divided the sample of SMC stars accord-ing to the schematisation described in section 2. The AGB stars in their sample were classified as C–rich, O–rich, X– AGB and “aO–AGB” stars. The authors defined the latter group based on the position in the J − [8] plane (see Sec. 3.1.5 in Boyer et al. 2011), where they can be distinguished from C–rich and O–rich AGB stars.
In the comparison among the number of stars in the various classes, the largest group of objects, ∼ 43% of the overall population, fall in the oxygen–rich sample; an addi-tional 21.5% are classified as aO–AGB stars. The remaining AGB stars are divided among carbon stars (∼ 30%) and X–AGB (6%).
In the left panel of Fig. 10 we show the observations by Boyer et al. (2011), in the colour–magnitude [3.6]−[8.0], [8.0] plane, divided among the afore mentioned groups. In the right panel we show the results from our modelling, over-imposed to the observed locii: the objects which we classify as carbon stars are shown on the left, whereas oxygen-rich stars are shown on the right.
First, we find that almost the entire X–AGB sample is composed of carbon stars; only a few objects classified as X–AGB, populating the brighter region of the CMD, can be interpreted as the progeny of massive AGB stars, experienc-ing HBB.
In the comparison among the results from our simula-tions, shown in the right side of Fig. 10, and the classification introduced by Boyer et al. (2011) (left panel), we see that part of the stars which we interpret as carbon stars overlap with the aO–AGB sample and, in minor extent, with the O–rich group.
Figure 10. Left: the distribution on the colour–magnitude ([3.6] − [8.0], [8.0]) plane of the AGB sample of the SMC by Boyer et al. (2011), divided among oxygen–rich stars (blue points), aO-AGB (cyan), carbon stars (red) and X-AGB (green). Right: the results from our synthetic modelling in the same plane, overimposed to the observations by Boyer et al. (2011), shown with light, grey points. The simulated AGB population is divided among oxygen–rich (right side, green points) and carbon–rich AGB stars (left side, magenta).
According to our analysis the aO–AGB group intro-duced by Boyer et al. (2011) is composed of low mass stars approaching or at the beginning of the C-rich stage. Note that in a very recent work, Boyer et al. (2015), on the basis of optical spectra analysis, claim that 50% of the aO–AGB stars in the SMC are C–rich stars, in agreement with our in-terpretation. This leads to a slight difference in the relative distribution of oxygen–rich AGB and carbon stars. Accord-ing to Boyer et al. (2011), carbon stars accounts for ∼ 36% of the overall population (based on the previos point, here we added the carbon stars and the X–AGB), whereas accord-ing to our interpretation C–stars are ∼ 46% of the AGB population of the SMC in the sample by Boyer et al. (2011). This difference is the reason for the different luminos-ity function (LF) of carbon stars between the present study and the results from Boyer et al. (2011). Fig. 11 shows that we predict a higher number of faint C–stars in comparison with Boyer et al. (2011). When the same criterion to sep-arate C–stars from oxygen–rich AGB stars used by Boyer et al. (2011) is adopted, the two results become very simi-lar. Note that on the basis of the new results by Boyer et al. (2015) quoted above, these differences would be significantly reduced.
7 THE AGB POPULATIONS IN THE LMC AND SMC
The SAGE–LMC and SAGE–SMC surveys allowed a com-plete census of the AGB stars in the LMC and SMC. Hun-dreds of thousands of photometric data were used to produce colour–colour and colour–magnitude diagrams, that can be
compared with results from theoretical modelling, with the aim to characterize the sources observed.
The comparison among the infrared colours and mag-nitudes of the AGB stars in the LMC and SMC shows some similarities but also significant differences, such as the num-ber of AGB stars in the two samples and the distribution of the stars observed among the various groups of the classifi-cations introduced.
D15 focused on the AGB stars in the LMC with the largest infrared emission, called “extreme” (Riebel et al. 2010, 2012); these stars were shown to give the largest con-tribution to the dust production rate of the LMC. One of the main findings of D15 was that this sample of extreme AGB stars was mainly (∼ 95%) composed of C–rich stars, whereas oxygen–rich AGB give a ∼ 5% contribution. This interpreta-tion was in agreement with the conclusions by Riebel et al. (2012), based on GRAMS models. C–stars in the extreme sample (the OCS and EOCS classes introduced in D15) were identified as low–mass stars, whose surface chemistry has been significantly increased in carbon; the oxygen–rich, extreme stars were interpreted as stars experiencing HBB (HBBS in D15).
In the analysis of the X-AGB population of the SMC, presented in section 5, we also find evidence of carbon– enriched objects and of stars experiencing HBB. However, the comparison with the LMC outlines two important dif-ferences.
First, by confronting Fig. 6 with Fig. 11 in D15, we note that the sequence of carbon stars in the CCD, discussed in section 5.2, is much shorter in the SMC: while in the LMC it extends to [3.6] − [4.5] ∼ 3, here we have [3.6] − [4.5] < 1.5.
Figure 11. The luminosity function of C–stars in the SMC found in the present work (black solid track) and in the investigation by Boyer et al. (2011) (red dotted). The blue dashed line is the luminosity function obtained with our models, when the same criterion used by Boyer et al. (2011) to separate C–stars from oxygen–rich objects is adopted.
The reason is the different progenitors of the C–rich AGB stars evolving to the reddest infrared colours in the two galaxies. D15 proposed that the EOCS sample, i.e. the car-bon stars in the LMC with the largest infrared emission, descend from stars of metallicity Z = 8 × 10⁻³ and ini-tial mass M ∼ 2.5 − 3 M . These stars formed during the
burst in the SFR of the LMC, which occurred ∼ 500Myr ago (Harris & Zaritsky 2009). The SFR of the SMC (see Fig. 1) presents a much narrower peak at those ages, with practi-cally no possibility to find stars within this range of mass in such an advanced and short evolutionary phase; conse-quently, the population of the most obscured C–stars in the SMC descend from stars of initial mass ∼ 1.5 − 1.7 M
and metallicity Z = 4 × 10⁻³, formed 1 − 1.5 Gyr ago, during the much longer, secondary peak in the SFR. The comparison between the evolutionary tracks of the 1.5 M
model of Z = 4 × 10⁻³ (middle panel of Fig. 3) and the 2.5 M model of Z = 8 × 10⁻³(right panel of Fig. 3) shows
that the latter evolves to much redder colours, which is the reason for the difference in the extension of the C–star se-quence in the observed CCD of the LMC and SMC. On the evolutionary side, as discussed in section 4.3, this dif-ference is entirely due to the larger amount of carbon ac-cumulated at the surface of the 2.5 M model, as a
con-sequence of the higher number of TDUs experienced. The values reached by the optical depth in the final AGB phases of these models is a further evidence of this behaviour: we
have τ10∼ 3 for (M, Z) = (2.5 M , 8 × 10⁻³) and τ10∼ 0.8
for (M, Z) = (1.5 M , 4×10⁻³) (see middle and right panels
of Fig. 2).
Turning to the oxygen–rich AGB stars, the sample of obscured stars in the SMC, discussed in section 5.3, includes a much smaller number of objects in comparison to the LMC. In the present work we find that the whole sample of X–AGB is almost entirely composed of carbon stars, with a very modest contribution from O–rich sources: Fig. 6 shows that the number of stars populating region IV in the CCD, where O–rich AGB stars evolve during the HBB phase (see section 5.3), is much smaller than in regions II and III, pop-ulated by carbon stars (see section 5.2). The comparison of the SFH of the two galaxies provides an explanation for this dissimilarity. According to D15, the stars belonging to the HBBS group of the LMC formed ∼ 100Myr ago, during a peak in the SFR of the LMC (Harris & Zaritsky 2009). Looking at Fig. 1, we note that the shape of the SFR of the SMC during the period 50–200 Myr ago is completely dif-ferent: at odds with the LMC, the SFR of the SMC presents a minimum in that period: a much smaller number of stars formed in that epoch, which motivates the paucity of AGB stars in region IV of the CCD.
The arguments presented here outline that the LMC is a much more favourable environment to investigate dust production by stars evolving through the AGB phase. The LMC, compared to the SMC, harbour a higher percentage of dust–enshrouded AGB stars with a large infrared emission; this holds for oxygen–rich objects and carbon stars. In the first case, the difference among the two galaxies is in the number of stars detected, whereas for dusty C–rich AGB stars we also find a qualitative dissimilarity, in the infrared colours of the most obscured sources, which are significantly redder in the LMC.
The peculiar evolution of the SFR of the LMC is the reason for the presence of such a large percentage of highly obscured AGB stars in this galaxy. This is because the SFR peaks in the two epochs (∼ 100 Myr and ∼ 500 Myr ago) when, based on our models of dusty AGB stars, the objects with the highest degree of obscuration formed.
100 Myr is the evolution time of ∼ 5 − 6 M stars: this
is the range of mass of stars experiencing strong HBB (tem-perature at bottom of the convective envelope T > 90 MK) during the AGB phase, with the formation of large amounts of dust and a high infrared emission. Within the sample of oxygen–rich stars, these are the sources which reach the largest degree of obscuration. Models of higher mass would also evolve to extremely red colours; however, a very few stars in this range of mass are expected, for reasons asso-ciated to the mass function and the short duration of the AGB phase of stars in this mass range.
An earlier episode of strong star formation took place in the LMC ∼ 500 Myr ago. This is the formation epoch of Z = 8 × 10⁻³stars of mass in the range 2.5 − 3 M . Among
all the stars evolving through the C–star phase, these are the stars experiencing the highest number of TDU episodes, thus accumulating the largest quantities of carbon in the surface regions: the winds of these stars are therefore an extremely favourable environment for the formation of carbonaceous solid particles, which explaines their extremely red infrared colours. Fig. 3 shows that the evolutionary tracks of stars in this range of mass, and metallicity Z = 4, 8 × 10⁻³, are


![Figure 3. Evolutionary tracks in the colour–colour ([3.6] − [4.5], [5.8] − [8.0]) plane of AGB stars of different initial mass and metallicity Z = 10 −3 (left panel), Z = 4 × 10 −3 (middle) and Z = 8 × 10 −3 (right)](https://thumb-eu.123doks.com/thumbv2/123dokorg/8096039.124778/9.918.78.802.167.398/figure-evolutionary-tracks-colour-colour-different-initial-metallicity.webp)
![Figure 6. Left: the distribution of the AGB sample of the SMC by Boyer et al. (2011) in the colour–colour ([3.6]−[4.5], [5.8]−[8.0]) plane.](https://thumb-eu.123doks.com/thumbv2/123dokorg/8096039.124778/12.918.86.787.179.519/figure-left-distribution-sample-boyer-colour-colour-plane.webp)
![Figure 7. The same as Fig. 6, but referred to the colour–magnitude ([3.6] − [8.0], [8.0]) plane](https://thumb-eu.123doks.com/thumbv2/123dokorg/8096039.124778/13.918.92.785.182.517/figure-fig-referred-colour-magnitude-plane.webp)
![Figure 9. The same as Fig. 8, but referred to the colour–magnitude ([3.6] − [8.0], [8.0]) plane.](https://thumb-eu.123doks.com/thumbv2/123dokorg/8096039.124778/14.918.88.788.182.514/figure-fig-referred-colour-magnitude-plane.webp)
![Figure 10. Left: the distribution on the colour–magnitude ([3.6] − [8.0], [8.0]) plane of the AGB sample of the SMC by Boyer et al.](https://thumb-eu.123doks.com/thumbv2/123dokorg/8096039.124778/15.918.87.786.185.519/figure-left-distribution-colour-magnitude-plane-sample-boyer.webp)

