A
Al
l
ma
m
a
M
Ma
at
te
er
r
S
St
tu
u
di
d
i
o
o
ru
r
um
m
–
–
U
Un
n
i
i
ve
v
er
rs
si
i
tà
t
à
d
d
i
i
B
Bo
ol
lo
o
gn
g
na
a
DOTTORATO DI RICERCA IN
CHIMICA
Ciclo XXIX
Settore Concorsuale di afferenza: 03/A1 – Chimica Analitica
Settore Scientifico disciplinare: CHIM/12 – Chimica dell’ambiente e dei beni
culturali
APPLICATION OF ENVIRONMENTAL SUSTAINABILITY
ASSESSMENT METHODOLOGIES TO WASTE MANAGEMENT
SYSTEMS AND TO ENERGY AND MATERIAL RECOVERY
PROCESSES
Presentata da: Esmeralda Neri
Coordinatore Dottorato
Relatore
Prof. Aldo Roda
Prof. Fabrizio Passarini
i Canditate Presentation
During the three years of her PhD, Esmeralda Neri focused her research project on the study of the application of the Life Cycle Assessment methodology (LCA) to industrial chemical processes, and to processes of energy and material recovery and waste management, in collaboration with many companies of the sector.
She studied the topic of the transformation of residual biomass to renewable energy; the main applications related to this issue were the process of gasification of wood chips with the production of thermal energy and electricity, and the recovery of branches arising from the operation of management of public and private green on local scale for the production of thermal energy.
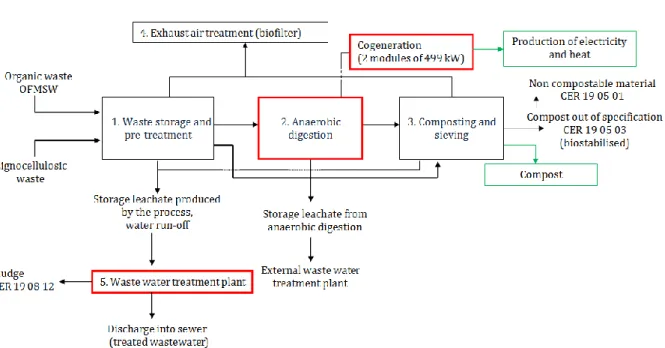
The candidate focused the work also on the study of the evolution over time of the impact of an organic waste treatment plant (integrating composting and anaerobic digestion) with the aim to assess whether and how the introduction of the energy recovery system lead to a real improvement of the process with an overall decrease of the environmental impacts.
In 2014 she has participated in the Pioneers into Practice program, with a national placement at the company I.R.C.I. S.p.A. based on a feasibility study for the generation of energy from agro-industrial residues by anaerobic fermentation plant (biogas) and an international placement at the University of Valencia with the study of the energy content associated with the different use of water. From 2015 she is one of the Local representative Climate-KIC Alumni Association.
In addition, Esmeralda Neri spent a period of research at the Universitat Autònoma de Barcelona under the supervision of Prof. Xavier Gabarrell Durany, where she has approached to the integration of green metrics (CO2ZW) and methodologies of environmental impacts (LCA, Material Flow Analysis) for the assessment of the carbon footprint of a waste management system, focusing the study also on the avoided impact due to the process of recycling of paper.
During the last year she also approached to the study of the management of the end of life of tires, with the assessment of different scenarios of material and energy recovery, with a particular attention to the pyrolysis process.
Moreover, she was also involved in works related to the application of the LCA methodology to chemical processes, focused mostly on maleic anhydride and terephthalic acid production.
ii
She has been the co-supervisor of four 2nd level degrees thesis in Industrial Chemistry proving a great ability in coordination of the activities of the students.
During the PhD, the candidate attended the School Green Skills for boosting transitions in water management (Valencia, 2014), the National School of Chemistry of the Environmental and Cultural Heritage (2015) and Course of Life Cycle Costing and Social Life Cycle Assessment (2016), several scientific seminaries, three national congresses and two international congresses with oral communication. Furthermore the research activity carried out in this three years is reflected in one article.
In my opinion Esmeralda Neri has carried out a very good work for the thesis.
The Board expresses a very good score on the activity carried out by the candidate during the whole cycle of doctorate and considers her worthy to attain the PhD in Chemistry.
iii Index
Candidate presentation i
Index iii
List of tables vi
List of figures viii
Abbreviations xii
Abstract xiv
1. Introduction 1
1.1 Circular Economy Background 1 1.2 Normative Background 5 1.3 Motivation and structure of the work 8 References 10 2. Methodology 12
2.1 LCA Methodology 12 2.2 History of the LCA 12
2.3 Goal and scope definition 14 2.3.1 System boundaries definition 14 2.3.2 Functional unit definition 15 2.3.3 Allocation criteria 15 2.4 Life Cycle Inventory (LCI) 16
2.4.1 Quality and reliability of data 16 2.5 Life Cycle Impact Assessment (LCIA) 18 2.5.1 Classification 18 2.5.2 Characterization 19 2.5.3 Normalization 19 2.5.4 Weighing 19 2.5.5 ReCiPe 2008 method 20 2.5.5.1 Human Health 22 2.5.5.2 Ecosystem Diversity 22 2.5.5.3 Resource Availability 23 2.5.6 The “Cultural Theory” 24 2.5.7 Cumulative Energy Demand 25
iv
2.5.8 Global Warming Potential 26
2.6 Interpretation 27
2.7 Analysis of data quality 27
2.7.1 Uncertainty analysis 29 2.8 Sensitivity analysis 30 2.9 Contribution analysis 30 2.10 Software SimaPro 31 2.11 Ecoinvent database 31 References 33 3. Waste management 35 3.1 Background 35
3.2 The case study of the evolution over time of a bio-waste treatment
plant 37
3.2.1 Background and motivation 37
3.2.2 Plant description 38
3.2.3 Goal and scope definition 45
3.2.4 Life Cycle Inventory (LCI) 47
3.2.5 Impact assessment and results interpretation 59
3.2.6 Uncertainty analysis 66
3.2.7 Personal conclusions and recommendation 68 3.3 The case study of the integration of different methodologies for the
assessment of waste management systems environmental
impact. 69 3.3.1 Green metrics 71 3.3.1.1 CO2ZW® 72 3.3.2 Future developments 74 3.3.4 Conclusions 75 References 76
4. Energy recovery processes 79
4.1 Background 79
4.2 The case study of Biomass Residues to Renewable Energy applied at
Local Scale 82
4.2.1 Background and motivation 82
v
4.2.3 LCI of Current Heating System 84
4.2.4 LCI of Wood Residues Chain 87
4.2.5 Impact assessment and results interpretation 89 4.2.6 Personal conclusions and recommendation 94 4.3 The case study of Gasification of wood chips arising from virgin
biomass 95
4.3.1 Background: use of woody biomass for energy production through the
gasification technology 95
4.3.2 Comparison with direct combustion of biomass 96
4.3.3 Life Cycle Inventory (LCI) 97
4.3.4 Life Cycle Impact Assessment (LCIA) 103
4.3.5 Personal conclusions and recommendation 107
4.4 The concept of Industrial symbiosis 108
4.5 The case of the feasibility study of the energetic valorization of agro-industrial residues through an anaerobic fermentation plant
(biogas) 109
4.5.1 Background: agriculture and renewable sources 109
4.5.2 Study of the system 111
4.5.3 Feasibility study 113
4.5.3.1 Simulation A 113
4.5.3.2 Simulation B 119
4.5.4 Future scenarios: the new Decree for the promotion of biogas plants
for the production of Biomethane 124 4.5.5 Personal conclusions and recommendation 124
References 127
5. Material recovery processes 131
5.1The case study of a pyrolysis process applied to end-of-life tires 131
5.1.1 Background and motivation 131
5.1.2 Goal and scope definition 134
5.1.3 Life Cycle Inventory (LCI) 135
5.1.4 Impact assessment and results interpretation 138
5.1.5 Future developments 145
References 146
vi
vii List of Tables
Table 2.1. Midpoint categories and their associated indicators. Table 2.2. Categories used in the CED method.
Table 2.3. GWP of some gases. Table 2.4. Quality pedigree matrix.
Table 3.1. Control parameters of the process. Table 3.2. Detail of thermal power recovered. Table 3.3. Main plant emissions.
Table 3.4. Flows of material and energy in and out of the plant. Table 3.5. Product composition of bio-stabilized.
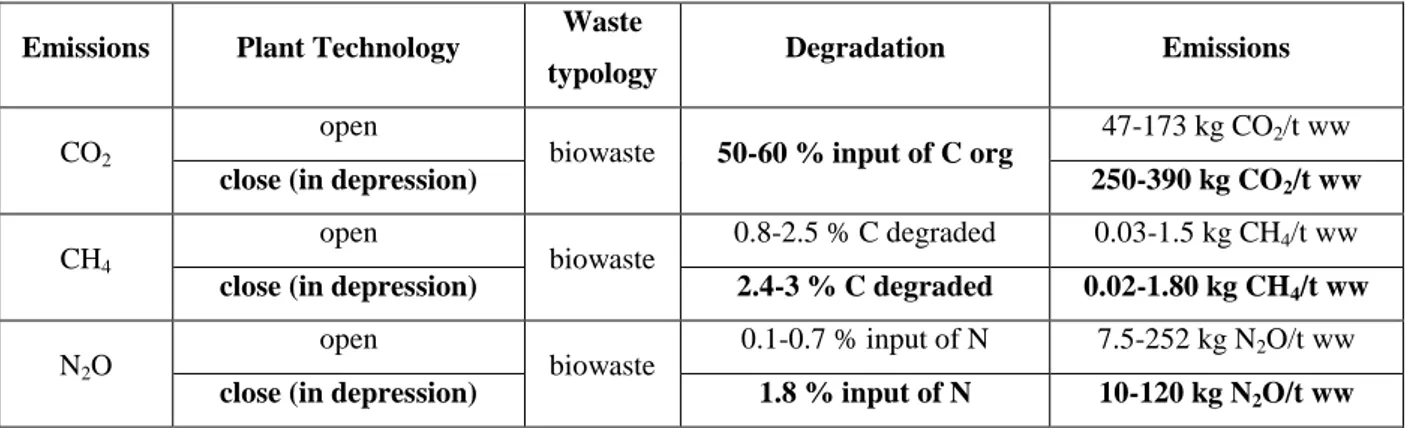
Table 3.6. Gaseous emissions during the composting process of organic waste. Table 3.7. Flows of waste from out of the region and distances of transport. Table 3.8. Characterization table considering the endpoint damage category.
Table 3.9. Quantity of non-compostable material produced (CER 19 05 01) and type of
final disposal.
Table 4.1. Life Cycle Inventory (LCI) for the current heating system scenario. NG:
natural gas.
Table 4.2. LCI for the wood-residues scenario.
Table 4.3. Comparison between the current heating system and the wood-based scenario
for the production of 1 MWh of thermal energy, at midpoint level. The expression eq. stands for equivalent; and PMF: particulate matter formation.
Table 4.4. % of timber in input to the plant.
Table 4.5. Summary data relating to the system of gasification, used in LCA modeling. Table 4.6. Common input.
Table 4.7. Comparison between wood chips gasification scenarios, Single score,
midpoint impact categories.
Table 4.8. SWOT table about valorization of agro-industrial residues. Table 4.9. Master data sheet INPUT-OUTPUT realized by ENEA.
Table 4.10. Revenues\costs resulting from the management of waste resulting from the
processes of the company A.R.P. Tomato.
Table 4.11. Residues data of the members of the consortium. Table 4.12. Input plant built at A.R.P.
viii Table 4.14. Electricity production Simulation A. Table 4.15. Thermal production Simulation A.
Table 4.16. Revenues from sales of electricity Simulation A. Table 4.17. Investment costs Simulation A.
Table 4.18. Financial cost Simulation A. Table 4.19. Operating Cost Simulation A. Table 4.20. Summary Simulation A.
Table 4.21. Input plant built at company n. 3. Table 4.22. Main component Simulation B. Table 4.23. Electricity production Simulation B. Table 4.24. Thermal energy production Simulation B Table 4.25. Revenues Simulation B.
Table 4.26. Investment costs Simulation B. Table 4.27. Financial cost Simulation B. Table 4.28. Operating costs Simulation B. Table 4.29. Summary Simulation B
Table 5.1. Emissions associated with the recovery of energy from ELT. Table 5.2. Emissions associated with the recycling of ELT.
Table 5.3. Single Point: impact of the Curti s.p.a. process, impact categories midpoint. Table 5.4. Single Point: impact of the pretreatment processes, impact categories
midpoint.
Table 5.5. Single Point: impact of energy recovery processes, impact categories
midpoint.
Table 5.6. Single Point: impact of material recovery processes, impact categories
ix List of Figures
Figure 1.1. The four spheres of Sustainable Development. Figure 2.1. Foreground and background systems.
Figure 2.2. Midpoint and endpoint categories in the ReCiPe 2008 model. Figure 2.3. The five archetypes of Cultural Theory.
Figure 3.1. Representation of the concept of sustainable development. Figure 3.2. Lay-out of the traditional composting plant (year 1).
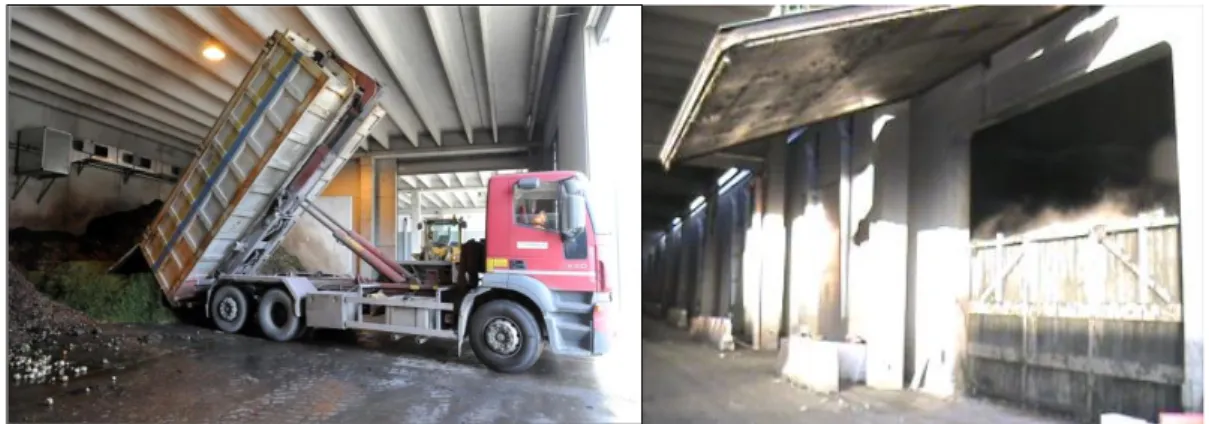
Figure 3.3. Plant lay-out with the integrated anaerobic-aerobic system (year 7). Figure 3.4. Wet organic waste conferring step and Open fermenter with sealing grill. Figure 3.5. Digestate material to the opening of the fermenter.
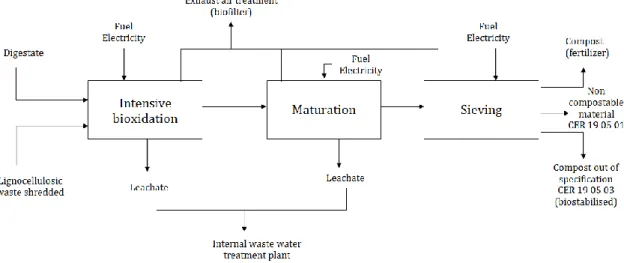
Figure 3.6. Flows of matter and energy from the anaerobic fermentation process. Figure 3.7. Flows of matter and energy of the composting phase (years 6-7).
Figure 3.8. Product fraction over screening: screening material such as, woody fraction,
plastic fraction.
Figure 3.9. Bio-stabilized (EWC 190503).
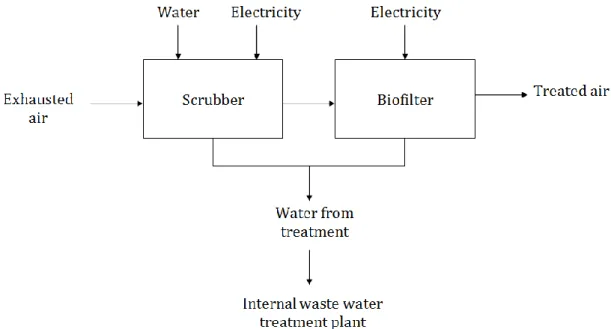
Figure 3.10. Scheme of flows of matter and energy to the phase of exhausted air
treatment, years 4-7.
Figure 3.11. Schematic flows of matter and energy of the waste water treatment plant,
years 6-7
Figure 3.12. Boundaries of the system.
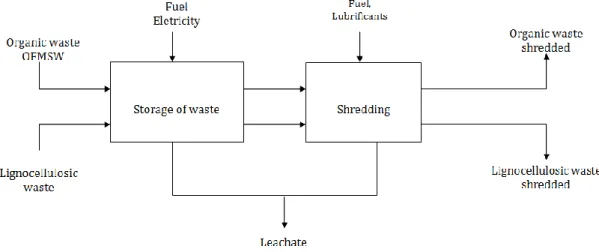
Figure 3.13. Flows of matter and energy to the phase of storage and pre-treatment of
waste.
Figure 3.14. Rendering of the system (year 1). Figure 3.15. Rendering of the system (year 7).
Figure 3.16. Single point: midpoint impact categories for the process of transport of
organic waste, scenarios years 1-7.
Figure 3.17. Single Point: impact of the process scenarios for years 1-7, impact categories endpoint
Figure 3.18. Single Point: impact of the process scenarios for years 1-7, midpoint impact
categories.
Figure 3.19. Single Point: impact of the process with the extension of the boundaries to
the organic waste management in Italy for the scenarios years 1-7, impact categories endpoint.
x
Figure 3.20. Single Point impact of the process with the extension of the boundaries to
the bio-waste management in Italy for the scenarios from year 1 to year 7, midpoint categories.
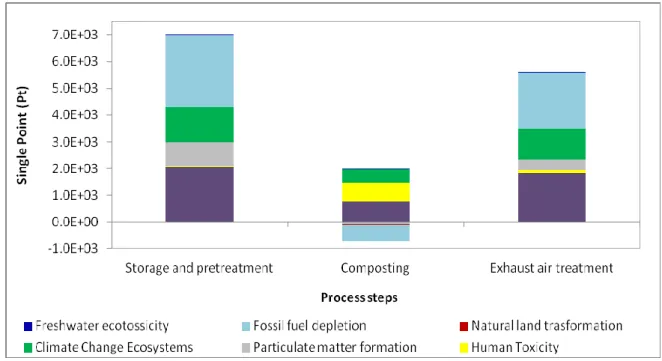
Figure 3.21. Single Point impact of the different phases of the process for year 1,
midpoint categories.
Figure 3.22. Single Point impact of the different phases of the process for year 7,
midpoint categories.
Figure 3.23. Contribution analysis of year 1. Figure 3.24. Contribution analysis of year 7.
Figure 3.25. Monte Carlo Analysis: process year 1 (A) vs process year 7 (B), single
point.
Figure 3.26. Monte Carlo Analysis: process year 1 (A) vs process year 7 (B), single
point.
Figure 3.27. Monte Carlo Analysis: process year 1 (A) vs process year 7 (B), midpoint
categories.
Figure 3.28. Monte Carlo Analysis: process year 1 (A) vs process year 7 (B),
characterization endpoint.
Figure 3.29. Fate of the different waste fraction collected by COSMARI Figure 3.30. Carbon footprint for type of impact.
Figure 3.31. Carbon footprint per waste flows. Figure 3.32. Total carbon footprint.
Figure 4.1. European and Italian renewables in 2012.
Figure 4.2. System boundaries LCA for (A) the current heating system and (B) the
alternative bio-based system.
Figure 4.3. Single score assessment: comparison between the current heating system
and the wood-based scenario for the production of 1MWh of thermal energy.
Figure 4.4. Contribution on cumulative score and potentialities of improvement. Figure 4.5. Network tool on cumulative score.
Figure 4.6. Single score assessment: comparison between the traditional wood-based
scenario with the scenario with less km, for the production of 1 MWh of thermal energy.
Figure 4.7. Damage assessment distribution among the two scenarios. Figure 4.8. Diagram gasification plant.
xi Figure 4.9. Boundaries of the scenario A. Figure 4.10. Boundaries of the scenario B.
Figure 4.11. Boundaries of the scenario C. Figure 4.12. Boundaries of the scenario D.
Figure 4.13. Comparison between wood chips gasification scenarios, Single score,
midpoint impact categories.
Figure 4.14. Comparison between the wood chips gasification scenarios, in terms of
Cumulative Energy Demand (CED), relative to 1MWh of electricity as functional unit.
Figure 4.15. Comparison between the wood chips gasification scenarios, in terms of
Global Warming Potential (GWP), relative to 1MWh of electricity as functional unit.
Figure 4.15. Comparison between the wood chips gasification scenarios, in terms of
Global Warming Potential (GWP), relative to 1MWh of electricity as functional unit.
Figure 4.16. Comparison between the wood chips gasification scenarios, in terms of
Water Footprint, relative to 1MWh of electricity as functional unit.
Figure 4.17. Objectives of industrial symbiosis.
Figure 4.18. % of mass of residues of A.R.P. and of the other members of the total of the
production of electricity.
Figure 4.19. % of energy of residues of A.R.P. and of the other members of the total of
the production of electricity
Figure 4.20. % mass of residues from company n. 3 and from the other members
(including A.R.P.) for the production of electricity.
Figure 4.21. % energy of residues from company n. 3 and from the other members
(including A.R.P.) for the production of electricity.
Figure 5.2. Flow diagram Curti s.p.a. pyrolysis plant.
Figure 5.3. Single Point: impact of the Curti s.p.a. process, impact categories endpoint. Figure 5.4. Single Point: impact of the Curti s.p.a. process, impact categories midpoint. Figure 5.5. Single Point: impact of pretreatment processes, impact categories midpoint. Figure 5.6. Single Point: impact of the energy recovery processes, impact categories
endpoint.
Figure 5.7. Single Point: impact of energy recovery processes, impact categories
xii
Figure 5.8. Single Point: impact of the material recovery processes, impact categories
endpoint.
Figure 5.9. Single Point: impact of material recovery processes, impact categories
midpoint.
Figure 5.10. Single Point: impact of the material recovery processes, impact categories
xiii Abbreviations
CED Cumulative Energy Demand CF Characterization Factor CML Centrum Milieukunde Leiden COD Chemical Oxygen Demand COP Conference of Parties
DALY Disability Adjusted Life Year DfE Design for Environment EA Environmental Assessment ED Ecosystem Diversity ELT End of Life Tires
EPA Environmental Protection Agency EU European Union
EWC European Waste Catalogue GHGs Green House Gases
GWP Global Warming Potential HH Human Health
IEA International Energy Agency
IPCC Intergovernmental Panel on Climate Change IPP Integrated Product Policy
ISO International Standards Organization LCA Life Cycle Assessment
LCC Life Cycle Costing LCI Life Cycle Inventory
LCIA Life Cycle Impact Assessment LHV Lower Heating Value
MBT Mechanical-biological treatment MCI Marginal Increase in the Cost MFA Material Flows Analysis MSW Municipal Solid Waste
MUD Model of Environmental Declaration NG Natural Gas
xiv
ORC Organic Rankine Cycle
PAH Polycyclic aromatic hydrocarbons
PDF Potential Disappeared Fraction of species PMF Particulate Matter Formation
RA Resource Availability RDF Refuse Derived Fuel
REPA Resource and Environmental Profile Analysis SD Density of the Species
SETAC Society of Environmental Toxicology and Chemistry sLCA Social Life Cycle Assessment
SNCR Selective Non-Catalytic Reduction
SWOT Strengths Weaknesses Opportunities Threats UNEP United Nations Environment Program
UNESCO United Nations Educational, Scientific and Cultural Organization YLD Years of Life Lived with a Disability
xv Abstract
During the PhD program in chemistry, curriculum in environmental chemistry, at the University of Bologna the sustainability of waste management systems and of energy and material recovery processes was investigated through the application of the LCA (Life Cyle Assesment) methodology, which allows a systematic approach that supports the detection of environmental-oriented strategies to obtain industrial improvements.
The study is intended to help analyses aimed at understanding the global effects of the waste management sector and the efforts were focused on the integrated waste management system and on systems of recovery of energy and materials in order to investigate the best way to manage waste taking into account the technologies available on the market and the features of each situation at local scale, evaluating their sustainability in comparison with traditional systems, from a life cycle perspective. The environmental benefits associated with changes and improvements of the adopted solutions were assessed through a global approach.
Results emerged from the analysis confirms that the sustainability in the waste management sector should be evaluated considering all the stages and flows involved in each system in order to avoid the shifting of the environmental burdens from a step to another. Only a deeper knowledge may help to address successfully the challenge towards a transition to a more sustainable use of resources and to guide future national industrial policy toward a low-carbon economy.
In the future, LCA analysis should be increasingly supported even by other tools able to investigate the other two dimension of sustainability, represented by the social and the economic spheres.
1 1. Introduction
1.1 Circular Economy Background
The energy and environmental crisis, linked to the availability and use of resources of the planet, have been at the center of a global debate from nearly half a century; despite that, for too long it has been faced in a non-systematic way.
The continuous growth of the world population and the rise of living standards have increased the demand of energy, raw materials and goods. This increase of demand is correlated, due to the use of linear model of production – consumption – waste generation, to the reduction of resources availability and to the increase of greenhouse gases production. The central aspect had always been the productivity, with the need to maintain a high standard of consumption in order to guarantee it. For these reasons it is essential to apply and spread more sustainable development models.
The Sustainable Development theory, introduced in the 80ies, made possible to tackle the problem at scientific and institutional level. Secondly, the Green Economy model has been developed, which plans to realize the improvement of welfare and social equity reducing environmental risks, mentioned for the first time in 1992 during the Rio Conference, and it is achieved through an increasing sustainability assessment of production processes and of resources efficiency.
Therefore, the first time the Sustainable Development was mentioned dates back to 1987, in the Brundtland Report, which states that the “sustainable development is a process of change in which the exploitation of resources is consistent with the future needs as well as with the current ones” [1], tying in a interdependent relationship the protection and valorization of natural resources with the economic, social and institutional spheres. This kind of approach leads to the Circular Economy model, in which the residues arising from production processes can assume a value for other production processes, in a perspective of Industrial Symbiosis. The Circular Economy is now promoted by numerous official documents of the European Commission, such as the Europe strategy to 2020 [2] and the Circular Economy Package of 2015 [3] and in the same year, the climate conference in Paris COP 21 has also reinforced this approach to this issue, by imposing restrictions to the exploitation of resources of the Planet and to global warming.
2
Later, in 1991 Herman Daly defined the Sustainable Development as “the development that remains within the carrying capacity of ecosystems” [4], introducing the conditions to guarantee it:
- the human burden must not exceed the carrying capacity of the nature; - the use rate of renewable resources should not exceed their regeneration rate;
- the release of pollutants and slag should not exceed the absorption capacity of the environment;
- the extraction of non-renewable resources must be compensated by the production of an equal amount of renewable resources.
In 2001 The United Nations Educational, Scientific and Cultural Organization (UNESCO) expanded the concept of Sustainable Development by inserting another parameter to consider the cultural diversity [5], which must be guarantee by the Institutions. So the four pillars become (Figure 1.1.):
- Environmental Sustainability, the ability to preserve over time the environmental functions, to maintain the quality and the reproducibility of natural resources. This goal is achieved through the efficiency improvement of processes and the application of the Life Cycle Assessment (LCA) methodology;
- Economic Sustainability, the capacity of an economic system to generate a lasting growth, meant as income and work;
- Social Sustainability, the ability to ensure the welfare conditions to human beings, promoting health and safety of workers, education and solidarity;
- Institutional Sustainability, the ability to ensure stability, democracy, participation and justice, ensuring the respect for diversity and human rights.
Indeed, in recent years, in addition to the Life Cycle Assessment (LCA) methodology, other methods have been developed, whose purpose is to assess the impacts related to also the other spheres: the Life Cycle Costing (LCC), to evaluate the economic impact of a process/system, and the Social Life Cycle Assessment (sLCA), able to investigate the social sustainability.
These four dimensions should be analyzed in a systematic vision to achieve a common goal.
3
Figure 1.1. The four spheres of Sustainable Development [5].
The implementation of the maintenance of the four spheres is possible through the Green Economy approach. The definition globally and institutionally recognized is the one given by the United Nations Environment Program (UNEP) in 2011, that defined it as “an instrument that is able to realize the improvement of the welfare and of the social equity reducing environmental risks” [6].
The Green Economy is therefore a model that could be applied through the Industrial Ecology, the discipline that deals with the design and management of industrial systems, taking the natural systems as a model and his goal is to understand the interactions between economic activities and the environment. Then Industrial Ecology gives to companies a tool to achieve a sustainable and competitive economy. The principle on which it is based is the closure of the production cycles, starting from the assumption that, as in natural systems, there are no waste but only by-products to be reused. In this way, Industrial Ecology principles are linked to validation tools such as the Life Cycle Assessment, the integrated environmental monitoring and Risk Analysis and can be applied to integrated systems of waste management, in such a way to minimize the impacts and valorize the waste.
This thesis is inserted in this context and will deal with the application of the Life Cycle Assessment methodology to integrated waste management systems.
4
In addition to the analogy with natural systems and the introduction of a closed cycle economic model, there are others key concepts, that characterize the Industrial Ecology [7]:
- analysis of the system which allows a broad view of the relationships between human activities and the environment;
- study of the flows and transformation of matter and energy, in order to establish how the various products, by-products and waste can be used, reused and converted into others goods and services;
- a multidisciplinary approach to study a problem.
Industrial Ecology is based on eleven principles, formulated by Allenby in 1995 [8]: 1. products, processes, services and activities can produce residues, but not waste; 2. each process must be designed to be easily adapted to innovations preferable from
the environmental point of view;
3. each molecule that enters a process, it must leave it as part of a commercial product;
4. each erg of energy used must produce a transformation of matter; 5. industries must minimize the use of materials and energy;
6. materials used must be the least toxic available;
7. industries must use most of the necessary materials obtained from recycling; 8. each product must be designed to preserve the inherent utility of the materials
used;
9. each product must be designed in order to be able to be used to create, at the end of his life, others useful products;
10. every industrial property must be developed taking care to maintain or improve the local habitat;
11. it must be promoted the interaction between material suppliers and users in order to develop cooperation to minimize packaging and to promote the recycling and reuse of materials.
The eleven principle are actuated through the application of tools [9], such as:
- Material Flows Analysis (MFA), to follow and quantify the flows of materials in the production chain;
5
- Life Cycle Assessment (LCA), which considers all the environmental impacts associated with each step of the industrial development;
- Green Policies, i.e. European Directives, national legislations, environmental certifications, extended producer responsibility;
- Industrial Symbiosis, which considers waste and by-products of a process as resources for other processes.
By aggregating the contributions of these disciplines and themes the definition of Circular Economy was provided by Ellen MacArthur Foundation, intended as “an economy that regenerates and reconstructs, through the design, and whose objective is to maintain products and materials to their maximum utility value at any time. It reproduces the nature in the way to improve and optimize the systems through which operates” [10]. The Circular Economy results in a continuous development cycle that optimizes the availability of resources and minimizes the risks, using renewable resources. The Circular Economy is also mentioned in the documents of the European Commission [11] and is based on three fundamental principles:
- preserve and increase the natural capital; - optimize the availability of resources; - increase the efficiency of systems.
1.2 Normative Background
In Europe, the management of municipal solid waste has undergone significant changes over the paste twenty years.
For many decades, Europe has witnessed a growth of prosperity and welfare based on an intensive use of resources. Today, however, it is faced with a double challenge: to promote the growth needed to create jobs and prosperity for citizens and at the same time to ensure a sustainable future.
The World Business Council for Sustainable Development estimates that by 2050, it will be necessary to multiply the resources efficiency from 4 to 10 times, with important improvements to be achieved already by 2020 [12]. This transformation requires a policy framework that rewards innovation and resource efficiency and able to create the conditions for new economic opportunities for a greater security of supply through product redesign, sustainable management of environmental resources, the promotion of recycling and reuse, the replacement of materials and the saving of resources.
6
The EU economy currently loses a significant amount of potential secondary materials present in the waste stream. In 2013 in the EU in total about 2.5 billion tons of waste were generated; of these 1.6 billion have been neither reused nor recycled, going completely lost. It is estimated that it would be possible to recycle or reuse further 600 million tons of waste and that a more efficient use of resources along the entire value chain could reduce the need for the 17-24% of material inputs by 2030, with savings for the European industry of the order of 630 billion euro/year, that is the 8% of the annual turnover, while reducing the total annual emissions of greenhouse gases for the 2-4% [13].
In a perspective of a greater resource efficiency, the transformation of waste into resources is a crucial element as well as the missing link to achieve a circular economy. Thanks to a more ambitious waste policy it could be possible to obtain major advantages: a sustainable growth and the creation of job, the reduction of greenhouse gas emissions, savings related to the improvements of the waste management practices and a better environment.
Ensuring continuity to a more efficient use of resources can bring significant economic benefits. In an ideal circular economy systems products maintain their added values as long as possible and there is no waste. When a product reaches the end of its life cycle, the resource remains within the economic system, so that it can be reused several times, thus creating new value, even if also in a highly developed circular economy some elements of linearity remain, because the demand of virgin resources could hardly be completely stopped and the residual waste generated must be disposed.
Therefore, the European environmental policy aims at taking also into account the diverse situations in various regions and is founded on the principles of precaution, of preventing environmental damages at source, and of “polluter pays”.
Waste management must follow policies based on the “3R” concept of reduction, reuse and recycling. As for the European context, the framework Directive on Waste 2008/98/EC [14] identifies the so-called waste hierarchy:
1. prevention: the top priority for all stages of circular economy is to ensure to produce less waste.
2. preparation for reuse; 3. recycling;
4. recovery (including energy recovery); 5. disposal.
7
In November 2013, the 7th Environment Action Plan of the European Union for Environment [15] was adopted and will guide until 2020 the Community policy. It sets out that it is necessary to intensify the efforts to protect the natural capital, stimulate growth and innovation in a low-carbon and resource-efficient economy and safeguard health and welfare of population, respecting the limits of the Earth.
In detail, the Seventh European Action program identifies specific actions to give full implementation to EU legislation on waste, which primarily require the application of the waste hierarchy and the effective use of instruments and other market measures to ensure that:
- landfills are restricted to the residual waste (non-recoverable and non-recyclable); - energy recovery should be limited to non-recyclable materials;
- recycled waste are used as the main and reliable source of raw materials for the European Union, through the development of non-toxic materials cycles;
- hazardous waste must be managed responsibly and its generation must be reduced; - there will not be an illegal transportation of waste, with a rigorous monitoring support; - food waste must be reduced.
For this purpose at European level a review of the legislation in force about products and waste is ongoing, including a review of the objectives of the main directive on waste, in line with the Roadmap to a Resource Efficient Europe [12].
For a reduction of the consumption of fossil fuel, the European Commission planned this objectives:
- greater energy efficiency (20% by 2020);
- replacement with renewable resources (20% by 2020, 10% in transport); - 20% reduction of greenhouse gas emissions by 2020;
- use of recyclable/biodegradable packaging; - enhancement of biodegradable waste composting.
The waste management policy must necessarily take into account the priorities identified at European level, first and foremost the stop of landfill disposal and the activation of useful actions to realize the decoupling between economic indicators and the generation of waste.
In 2015, during COP 21, a new Circular economy package was created [3, 11], submitting a review of legislative proposals on waste management with the aim to increase the recycling rate and reduce landfilling:
8
- to increase to 65% by 2030 the target for preparation for reuse and recycling of municipal waste;
- to increase the percentage of municipal waste reused and recycled, reaching at least 70% by 2030;
- to increase the percentage of recycled packaging waste, until 80% by 2030; - to reduce the landfilling of all waste to a maximum value of 10% by 2030; - to ban the landfilling of waste from separate collection;
- to promote the Industrial Symbiosis.
- to promote the development of the market of secondary raw materials of quality.
In six Countries landfilling of municipal solid waste has already been abolished, with percentage over the last twenty years from 90% to less than 5% and a recycling rate up to 85% in some Regions, while in other Countries more than 90% of the waste is still disposed in landfills and less than 5% recycled [13].
The landfilling of all recyclable waste will be prohibited by 2025 and the Member States should endeavor to eliminate this practice by 2030. Moreover, energy recovery, even by waste to energy plants and bio-fuels, will offer a solution only for reusable and non-recyclable waste and the landfilling or incineration should not be eligible for subsidies in the future.
1.3 Motivation and structure of the work
The sustainability in the waste management sector represents one of the primary target of our society mainly because its environmental footprint is not limited to a defined area but it has serious repercussions all over the world.
This is the reason why a great effort at legislative level and of organization was devoted to applied researches with the aim to mitigate these aspect and provide new solutions; among many, it is worth noting the EIT (European Institute of Innovation & Technology), an independent body of the European Union set up in 2008, that spurs innovation and entrepreneurship across Europe to overcome some of its greatest challenges.
Each of us should try to be an active part of change and an industrial chemist with an environmental background could be a perfect figure to connect chemists and engineers, with a contribution of transversal knowledge on various sectors.
9
For this reason, the research conducted during this doctoral thesis at the Department of Industrial Chemistry “Toso Montanari” of the University of Bologna, under the supervision of the Prof. Fabrizio Passarini, aims at applying the LCA methodology to waste management systems, to processes of recovery of energy and of materials.
The main goal was to investigate in depth the LCA methodology, understanding the strengths and gaps of its application in the waste management sector, using it as a screening tool in order to support the procedure of decision making. This approach was applied to several case studies taking into account the features of the various areas investigated and choosing those witch represent the most developed technologies. In every case study, a comparison with alternative systems was carried out verifying the preferred solution from the environmental point of view: only a holistic approach is able to assess sustainability along the whole system and evaluate the effective gain associated with system changes.
Thus, in order to provide an overview of the work carried out during the three years program, the work has been structured as follows:
- in Chapter 1, there is an introduction to the circular economy theme and to the reference legislation;
- in Chapter 2, the Life Cycle Assessment methodology has been studied;
- then, with the Chapter 3 starts the experimental sections, first analyzing waste management systems, taking into account two different cases study;
- secondly, in Chapter 4 the energy recovery processes have been investigated through three different systems;
- finally material recovery processes have been analyzed in Chapter 5;
- lastly, Chapter 6 outlines the main conclusions and personal considerations that should be given to the study.
10 References
1. World Commission on Environment and Development. (1987). Our common future. Oxford: Oxford University Press.
2. European Commission (2010). Obiettivi della strategia Europa 2020. Available online at:
https://ec.europa.eu/info/strategy/european-semester/framework/europe-2020-strategy_en (Accessed on March 2017).
3. European Commission. (2 December, 2015). Circular Economy Package: Questions & Answers. Available online at:
http://europa.eu/rapid/press-release_MEMO-15-6204_en.htm (Accessed on March 2017).
4. Daly, H. E. (1991). Steady-state economics. Washington: Island Press.
5. UNESCO. (2001). Universal Declaration on Cultural Diversity. Paris: United Nations Educational, Scientific and Cultural Organization.
6. UNEP. (2011). Towards a Green Economy: Pathways to Sustainable Development and Poverty Eradication. New York: UNEP.
7. Garner, A., & Keoleian, G. (1995). Industrial Ecology: an introduction. Pollution Prevention and Industrial.
8. Allenby, B. (1995). Industrial Ecology: policy Framework and Implementation. Upper Saddle River: Prentice Hall.
9. Passarini, F., Morselli, L., Boneschi, S., Vassura, I., Santini, A., Ciacci, L., et al. (2011). I principi e le applicazioni al Sistema Integrato Gestione Rifiuti. Industrial ecology: i principi, le applicazioni al supporto della Green Economy. Rimini: Maggioli Editore.
10. Ellen MacArthur Foundation. (2015). Circular Economy overview. Available online at: https://www.ellenmacarthurfoundation.org/circular-economy (Accessed on March 2017).
11. European Commission. Comunicazione della commissione al parlamento europeo, al consiglio, al comitato economico e sociale europeo e al comitato delle regioni. Verso un’economia circolare: programma per un’Europa a zero rifiuti. Bruxelles, 25/09/2014.
12. European Commission. (2011). Communication from the commission to the European parliament, the council, the European economic and social committee and the committee of the regions. Roadmap to a Resource Efficient Europe. Bruxelles: European Commission.
11
13. European Commission. (2015). Proposal for a directive of the European Parliament and of the Council amending Directive 2008/98/EC on waste – COM(2015) 595 final. Bruxelles: European Commission.
14. Direttiva 2008/98/CE del Parlamento Europeo e del Consiglio del 19/11/2008, “Direttiva quadro sui rifiuti”, Gazzetta ufficiale Unione Europea, 2008.
15. European Commission. (2014). General Union Environmental Action Program to 2020: “Living well, within the limits of our planet”. Luxemburg: Publications Office of the European Union.
12 2. Methodology
2.1 LCA Methodology
Life Cycle Assessment (LCA) is a tool that allows the assessment, in view of a minimization, of the potential environmental impacts associated with production and use of a product, system or an industrial process.
For this purpose energy and material flows are identified and quantified in input and output.
An LCA study may consider the entire life of a product (“from cradle to grave” approach), i.e. from the extraction and acquisition of raw materials, through the production and processing, the use and the end of life and disposal or recovery.
2.2 History of the LCA
The LCA methodology now ranks in the broader context of Sustainable Development and Industrial Ecology.
The basic idea, which is the consideration of environmental issue related to a product, dates back to the late ‘60s, thanks to the initiative of some researchers who began to deal with the consumption of resources, especially non-renewable ones, and the generation of waste in industrial processes [1].
The only effective and complete way to study production systems from an environmental point of view is to examine the performance by following step by step the path taken by raw materials, from their extraction, through all the processing and transformation processes, up on their return to earth in the form of waste. The philosophy followed can be summarized in the phrase “from cradle to grave”. Before taking the name “Life Cycle Assessment”, other terms were used, such as life cycle analysis, cradle to grave analysis, resource and environmental profile analysis, eco balance, energy and environmental analysis, etc.
This approach was a novelty, as previously there was a tendency to view the individual processes and any improvements made to them, without assessing whether such improvements were actually effective or only apparent when placed in a global view.
13
The first example of Life Cycle Thinking dates back to the early 70s, used as a decision support, especially in big American companies, for example by EPA (U.S. Environmental Protection Agency) and by some British producers of PET bottles.
In the United States such research took the name of REPA, Resource and Environmental Profile Analysis. Among the first companies that used this method there is the Coca Cola Company, which commissioned studies to determine the environmental consequences of the production of different type of beverage containers, in order to identify which material (plastic, glass, steel or aluminum) and which strategy at the end of life of the containers, was energetically most advantageous.
At the end of the crisis in the mid-70s, the knowledge that limited energy resources were consumed at high rate, gave impetus to the study, by experts and researchers, of the issues concerning the exploitation of resources and the resulting effects on the environment.
This led, in the ‘80s, to the statement of the concept of “Sustainable Development”. At the same time in Europe the energy analysis textbook by Boustead and Hancock was released, considered one of the milestones in the history of the LCA methodology. The term was coined during the SETAC (Society of Environmental Toxicology and Chemistry) LCA conference at Smuggler’s Notch (Vermont, USA) in 1990, enclosing within itself all previous approaches to this type of assessment (REPA, EA), defining LCA as:
“the process to identify the environmental burdens associated with a product, process or system by identifying and quantifying energy and materials used and emissions released into the environment, in order to assess their impact and identify opportunities for improvement. The assessment includes the entire life cycle of the product, process or activity, through the extraction and processing of raw materials, product manufacturing, transportation and distribution, use, reuse, storage, recycling, until the disposal”.
At around the same time, International Standard Organization (ISO) drew up the regulations of reference for the methodology, later published in 1996. These standards are part of the 14040 series [2-3]:
- ISO 14040: principles and framework;
- ISO 14041: goal and scope definition and inventory analysis; - ISO 14042: life cycle impact assessment;
14
Later, this series has been updated, merged and then replaced by only two standards: ISO 14040:2006-Principles and framework, and ISO 14044:2006-Requirements and guidelines, representing the internationally recognized reference for the implementation of a LCA.
2.3 Goal and scope definition
The first phase of an LCA is that in which it is explained the purpose and the aim of the study.
According to ISO 14040, the aim of LCA indicates: - the intended application;
- the reason why is made the study; - the type of audience;
In the scope is defined the functional unit, the system boundaries, the data required to perform the modelling and their reliability, assumptions and limitations.
In general, it is possible to relate the scope of an LCA study to the following purpose: - research and development;
- green marketing;
- supporting environmental management systems; - eco-design.
The goal and scope definition can be constantly reviewed and update, as new information becomes available [4].
2.3.1 System boundaries definition
The system boundaries determine which unit processes should be included in the LCA and must be consistent with the purpose of the study. The criteria used in the selection must be explicitly stated and explained, as well as any omission related to phases of the cycle, processes, inputs and outputs. The boundaries may be initially established on the basis of geographical and technological criteria, and then be refined as the study proceeds, excluding non-relevant components and by including other not previously considered. In any case, the criteria used must be justified in the field of application [3]. Classically, all stages from raw material extraction to disposal or recovery of the product are considered (from cradle to grave approach); however, in some cases, the peculiarity
15
of the study may require a different approach in which it is not possible to consider all stages of the life cycle. For example, for the production of materials that have different possible uses, it is not possible to follow all of their destinies once outside the production chain. For this reason, the purpose of these studies is defined “from cradle to gate”. Other limitations to be taken into account are the temporal boundaries, indicating the period of reference for the study in which the data collection is done. These can refer to the Best Available Techniques or an average operating situation. In an LCA study several exclusion criteria may be used, to decide which information should be included in the assessment, based on:
- mass: when using the mass as a criterion, prompted the inclusion in the study of all inputs and outputs that cumulatively contribute more than a certain defined percentage; - energy: similarly, when using energy as a criterion, all input and output streams should be considered, that cumulatively contribute more than a certain percentage of the total energy produced;
- environmental significance: all flows that contribute to the environmental load more than a certain defined amount have to be included.
2.3.2 Functional unit definition
The functional unit is one of the key element of the study, as it is the quantitative measure of the production of products or services that the system provides. The whole study is based on the functional unit. This is even more important when performing comparative studies: in this case, the considered systems must have the same functional unit. The system boundaries are very important to understand which steps consider in the life cycle.
2.3.3 Allocation criteria
Generally, in most industrial processes, in addition to the main product, also by- or co-products are generated; therefore it is necessary to perform an allocation in order to properly assign the incoming and outgoing flows only to the desired product (i.e. the functional unit taken into consideration). The allocation consists in partitioning to the various by- and co-products the environmental loads and energy, on the basis of a distribution parameter, often physical, such as volume, mass or energy. ISO 14044 shows the following procedure for allocations:
16
- when possible, avoid allocation by breaking the process into separate sub-processes, each with its own output or expanding the boundaries of the system; - if it is impossible to avoid the allocation, the inputs and outputs of the system
should be allocated to the different products according to basic physical relations, such as mass, volume or energy content;
- if it is not possible to use physical relationships, then the allocation might be made on the basis of the economic value of the various co-products.
2.4 Life Cycle Inventory (LCI)
The inventory analysis is the stage dedicated to the inventory of all input and output streams for all stages of the process considered. In this phase the mass and energy flows crossing the process that allow the operation of the production system in question are then explicated, through all the transformation and transport processes.
It is the most “hard-working phase”, as it represents a quantitative and detailed description of the system.
A system is defined as a set of unit operations, connected through flows of mass and energy, which perform a defined function and is separated by the system boundaries from the surrounding environment.
At this level the part concerning the evaluation of environmental impacts associated with the input and output stream of the system is not tackled [1].
The data coming from the inventory are processed to obtain different information divided into categories:
- raw materials; - energy;
- products, co-products and waste; - air, water and soil emissions.
2.4.1 Quality and reliability of data
The assessment of reliability of data collected during the inventory is of crucial importance, since the results will be considered as representative as greater is the accuracy of the input data.
To ensure this, first of all it is necessary to build a detailed flow diagram in which all the operations that make up the system considered are indicated.
17
For the more developed processes it is possible to use literature references to obtain detailed information, but it is still preferable to use primary data from real processes. The quality of the data must be described and evaluated in a systematic way, to allow the reproducibility.
Some parameters should be considered in the quality requirements of the initial data: - temporal coverage, that concerns a representative time when data are collected; - geographic area in which data are collected;
- technology used; - precision;
- completeness; - consistency; - reproducibility;
- sources from which the data are taken;
- uncertainty, that considers which assumptions were made.
It is not always possible to guarantee compliance with all the previous features, especially as it regards the temporal or geographical features.
At this stage it is appropriate to distinguish between foreground and background system. The first indicates the sequence of processes that are needed to get directly the functional unit; the second indicates the materials and energy.
From here it is possible to define (Figure 2.1.):
- foreground data, specific data that are needed to the system description;
- background data, generic data about the materials used, energy, transport and waste management. These data can be found in literature or in some specific database (such as Ecoinvent [5], which is one of the major present in SimaPro database).
18
Figure 2.1. Foreground and background systems [4].
2.5 Life Cycle Impact Assessment (LCIA)
This is the interpretation stage of LCA methodology, which evaluates the importance of the potential environmental impacts identified in the inventory analysis.
Impact assessment method consists of four phases: - classification;
- characterization; - normalization; - weighing.
Of these, two are considered obligatory in every LCA (classification and characterization), while the other two are considered optional (normalization and weighing).
2.5.1 Classification
Classification includes the organization of the inventory data. Once defined the considered impact categories, the results of the inventory must be allocated to the respective categories. To implement this, the problem-oriented strategy is used, in which the impact assessment methods are divided into:
- midpoint oriented: data are converted using intermediate impact categories (e.g.: Climate change or fossil fuels production);
- endpoint oriented: data are converted using final impact categories (i.e.: damage to the ecosystem, human health and consumption of resources).
19 2.5.2 Characterization
After the step of classification of the different impacts caused by the processes, the characterization methods are applied, in order to quantitatively determine (with the appropriate units) the contribution of individual emissions.
At this purpose, equivalent factors are used, called indicators, for different impact categories, which indicate how much a substance contributes to the category when compared to a reference substance. In this way, impact is then represented by numeric values obtained by processing LCI data, after their grouping and classification. To each impact is connected a damage (to human health, to the quality of the ecosystems or to resources depletion) due to the effect that causes it and the relationship is to consider a potential cause. For this reason it is important not to confuse the impact generated with the effect that it can cause.
2.5.3 Normalization
It is the calculation of the magnitude of the results of the category indicators relative to some reference information.
It is useful to understand how much an impact category gives a significant contribution to the overall environmental problem. It is obtained by dividing the indicators of the impact categories to the value of normalization.
Through the normalization it can be concluded that:
- the impact categories that contribute little in comparison with the other categories, may not be considered, thereby reducing the number of issues considered;
- the normalization results show the order of importance of environmental problems generated by the life cycle, compared with the total environmental load.
2.5.4 Weighing
The weighing step is quite complicated, but nevertheless very used.
Weighing sets the life cycle assessment on social, policies or economic bases. There are several solution that can be adopted:
- Use a list to evaluate the impact categories and propose standard weights; - Set a goal for each impact category and use it to obtain a weighting factor; - Express all the data with the same monetary unit (monetization).
20 2.5.5 ReCiPe 2008 method
The ReCiPe 2008 method is one of the methods used in the impact assessment in the LCIA phase and provides results both at midpoint and endpoint level.
About the midpoint approach, the model refers to the CML method (Centrum Milieukunde Leiden), proposed in the Handbook of LCA [7], developed in the Netherlands in 1992.
Instead for the endpoint approach Eco-indicator method is considered [8].
In 2000, as a result of a SETAC conference, a commission has been convened in Brighton, formed by fifty experts of LCA, to study and understand weaknesses and strengths of the midpoint and endpoint methods. It was concluded that it has been useful to develop a model that considers both methods, founding the ReCiPe 2008.
Figure 2.2. Midpoint and endpoint categories in the ReCiPe 2008 model [6]
ReCiPe 2008 includes two groups of impact categories with characterization factors appropriately associated. At midpoint level the methods involves eighteen impact categories, which are (Figure 2.2):
- Climate change; - Ozone layer depletion; - Terrestrial acidification; - Fresh water eutrophication; - Marine eutrophication; - Human toxicity;
21
- Particulate matter formation; - Terrestrial ecotossicity; - Fresh water ecotossicity; - Marine ecotossicity; - Ionizing radiation;
- Agricultural land occupation; - Urban land occupation; - Natural land transformation; - Water resources depletion; - Fossil fuel depletion.
For each of the above categories a characterization factor (indicator) is associated. In Table 2.1 the indicators associated to the individual categories are shown.
Table 2.1. Midpoint categories and their associated indicators [6].
At endpoint level, midpoint categories are grouped into three macro categories of damage:
- Human Health (HH); - Ecosystem Diversity (ED); - Resource Availability (RA).
22 2.5.5.1 Human Health
The damage to human health is assessed through the concept of “disability-adjusted life years”, DALYs, introduced in LCA studies by Hofstetter in 1998 [9].
For each disease, DALY derives from human health statistics, as the sum of years of life lost (YLL) and the years of life lived with a disability (YLD). It gives the same importance for a year of life lost at any age and does not consider any change for future generations.
DALY=YLL+YLD Equation 2.1 YLD=w*D Equation 2.2
Where w is a severity factor between 0 and 1 (0 means completely in health and 1 means death); D is the illness duration.
DALY depends on subjective assumptions:
- it is referred to a specific region in a certain period of time and applying a world average in the calculation of the characterization factors it is assumed that it is acceptable;
- it does not consider age differences and changes for future generations; - it gives a subjective weight to the scale of disease.
2.5.5.2 Ecosystem Diversity
The way to described the quality of ecosystems (biodiversity, ecological function, aesthetic and cultural values and generic information) considers the mass and energy flows. So it can be said that a high-quality of an ecosystem is when the flows take place, while interruptions are due to human activities.
ReCiPe 2008 method provides information on flows at species level and considers that the diversity of living species represents the quality of the ecosystems.
It must be chosen which groups of species can be used to be representatives of the global system quality; moreover it must be chosen to consider the definitive extinction or the reversible disappearance of a species in a particular region in a certain period of time. It can be assumed that the extinction depends on multiple factors and that a single product can’t cause it.
23
For this purpose, the Potential Disappear Fraction of species (PDF), which is the fraction of species disappeared in a certain period in a certain area, is used as a basis for determining the quality of the ecosystem.
Both the loss of terrestrial species and aquatic ones are taken into consideration and all species have the same importance.
The equation for the calculation of the endpoint characterization factor for the damage to the ecosystem (CFED) is given by:
CFED=PDFter*SDter+PDFfw*SDfw+PDFmw*SDmw Equation 2.3
Where SD is the density of the species. The subscripts represent:
- terr: terrestrial systems; - fw: freshwater systems; - mw: marine systems.
It must be estimated approximately the total number of species on Earth, divided into terrestrial, freshwater and marine species. In addition, the terrestrial area (excluding desert, glaciers and agricultural areas), the volume of fresh and salt water should be estimated.
In this way it is possible to calculate the density of the species.
2.5.5.3 Resource Availability
One of the risks feared by scientists in recent decades is the resources depletion. The resources depletion and the demand for others have a big impact on the price market. The ReCiPe 2008 method assesses how the depletion of a resource affects the future availability of the same resource; for this purpose a function has been developed, that estimates the increase of the extraction costs considering a continuous consumption. This fraction is expressed by the MCI factor (in $/kg2), marginal increase in the cost, which is the increase in the cost of a product ($/kg) due to the extraction (kg) of a resource r.
24
The rising cost in $/kg must be multiplied by a factor that express the amount consumed.
2.5.6 The “Cultural Theory”
The ReCiPe method uses the concept of “Cultural Theory”, a theory developed by Thompson [10] that considers the behavior of people with regard to two fundamental dimensions of human life: the attachment to the group and the compliance with the rules of the group. Different combination of the values of the two dimensions considered identify a lifestyle that affects the choices and the values of each person and of the group to which it belongs. Five types of people (archetypes) are so identified, which are (Figure 2.3.):
Figure 2.3. The five archetypes of Cultural Theory [10].
- Individualist. The individualist is a person free from any bond and, for that reason, every vision and decision is temporary and negotiable;
- Egalitarian. The egalitarian is a person who has a strong attachment to the group but not to its laws and this therefore leads him to not accept the division into roles and to question the relationships within the group: this creates conflict;
- Hierarchist. The hierarchist has a strong link with the group and its rules, creates a strong stability, ensuring control over himself and other;
- Fatalist. The fatalist is subjected to the rules of the group but at the same time does not feel himself part of it and therefore tends to act independently;
- Autonomist. The autonomist refuses to belong to the group and to all its impositions.
25
It seems clear that the first three archetypes base their decisions on solid prospects, while the last two acting independently are difficult to predict and are not considered in the model.
2.5.7 Cumulative Energy Demand
The Cumulative Energy Demand (CED) is a characterization method used for the energy assessment. The purpose of this method is to investigate the use of energy throughout the life cycle of a good, service or process. This includes the direct uses or the indirect consumption of energy due to the employment of, for example, materials from construction or raw materials.
This method was developed in the early seventies, after the first oil price crisis [11]. The Cumulative Energy Demand by itself is not an exhaustive method for the environmental load assessment, since it is limited only to energy loads related to various operations involved in a production system. For this reason it is suitable to join it to other assessment methods which includes impact categories relating to other effects with the corresponding characterization factors.
In any case it is considered a good method to implement a preliminary analysis, to identify the most energy-intensive steps in a process or to build a basis to realize an environmental balance.
CED is an assessment system that uses a midpoint approach. It focuses on the use of energy resources, which are divided into eight categories, in the Ecoinvent database, distinguished between renewable and non-renewable (Table 2.2):
subcategory includes
non-renewable resources fossil fossil carbon, lignite, crude, natural gas, peat
nuclear uranium
from forest wood and biomass from forest
Renewable resources biomass wood, food waste, biomass from agriculture
wind wind energy
solar solar energy (to produce thermal energy or electricity) geothermal geothermal energy (shallow,
100-300m)
water hydroelectric energy