This article has been downloaded from IOPscience. Please scroll down to see the full text article.
2012 J. Phys.: Conf. Ser. 357 012034
(http://iopscience.iop.org/1742-6596/357/1/012034)
Download details: IP Address: 151.25.8.45
The article was downloaded on 12/05/2012 at 20:22
Please note that terms and conditions apply.
The THz radiation source at SPARC
E. Chiadroni1, A. Bacci1, M. Bellaveglia1, P. Calvani2, M.
Castellano1, A. Cianchi3, G. Di Pirro1, M. Ferrario1, G. Gatti1, O. Limaj2 , S. Lupi2 , B. Marchetti3 , A. Mostacci4 , D. Nicoletti2 , A. Nucara2, E. Pace1, C. Ronsivalle5, A. R. Rossi1, C. Vaccarezza1
1
INFN-LNF, Via E. Fermi, 40 - 00044 Frascati, Rome, Italy
2
Phys. Dept. and INFN University of Rome “La Sapienza”, Rome, Italy
3
INFN-Roma Tor Vergata & University of Rome ”Tor Vergata”, Rome, Italy
4
SBAI Dept. University of Rome “La Sapienza”, Rome, Italy
5
ENEA C.R. Frascati, Italy
E-mail: [email protected]
Abstract. The linac driven coherent THz radiation source at the SPARC facility is able to deliver broadband THz pulses with femtosecond shaping. In addition, high peak power, narrow-band THz radiation can be also generated, taking advantage from advanced electron beam manipulation techniques, able to generate a train of short electron bunches with THz repetition rate.
1. Introduction
The motivation for developing a linac-based THz source at SPARC stays in the ever growing interest of filling the so-called THz gap with high peak power radiation. From simulations, the peak power expected at SPARC is in the order of 108
W. This result has been confirmed by measurements presented in [1]. The corresponding energy per pulse is of the order of tens of µJ, that is well above standard table top THz sources. Applications of this kind of source concern mainly time domain THz spectroscopy and frequency domain measurements on novel materials [2]. Beyond these applications, coherent THz radiation is also used as longitudinal electron beam diagnostics to reconstruct the beam charge distribution [3].
SPARC is an electron photo-injector deliverying high current, low emittance beams, so called high brightness electron beams (HBEB). SPARC was originally conceived for both electron beam dynamics studies [4, 5] and Free Electron Laser (FEL) experiments at 500 nm in the Self Amplified Spontaneous Emission (SASE) regime [6, 7] and down to shorter wavelengths with novel emission schemes, e.g. cascaded FEL configuration seeded by harmonics generated in gas [8].
Recently, SPARC is extending its prospects to a wider range of high brightness electron beams applications, e.g. Plasma and Laser Wakefields Acceleration (PWFA-LWFA), Thomson scattering and, not least, high peak power THz radiation. The generation of THz radiation and its characterization as radiation source is the main topic of the paper.
at wavelengths equal and longer than the bunch length. The coherent intensity depends on the bunch longitudinal dimension through the longitudinal form factor, defined as the Fourier transform of the bunch longitudinal profile.
2.1. Broad-band THz radiation
High peak power broad band THz radiation is produced by means of ultra-short high brightness electron beams. Few hundreds of femtosecond duration pulses are obtained by longitudinally compress the beam. As alternative to standard magnetic compression, RF compression, named as velocity bunching (VB) [11], is used at SPARC. This technique relies on the fact that the beam is injected in the first accelerating section at the phase of zero crossing field. Since the beam is slightly slower than the phase velocity of the RF wave, it slips back to phases where the field is accelerating and at the same time it is chirped and compressed. The difference between the maximum energy phase and the injection phase is called compression phase. The bunch length at the end of the linac changes by varying the compression phase (Fig.1, black data). Therefore, moving along the RF wave is equivalent to move along the compression curve shown in Fig.1 (red dashed curve). Due to non linearities in the longitudinal phase space (LPS), the
Figure 1. Measurements of bunch length as function of the RF phase (black dots), compared to TSTEP simulation (black dashed line). The red dots are the measured compres-sion factors, compared to TSTEP simulation (red dashed curve).
−10 −0.5 0 0.5 1 200 400 600 800 Length (mm) Current (A) Compression factor 5 Maximum compression
Figure 2. Beam current profile for compression factor 5 (red dashed curve) and maximum compression (black line).
rising edge of the current profile gets steeper and steeper as the compression factor increases. Figure 2 shows the current profile for two compression factors, that is the ratio between the length of maximum energy beam and the length of the compressed one, which depends on the compression phase. From the point of view of THz emission, the sharper the rising edge of the longitudinal profile the higher the THz frequency emission.
2.2. Narrow-band THz radiation
Narrow band THz radiation is produced by means of longitudinally modulated electron beams, i.e. comb beams [12, 13]. If a train of laser pulses with picosecond (ps) inter-distance illuminates the photocathode, assuming instantaneous emission at the cathode, each pulse will produce a disk of electrons at the same ps distance. Due to longitudinal space charge, the bunches lengthen and the original pulse structure is lost in the current profile. Nevertheless, some memory of the original structure is kept in the longitudinal phase space as sawtooth energy profile. In the VB regime, a rotation in the longitudinal phase space is forced, restoring the original current modulation at the end of the linac. The proper pulses length and inter-distance can be adjusted by changing the compression phase.
If a comb train with THz repetition rate is transported down to the transition radiation target, narrow band emission occurs at the frequency corresponding to the pulse distance. For example, in case of four pulses in the train with time separation of 1 ps and time duration of the order of few hundreds of femtoseconds rms, the longitudinal form factor has emission peaks at the fundamental, i.e. 1 THz, and higher harmonics. The number of harmonics and their intensity depend on the modulation of the temporal profile and on the size of each pulse. 2.3. Tunable THz radiation
The emission frequency in the THz range can be tuned by changing the distance between pulses in the train. The pulse distance can be varied by changing the compression phase. Indeed, as shown
Figure 3. Measured Longitudinal Phase Space (LPS) for a four-pulses comb beam at the maximum com-pression phase; the title reports the average energy and the compression phase (200 pC total charge).
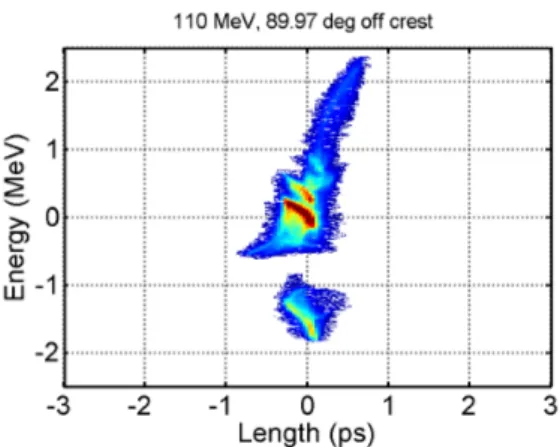
Figure 4. Measured LPS in the deep over-compression regime; the title reports the average energy and the compression phase (200 pC total charge).
in Fig.3, at the maximum compression phase (-97 deg) the four pulses are completely overlapped in time. As far as we move from the maximum compression phase, along the compression curve, the pulses get further and more modulated in time (Fig.4). This region is called deep over compression region.
3. Experimental Setup
A schematic layout of SPARC is shown in Fig.5. SPARC is based on a 1.6 cell S-band RF gun operating at 2.856 GHz (BNL/UCLA/SLAC type) and with high peak field (up to 130 MV/m) on the incorporated copper photo-cathode, generating up to 6 MeV electron beam. The beam
screen. The screen is placed in the vacuum pipe at the end of the by-pass, at 45 with respect to the electron beam direction. TR is extracted at 90o
with respect to the beam axis through a z-cut quartz window and then collected by a 90o
off-axis paraboloid mirror. The parallel beam is then reflected down to a flat mirror at 45o
which reflects radiation horizontally. Figure 6 shows the two schemes foreseen: one for interferometer measurements and one for integrated CTR measurements with the possibility of selecting custom band pass filters in the THz range [16].
Figure 5. Layout of the SPARC accelerator, with the THz source placed at the end of the by-pass line.
Figure 6. Drawing of the experi-mental layout for detection of THz radiation (top view).
A Martin-Puplett interferometer [17] is used for frequency domain measurements. The main advantages with respect to a Michelson one derive from the beam splitter properties. The beam splitter is a wire grid whose reflectivity coefficients depend on wires diameter and spacing. Furthermore, it splits polarizations, thus measuring the intensity of both polarizations, the difference interferogram can be normalized to the sum. Correlated fluctuations due to electron beam instabilities are then canceled. The main limitation is however due to low and high frequencies suppression introduced by the experimental setup.
The alternative branch allows to collect radiation to the 90o
off-axis paraboloid mirror to be focused onto a THz calibrated detector. Band-pass filters can be inserted in front of the detector to select the THz wavelength.
4. Results
Broad band THz radiation source up to 5 THz has been measured at SPARC with a 500 pC, 500 fs electron beam. Details can be found in [1].
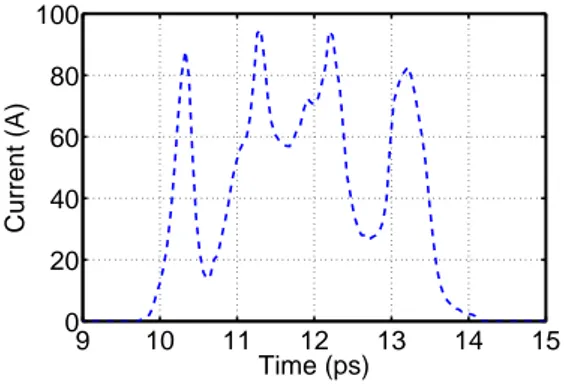
Narrow band THz radiation has been produced and characterized by studying the rotation of the longitudinal phase space of a four-pulses train under VB regime. The relevant regime for THz applications is the the so-called deep over compression regime. In this regime the sub-bunches are well separated and their distance, thus the THz emission frequency, can be tuned changing the compression phase. Interferometer measurements have been performed mainly in this regime. The comb current profile, shown in Fig.7, has been measured at the beginning of
the by-pass line, i.e. after the first bending magnet in Fig.5. The corresponding LPS is shown in Fig.4. The four-pulses comb train has been then transported along the by-pass line down to
9 10 11 12 13 14 15 0 20 40 60 80 100 Time (ps) Current (A)
Figure 7. Comb current profile as measured at the beginning of the by-pass line. Corresponding LPS is depicted in Fig.4. −6 −5 −4 −3 −2 −1 0 1 2 3 4 5 6 −0.2 0 0.2 0.4 0.6 0.8 Time shift (ps) Interferogram
Figure 8. Measured interferogram (blue curve) and expected one from the modulated measured beam shown in Fig.7.
the TR screen. The measured autocorrelation function of the modulated current profile shows clearly five (Fig.8, blue curve) out of the seven peaks expected from a four-pulses comb train (Fig.8, red curve) [18]. In Fig.9 the form factor retrieved from the measured interferogram (blue curve) is compared to the one (red curve) retrieved from the current profile shown in Fig.7. Both the number of peaks in the measured autocorrelation function and the shift of emission frequency, shown in Fig.9, can be explained by considering the effect of the beam transport through the by-pass line. Indeed, under some conditions, it may act as a decompressing section. An increase of the pulse length and pulses separation might occur, causing two sub-pulses to merge into a single one so that the emission will then be driven by a three-pulses comb beam, and the shift of the emission frequency in the sub-THz range.
The measured CTR energy per pulse has then been retrieved (Fig.10, blue curve) taking into account the single particle TR spectrum and the transfer function of the experimental system. A well defined narrow band peak centered around 0.8 THz is visible, as expected from the interferogram peaks distance.
5. Conclusion
SPARC is becoming a test bench for advanced high brightness beam applications, in particular coherent THz generation. Frequency domain measurements in the THz regime are currently in operation at SPARC by means of both custom band-pass mesh filters and Martin-Puplett interferometer. Broad band, up to 5 THz, high peak power THz radiation has been produced and characterized for different beam parameters, e.g. charge and bunch length. Narrow band and tunable THz radiation has been generated combining comb beams and velocity bunching regime to tune the THz emission bandwidth. The multi-peaked autocorrelation function, measured with a Martin-Puplett interferometer, is a clear signature of the longitudinal modulation at THz repetition rate.
Acknowledgments
Authors wish to acknowledge F. Anelli, L. Cacciotti, S. Fioravanti and R. Sorchetti for their technical support.
0 0.5 1 1.5 2 0 0.2 0.4 Frequency (THz) Form Factor
Figure 9. Form factor retrieved from current profile measured at the beginning of the dogleg (red curve), in comparison with the one retrieved by measuring the autocorrelation function of the CTR produced by the four-pulses comb beam.
0 0.5 1 1.5 2
0
Frequency (THz)
CTR energy (
Figure 10. CTR energy per pulse from the measured interferogram (blue curve) and as expected (red curve) from the four-pulses comb beam measured at the beginning of the dogleg. Both curves are obtained by taking into account the single particle TR spectrum in far field approximation and for a finite target size. The experimental system transfer function is also considered.
References
[1] E. Chiadroni et al., submitted to Journal of Synchrotron Radiation.
[2] M.S. Sherwin and al., Opportunities in THz Science, Report of a DOE-NSF-NIH Workshop (2004). [3] E. Chiadroni, Bunch Length Characterization at the TTF VUV-FEL, TESLA-FEL 2006-09 (2006). [4] M. Ferrario et al., Phys. Rev. Lett. 99, 234801 (2007).
[5] M. Ferrario et al., Phys. Rev. Lett. 104, 054801 (2010).
[6] L. Giannessi et al., Phys. Rev. ST Accel. Beams 14, 060712 (2011). [7] L. Giannessi et al., Phis. Rev. Lett. 106, 144801 (2011).
[8] M. Labat et al., Phys. Rev. Lett. 107, 224801 (2011). [9] J.S.Nodvick and D.S. Saxon, Phys.Rev. 96, 180 (1954).
[10] A. P. Potylitsyn et al., Diffraction Radiation from Relativistic Particles, Springer Ed. (2010). [11] L. Serafini and M. Ferrario, AIP Conf. Proc. 581, 87 (2001).
[12] M. Ferrario et al., Nucl. Instrum. and Meth. A 637, S43-S46 (2011). [13] Y. Shen et al., Phys. Rev. Lett. 107, 204801 (2011).
[14] D. Alesini et al., Technical Design Report for the SPARC Advanced Photo-Injector, L. Palumbo and J.B. Rosenzweig (Eds.), (2004).
[15] D. Alesini et al., Nucl. Instrum. and Meth. A 568, 488-502 (2006). [16] N. I. Landy, IEEEXplore Digital Library 1-4244-1448-2, 151-156 (2007). [17] D. H. Martin and E. Puplett, Infrared Physics, vol. 10, pp. 105-109 (1970).
[18] E. Chiadroni et al., E. Chiadroni et al., Proceedings of IPAC 2011, THPS101, San Sebastian (2011).