Lithuania
Francesco Calderoni Monica Angelini Alberto Aziani Marco De Simoni Marina Mancuso Martina Rotondi Eleonora Santarelli Ada Vorraro THE FACTBOOK ON THEILLICIT TRADE IN TOBACCO PRODUCTS
directed by: Ernesto U. Savona
Lithuania Francesco Calderoni Monica Angelini Alberto Aziani Marco De Simoni Marina Mancuso Martina Rotondi Eleonora Santarelli Ada Vorraro
Series: The Factbook on the Illicit Trade in Tobacco Products Issue 6
Series editor: Ernesto U. Savona
Transcrime – Joint Research Centre on Transnational Crime
Università Cattolica del Sacro Cuore di Milano – Università degli Studi di Trento Milan office (headquarters): Largo Gemelli, 1 – 20123 Milano (Italy)
Phone: +39 02 7234 3715 / 3716; Fax: +39 02 7234 3721
www.transcrime.it
2014
ISBN 978-88-8443-517-0
Suggested Citation: Calderoni Francesco, Monica Angelini, Alberto Aziani, Marco De Simoni, Marina Mancuso, Martina Rotondi, Eleonora Santarelli and Ada Vorraro. Lithuania. The Factbook on the Illicit Trade in Tobacco Products 6. Trento: Transcrime – Università degli Studi di Trento, 2013
© 2014 Transcrime – Joint Research Centre on Transnational Crime
All rights reserved. No part of this publication may be reproduced, stored in a retrieval system or transmitted in any form or by any means electronic, mechanical, photocopying, recording or otherwise, without the prior written permission of the author.
Credits: KD (cover), Jouzas Šalna (picture p.41), Andriaus Vaitkevičiaus (picture p.47) creative commons license Graphic project: Ilaria Mastro – Transcrime
Transcrime
1
The Factbook on the Illicit Trade in Tobacco
Products
3
Acknowledgements
5
Executive summary
7
Introduction
13
Why focus on the ITTP in Lithuania?
13
What can be found in this report?
14
Chapter 1: the five drivers
16
Society and economy
17
Legal market
23
Regulation
33
Crime environment
41
Enforcement
47
Chapter 2: the four components
56
The demand
57
The supply
61
The products
67
Modus operandi and geographical distribution
73
Chapter 3: framing the components in the drivers
80
Introduction: the four key factors
81
Economic accessibility
81
Availability
83
Profitability
84
Risk
85
Conclusions
87
References
91
TABLE OF CONTENTS
1
The factbook on the illicit trade in tobacco products
LITHUANIA
TRANSCRIME
Transcrime is the Joint Research Centre on Transnational Crime of Università Cattolica del Sacro Cuore of Milan and the University of Trento. The Centre, directed by Ernesto U. Savona, Professor of Criminology at Università Cattolica, represents the multiannual union between experience and innovation in the field of criminological research.
Its offices are located in Milan and Trento. In each office there is a team of researchers and secretariat/ management personnel. Transcrime aims at being a national and international point of reference in the criminological field.
The vision of the Centre is to increase knowledge in the criminological field and in the prevention of crimes, developing innovative ideas and cutting-edge techniques. Transcrime combines its experience in applied research with the consolidated scientific tradition of Università Cattolica del Sacro Cuore in Milan and University of Trento, mixing a practice-oriented approach with a profound understanding of criminal phenomena. Through this experience, it developed a solid network of relationships in the academic field, institutions, international organisations and businesses.
The Centre also plays an important role in the support and development of educational activities at Università Cattolica del Sacro Cuore of Milan. Its principal aim is to achieve close integration between scientific innovation and academic education. In particular, since the academic year 2005/06, Transcrime has managed a MA programme dedicated to crime and security (until academic year 2012/13 the curriculum Crime&Tech: Crime Sciences and Technologies for Security within the MA in Applied Social Sciences; since the 2013/14 academic year curriculum POLISI: Policies for security within the MA in Public Policy). In addition, the Centre has contributed to the development of the International Ph.D. programme in Criminology, coordinated by Professor Savona, which is currently the only doctoral course dedicated to Criminology in Italy.
Transcrime is an independent academic centre. It pursues an autonomous research agenda, which may be developed also through contracts and funding by private and public local, national and international institutions. The source of funding is always made public through Transcrime’s website.
3
The factbook on the illicit trade in tobacco products
LITHUANIA
This report is part of the project The Factbook on the Illicit Trade in Tobacco Products (henceforth ITTP). The project has been developed by Transcrime after the Round Table on Proofing EU Regulation against the Illicit Trade in Tobacco Products hosted by Università Cattolica of Milan, on 5 May 2011. During the Round Table, participants (researchers and policymakers with experience in the field of the illicit trade in tobacco products) agreed on a research agenda concerning the ITTP (Transcrime 2011). Items 3 and 6 of the research agenda focused on the need for better analysis of the tobacco market taking account of its dual nature (i.e. legal and illicit) and on how licit and illicit markets vary across different countries and regions. Given these considerations, Transcrime has developed the Factbook on the ITTP, a multi–annual research plan providing detailed analyses of the ITTP and of its relations with the legal market and other socio–economic and political factors in a number of countries around the world. The aim of the Factbook is to provide an innovative instrument able to shed light on the complex mechanisms behind the ITTP in different countries. This report focuses on Lithuania.
THE FACTBOOK ON
THE ILLICIT TRADE IN
TOBACCO PRODUCTS
Tobacco consumption is undoubtedly a danger for human health, and governments should carefully regulate the tobacco market. Illicit tobacco avoids state regulation and taxation and may jeopardize tobacco control policies. The Factbook will contribute to raising awareness about the global importance of the ITTP and about the strategies available to prevent it. The Factbook has been developed for a wide readership ranging from policymakers, through academics, to interested stakeholders, the intention being to provide a support to develop knowledge-based debates and policies on the ITTP.
The information gathered for this report originates from unofficial sources, academic literature, grey literature, open sources, questionnaires and interviews with experts and stakeholders. Law enforcement authorities’ reports and press releases were also a valuable source of information for the study.
The results of the report do not claim to be exhaustive, nor an accurate reflection of criminal practices. They provide an initial assessment of the ITTP in Lithuania and a starting point for future research.
As a concerned stakeholder in the fight against the illicit trade in tobacco products, Philip Morris International (PMI) welcomed Transcrime’s initiative to develop the Factbook on the ITTP with financial support and the provision of data. However, Transcrime retained full control and stands guarantor for the independence of the research and its results. Information and data for the study have been collected by Transcrime and have not been shared with PMI.
5
The factbook on the illicit trade in tobacco products
LITHUANIA
Especial thanks go to (in alphabetical order) Dr. Skirmantas Bikelis, Head of the Criminal Justice Research Department at the Law Institute of Lithuania, Dr. Vania Ceccato, Royal Institute of Technology, Sweden, Prof. Dr. Aurelijus Gutauskas, Mykolas Romeris University, Dr. Simonas Nikartas, Law Institute of Lithuania, Jevgenijus Pacharevas, Chief analyst of the information analysis division of the Customs Criminal Service, Žilvinas Subačius, Head of the crime investigation department at the Customs Criminal Service of the Republic of Lithuania.
7
The factbook on the illicit trade in tobacco products
LITHUANIA
This report is part of the project The Factbook on the Illicit Trade in Tobacco Products. It focuses on Lithuania, where the illicit trade in tobacco products is an emerging issue, whose importance is due to the high and rising penetration of the illicit tobacco market, to the country’s important role in the illicit traffic of tobacco products, and to the historical and social reasons behind smuggling. Moreover, enforcement authorities are concerned about the problem, and in the past their action has shaped some features of the ITTP.
WHAT CAN BE FOUND IN THIS
REPORT?
This report is organised into three chapters:
•• Chapter one deals with the five drivers of the ITTP: society and economy, legal market, regulation, crime environment and enforcement. The drivers are important areas whose structures may positively or negatively impact on the ITTP. To enable comparison with other country profiles, four key indicators have been selected for each driver. The data for the driver indicators come from comparable sources (latest available years). When possible, the report provides the most up-to-date data from national sources.
•• Chapter two focuses on the four components of the ITTP: demand, products, supply, modus operandi and geographical distribution.
•• Chapter three identifies the key factors of the ITTP in Lithuania and frames the drivers in the components, analysing how different elements of the drivers influence the components of the ITTP.
THE FIVE DRIVERS
•• Society and economy: Lithuania has been strongly affected by the global financial crisis. Indeed, GDP experienced the most severe downturn in the EU and the unemployment rate increased. Nonetheless, the government reacted and the country recovered. GDP rose and the unemployment rate started to fall in 2009. The country still has a high emigration rate and one of the highest levels of income inequality in Europe.
•• Legal Market: Lithuania is an important exporter of tobacco products in the eastern European area. The Lithuanian tobacco market is highly concentrated and relatively small on a global level. In the past decade, national sales have fallen in volume and increased in value. Cigars and hand rolling tobacco (hereinafter HRT) sales have increased in recent years. Smoking prevalence is decreasing due to the reduction in the number of male smokers. Smoking gender inequality is the highest in the EU.
8
Executive Summary
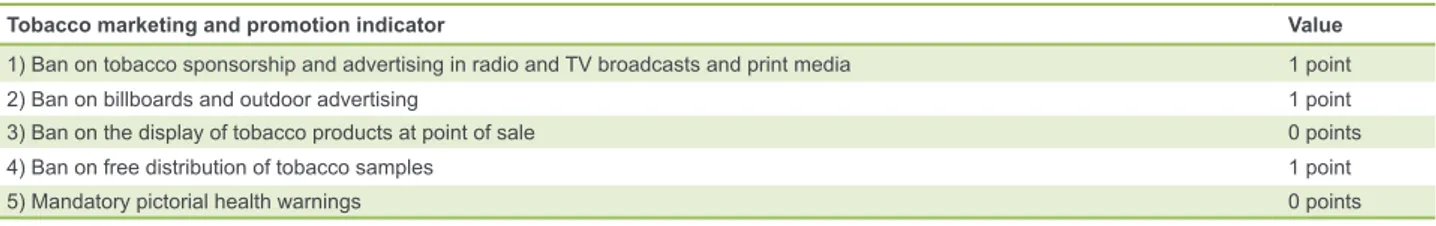
•• Regulation: Lithuania has a non-homogeneous tobacco market regulation. The taxation on tobacco products is high, both as tax incidence on the final retail price and as total tax per 1,000 sticks. There is a medium-high level of control on the supply chain and a high level of control on tobacco consumption and sales. By contrast, the regulation of tobacco marketing and promotion is medium. European and international institutions are working to reduce the gap between the Lithuanian and European levels of regulation.
•• Crime Environment: Lithuania has high, but declining, crime levels. In recent years, Lithuanian citizens have felt safer. Drug consumption is high for cannabis and medium-low for cocaine and opioids. The country shows a medium presence of organised crime activities and shadow economy. Corruption is still a major issue in Lithuania.
•• Enforcement: Lithuanian anti-ITTP actions are medium, owing to the absence of a national action plan and of yearly publicly-available estimates of the illicit trade. Nevertheless, in 2011 the government launched a nationwide public awareness campaign. Many police and customs agencies are involved in the fight against the ITTP and also cooperate with European law-enforcement agencies.
THE FOUR COMPONENTS OF THE ITTP
•• The demand: between 35% and 50% of smokers reported buying smuggled cigarettes according to two different surveys. Hence, the demand for illicit cigarettes is high. The main reasons for buying illicit products in Lithuania are increasing goods prices, decreasing incomes, and large price differences with neighbouring countries, as well as the widespread acceptance and tolerance of contraband. Moreover, it is easy to buy illicit tobacco in Lithuania because it is sold in open-air bazaars.
•• The supply: Lithuania is a destination, transit, and source country for the ITTP. Organised groups and private individuals are involved in the supply of illicit tobacco. Proximity to the main producing countries of illicit whites, and price differentials on excise goods between the two sides of the EU borders, foster the ITTP.
•• The products: Lithuanian institutions do not provide updated estimates of the illicit tobacco market. Nevertheless, several institutions reveal that the illicit market in Lithuania was between 41.2% and 32.4% of the total cigarettes market in 2012. Illicit whites are the most widespread product, and they are smuggled from Belarus and Kaliningrad. The number of contraband cigarettes has decreased in recent years.
•• Modus Operandi and Geographical Distribution:
illicit tobacco is smuggled via rivers and highways. The two main macro inflows stem from Kaliningrad Oblast and Belarus. Finally, the high non-domestic prevalence of empty packs is correlated with proximity to borders and important transport junctures.
FRAMING THE COMPONENTS IN THE
DRIVERS: THE FOUR KEY FACTORS OF
THE ITTP
The report identifies four key factors behind the ITTP in Lithuania. These key factors are the crucial elements through which the five drivers determine the features of the four components. This chapter analyses how the interaction between the drivers and the components impact or may impact on the ITTP through these four key factors (Figure 1, p.9).
•• Economic accessibility: the price of illicit tobacco, and particularly its relative price compared to the price of legal products.
• The financial crisis has increased unemployment. A recent survey indicates that 46% of Lithuanians consider rising product prices, low and decreasing income, and reduced possibilities to afford legal goods as the key reasons for the increase in smuggling (Lithuanian Free Market Institute 2013, 6). • Since 2008, Lithuania has increased tobacco taxes
to 75% of the final retail price of cigarettes. Indeed consumers may save between €0.80 and €1.30 per cigarette pack by purchasing illicit cigarettes. Around 50% of current smokers report buying illicit tobacco because of its economic accessibility (Etaplius.lt 2013).
9
Executive Summary
The factbook on the illicit trade in tobacco products
LITHUANIA
• The majority of Lithuanians trust the quality of contraband cigarettes (Lithuanian Free Market Institute 2013).The more people trust in the quality of illegal goods, the more they are willing to buy them, because they are convinced that they can buy tobacco products of the same quality but at a lower price.
•• Availability: with which both smugglers and consumers can obtain illicit tobacco products. • The Russian Federation and Ukraine are the main
source countries of illicit tobacco products in Europe (Joossens 2011; 2012). Proximity to these countries increases the availability of illicit products for smugglers and consumers (Joossens 2011; 2012; Customs of the Republic of Lithuania 2013a; GTF 2013).
• Lower-priced cigarettes in neighbouring countries increase the availability of products to be
bootlegged (Gutauskas 2011; Lithuanian Free Market Institute 2012; Euromonitor International 2012c, 11). Lithuania shares borders with Kaliningrad Oblast and Belarus, where the production of illicit whites takes place. This may increase the availability of these products (Shleynov et al. 2008; Hauptzollamt Rosenheim 2012; KPMG 2013).
• The system of customer identification and verification provided by the agreements stipulated by the EU Commission with the major tobacco companies complicates the diversion of products from their legitimate channels. This may contribute to reducing the availability of illicit products (European Commission 2004; 2007; 2010c; 2010b).
Figure 1. Main interactions between the drivers and the ITTP
Source: Transcrime elaboration
Decrease
of the ITTP
Change
of the ITTP
Increase
of the ITTP
unemployment informal economy geographical positionsociety & economy
RU BY no cooperation
enforcement
EU cooperation
legal market
low price neighbours
regulation
taxation customer identification
Decrease of the ITTP Change of the ITTP Increase of the ITTP
crime environment
organised criminal groups tolerance towards smuggling corruption shadow economy
10
Executive Summary
• The distribution of illicit tobacco in Lithuania is based in open-air bazaars and street markets (Euromonitor International 2012c). 41% of smokers declare that smuggled products are easily available. In addition, 4 out of 5 people who smoke illicit cigarettes find it very easy to buy smuggled goods (Balsas 2013b).
•• Profitability: the ability of the ITTP to generate profits that exceed its operational costs.
• Taxes account for a large share of the final retail price of tobacco, making it a highly profitable product to smuggle (Merriman, Yurekli, and Chaloupka 2000). In Lithuania, the amount of total taxes per 1,000 sticks is higher than in its eastern neighbouring countries and has increased since the 2004 EU accession. The same holds for tax incidence (WHO 2012; European Commission 2013a). The higher the taxes, the higher the economic incentives for smuggling.
• Lower retail prices of tobacco products in eastern neighbouring countries, in particular Belarus, boost the profitability of bootlegging and smuggling (Gutauskas 2011; Lithuanian Free Market Institute 2012; Euromonitor International 2012c, 11). • The presence of organised criminal groups and
consolidated smuggling routes may favour the ITTP (Europol 2011b; Gutauskas 2011). Indeed, organised criminal groups may exploit scope economies among different goods and make profits with illicit tobacco smuggling.
•• Risk: the threat of detection/accusation/conviction and the sanctions imposable on the actors involved in the ITTP.
• On the one hand, Lithuanian law enforcement cooperation with European and international institutions improves the effectiveness of anti-ITTP actions and increases the risks for smugglers (Europol 2011a). On the other hand, the absence of specific customs agreements between Lithuanian and border countries, such as Russia or Belarus, creates a lack of law enforcement that may diminish the risk for smugglers (Customs of the Republic of Lithuania 2013d; Customs of the Republic of Lithuania 2013a).
• Law enforcement asymmetries in the fight against the ITTP among various eastern countries may reduce the risk of conviction and facilitate the supply of illicit products (Euromonitor International 2012c, 11; Lithuanian Free Market Institute 2013, 4). • The high tolerance of contraband, especially in a
depressed economic environment (Lithuanian Free Market Institute 2013), encourages citizens to disobey the rules. This significantly reduces the risk of arrest and conviction for smugglers (Misiunas and Rimkus 2007).
• Lithuania has a medium-high level of corruption (Transparency International 2012). Corruption reduces the risk for smugglers and increases the supply of illicit products (Ceccato 2013).
• Lithuania has a medium level of shadow economy characterised by widespread smuggling (Schneider, Buehn, and Montenegro 2010; Lithuanian Free Market Institute 2012; Transparency International 2012; Williams e Schneider 2013). This may greatly affect the modus operandi of agents involved in the ITTP by reducing the risk of detection/conviction/ accusation (Ceccato 2013). Indeed, shadow economy ‘hotspots’ such as open-air markets and bazaars allow the easy and less risky distribution of the products (Misiunas and Rimkus 2007; Euromonitor International 2012c).
CONCLUSIONS
There are no official estimates of the prevalence of illicit tobacco in Lithuania, and this makes it difficult to provide a clear picture of the ITTP. Unofficial estimates reckon that the ITTP is increasing and accounts for around a third of the market. Local differences in the consumption of illicit cigarette are correlated with the presence of routes exploited by smugglers. Indeed, according to EPSs, towns at important junctures with neighbouring countries exhibit the greatest non-domestic penetration. Illicit whites and genuine smuggled cigarettes are the most widespread products. Tobacco seizures in 2012 suggest that illicit whites have a
11
Executive Summary
The factbook on the illicit trade in tobacco products
LITHUANIA
In Lithuania, smugglers seem to exploit mainly inland routes and rivers to import illicit tobacco products from neighbouring countries. Investigations indicate that small organised groups and single individuals are particularly active in the ITTP.
The present study demonstrates that more research and accurate data would enable better assessment of the ITTP in Lithuania. Considering the limited number of previous studies and the lack of data, the results of this study are provisional. They enable a preliminary analysis of the ITTP in Lithuania, and they show that more research is needed in this field.
The ITTP is a complex problem, not limited to issues of law enforcement and criminal justice policy alone. According to the available sources, the magnitude of the ITTP in Lithuania exhibits an oscillating trend. Indeed, it varies according to law enforcement actions undertaken in the past. For example, in 2004 many Lithuanian local criminals were arrested for smuggling cigarettes from Lithuania to Western Europe. As a result, Lithuania changed from being a transit country for tobacco smuggling to a final consumption market. Moreover, in 2011, the government launched a national public awareness campaign. However, additional preventive measures, such as a national plan against the ITTP, may be important, because effective action against the ITTP requires comprehensive strategies including criminal law, administrative sanctions, and other indirect measures aimed at reducing crime opportunities.
The evolution of the project showed that countries have very different situations in relation to the available data on the ITTP. In some cases, the quality of the available data is low and there are no official, regularly updated, data. Inevitably, this affects the quality and reliability of the results. In these cases, institutions, businesses and other stakeholders concerned with the ITTP should consider how to improve data collection on illicit tobacco. This will result in improved knowledge about the ITTP and, in turn, in better tobacco control policies, since the impact of specific policy measures upon crime may quite often be overlooked owing to the lack of reliable data.
After completion of the first phase of the project focused on collecting facts and data through the country profiles, Transcrime will conduct comparative analysis among the countries selected. This will yield additional insights into the complexity of the ITTP and allow for the elaboration of policy recommendations.
12
Source: The World Bank
Location:
Lithuania, officially the Republic of Lithuania, is in Northern Europe and is the largest among the Baltic Republics. It borders on Latvia (North), Belarus (Southeast), Kaliningrad Oblast (Southwest) and on Poland (South). The country consists of 10 counties, and its capital and largest city is Vilnius. Lithuania covers an area of 65,300 square kilometres.
Population: 2,985,509 (2012)
Male: 1,376,320 (46.1%)
Female: 1,609,190 (53.9%)
Growth Annual Rate: -1.5% (2012)
Age Structure: (0–14) 15.0%; (15–64) 69.0%; (65+) 16.0%
Fertility Rate: 1.8 children born/woman (2011)
Life expectancy at birth (years): 74.0 (2011)
GDP: US$ 42.25 billion (2012)
GDP growth: 4.0% (2012)
Inflation consumer price: 3.1% (2012)
Income level: High
• • • • • • • • • • • • • • • • • • • • Utena Silute Plunge Kaunas Jonava Alytus Ukmerge Palanga Vilnius Telsiai Taurage Kretinga Klaipeda Siauliai Visaginas Mazeikiai Kedainiai Panevezys Radviliskis Marijampole Birzai Rokiskis LATVIA BELARUS POLAND RUSSIA Baltic Sea • •
13
The factbook on the illicit trade in tobacco products
LITHUANIA
WHY FOCUS ON THE ITTP IN
LITHUANIA?
Historical and geographical reasons, cultural factors, and proximity to illicit cigarettes sources make the study of Lithuania of key importance for an overall comprehension of European ITTP routes. Indeed, the current situation is due to a number of factors.
First, Lithuania has a pivotal role in the ITTP. It lies between Belarus and Kaliningrad Oblast (a federal subject of Russia) and close to Ukraine, three of the main sources of illicit whites and smuggling. EU membership and transport infrastructures (rivers and inland routes) make Lithuania an important gateway for the illicit tobacco trade bound for other EU Member States.
Second, tobacco products are among the most popular smuggled items. Indeed, a large share of smuggling attempts relates to cigarette contraband. Moreover, smuggling has deep historical roots in Lithuania and enjoys a certain social acceptance. Furthermore, shadow economy and corruption are not uncommon.
Third, in Lithuania small organised groups are the main suppliers of illicit tobacco. Indeed, small organised groups benefit from smuggling and tend to concentrate on smuggling schemes. Investigations have identified criminal gangs simultaneously engaged in tobacco smuggling, illegal possession of excise goods, narcotic substances, fraud, property extortion, and other crimes.
Finally, there are no official estimates on the illicit tobacco in Lithuania, and there is an overall lack of studies, especially on the retail level of the ITTP, i.e. where supply meets demand. This entails that the actual dynamics of the illicit market and its structure should be subject to further research.
Given the partial lack of information, this report relies on a large number of sources. The study analyses domestic sources such as Customs releases and reports, since these provide the most specific publicly available information on illicit tobacco. Nevertheless, also the contribution of other Lithuanian law enforcement authorities is important. This report also relies on reports by international organisations, KMPG’s Star project, Euromonitor International data, Empty Pack Surveys commissioned by the tobacco industry and media new stories. Finally, interviews with local experts and stakeholders have provided further detailed information on the ITTP in Lithuania. Nevertheless, unofficial sources will be treated with caution in order to minimise the impact of their possible bias, and this report should be considered a first attempt to improve understanding of the ITTP. Further studies should assess in greater detail the prevalence and extent of illicit tobacco use in Lithuania.
INTRODUCTION
14
Tobacco is a dual market consisting of a legal and an illegal part (Figure 2). The two sides of the market are connected with each other. Actions affecting one side of the market influence the other side as well.
Figure 2. The dual tobacco market
legal market
illegal market
overlap in
demand
The ITTP comprises different activities and products: Smuggling (or contraband): the unlawful movement or transportation of tobacco products from one tax jurisdiction to another without the payment of applicable taxes or in breach of laws prohibiting their import or export (Joossens and Raw 2008).
Counterfeiting: the illegal manufacturing of a product bearing or imitating a trademark without the owner’s consent. Illegally manufactured products can be sold in the source country or smuggled into another country (Joossens and Raw 2008).
Bootlegging: the legal purchase of tobacco products in a low-tax country and the illegal resale of these in a high-tax country. Bootlegging concerns individuals or small groups who smuggle smaller quantities of cigarettes, taking advantage of tax differentials, with the aim of making extra income (Hornsby and Hobbs 2007). Illegal manufacturing: cigarettes manufactured for consumption, which are not declared to the tax authorities. These cigarettes are sold without tax and may be manufactured in approved factories or illegal covert operations (Joossens et al. 2010).
Unbranded tobacco: manufactured, semi-manufactured and even loose leaves of tobacco (Geis 2005), illegally sold by weight, with no labelling or health warnings and consumed in roll-your-own cigarettes or in empty cigarette tubes (Walsh, Paul, and Stojanovski 2006).
Cheap Whites or Illicit Whites: cigarettes produced legally in one country, but normally intended for smuggling into countries where there is no prior legal market for them. Taxes in production countries are normally paid, while they are avoided/evaded in destination countries (Allen 2011).
WHAT CAN BE FOUND IN THIS
REPORT?
This report is organised into three chapters.
Chapter 1 is composed of five subsections analysing the five drivers of the ITTP:
1) society and economy 2) legal market
3) regulation
4) crime environment 5) enforcement
The drivers are important areas whose structures may influence the ITTP positively or negatively. Transcrime selected the drivers based on a review of the literature on the ITTP and discussions with stakeholders and experts. Each subsection provides information on the key aspects of each driver.
To enable comparison with other country profiles, each driver has four indicators. The data for the drivers’ indicators come from different sources and ensure comparability among different countries in regard to the last available years (e.g. World Bank, WHO, UN). When possible, the report provides the most up-to-date data from national sources. For four indicators, Transcrime has developed composite indicators (Regulation and Enforcement). Composite indicators assess the presence of specific policy measures in the country and range from 0 (no measure is present) to 5 (all measures are present). A higher value on the composite indicators does not always imply a better situation. The purpose of such indicators is rather to assess the intensity of policy measures in a specific field. The information used for the assessment is drawn from the literature, official sources (reports, websites, legislation), and experts.
15
The factbook on the illicit trade in tobacco products
LITHUANIA
Chapter 2 analyses the illicit trade in Lithuania, dividing it into the four components of the ITTP:
1) demand 2) supply 3) products
4) modus operandi and geographical distribution. Chapter 3 combines the results of the two previous chapters to identify the four key factors of the ITTP and show how the various elements of the drivers influence the illicit trade.
1) economic accessibility 2) availability
3) profitability 4) risk.
These factors are pivotal for demonstrating how the various elements of each driver influence the illicit trade.
Chapter 1
the five drivers
17
The factbook on the illicit trade in tobacco products
LITHUANIA
SOCIETY AND ECONOMY
L
ithuania was hit hard by the global financial crisis.
GDP recorded the most severe fall in the EU and the
unemployment increased. Nonetheless, the country has
recovered. GDP has increased and the unemployment
rate has decreased.
0.38
71 out of 134 countries
(Last available year)
Income Inequality
GINI coefficient after taxes
Source: The World BankEducation System
Education expenditure
as % of GDP
Source: The World Bank
3.4%
43 out of 151 countries
(2011)
3.9%
107 out of 213 countries
(2010)
Unemployment*
Total unemployment
rate as % of labour force
Source: OECD15.4%
4 out of 35 countries
(2011)
Adult Population
Population aged 15+
Source: The World Bank84.9%
24
out of 225 countries
(2012)
Migration
International migrant stock
as % of population
Source: The World Bank
High % Low % High Low High % Low % High % Low % High % Low % Society and economy
Last available data (April 2013):
13.1%
(Statistics Lithuania 2013c)* The rank is calculated from OECD data. Lithuania figure is provided from The World Bank.
18
83.2 83.8 84.2 84.6 84.9 85.1 85.3 84.9 2005 2006 2007 2008 2009 2010 2011 2012 2004 2008 2.5 2.5 2.7 3.3 0.36 0.38 3.6 3.3 3.4 2005 2006 2007 2008 2009 2010 2011 4.8 3.9 2005 2010 36 36 2006 2009 4,700 5,077 3,889 2,485 2,791 2,702 2007 2008 2009 2010 2011 2012 7,834 9,830 8,913 9,118 9,210 13,661 2007 2008 2009 2010 2011 2012 2.89 4.55 2008 2010 67.6 77.1 97.6 175.4 2008 2010 Tax % final retail price Tax per 1000 sticks/Int.$. PPP6.4 7.7 2008 2010 4.6 4.9 5.0 4.8 54* 58 52 46 50 48 2008 2009 2010 2011 2012 value rank 10.9 8.5 8.2 8.9 7.5 6.6 6.4 2005 2006 2007 2008 2009 2010 2011 345.5 335.8 328.4332.6330.7327.9 327.9 323.1 300.1 2003 2004 2005 2006 2007 2008 2009 2010 2011 19.5 20.3 21.3 21.6 21.9 22.7 22.7 23.3 23.4 2003 2004 2005 2006 2007 2008 2009 2010 2011 8,561.5 6,209.5 7,850.7 2010 2011 2012 0.2 0.2 5.6
opioids cocaine cannabis 11.3 8.3 5.6 4.3 5.8 13.7 17.8 15.4 2004 2005 2006 2007 2008 2009 2010 2011 32.8 32.0 31.7 31.1 30.4 29.7 2002 2003 2004 2005 2006 2007 83.2 83.8 84.2 84.6 84.9 85.1 85.3 84.9 2005 2006 2007 2008 2009 2010 2011 2012 2004 2008 2.5 2.5 2.7 3.3 0.36 0.38 3.6 3.3 3.4 2005 2006 2007 2008 2009 2010 2011 4.8 3.9 2005 2010 36 36 2006 2009 4,700 5,077 3,889 2,485 2,791 2,702 2007 2008 2009 2010 2011 2012 7,834 9,830 8,913 9,118 9,210 13,661 2007 2008 2009 2010 2011 2012 2.89 4.55 2008 2010 67.6 77.1 97.6 175.4 2008 2010 Tax % final retail price Tax per 1000 sticks/Int.$. PPP
6.4 7.7 2008 2010 4.6 4.9 5.0 4.8 54* 58 52 46 50 48 2008 2009 2010 2011 2012 value rank 10.9 8.5 8.2 8.9 7.5 6.6 6.4 2005 2006 2007 2008 2009 2010 2011 345.5 335.8 328.4332.6330.7327.9 327.9 323.1 300.1 2003 2004 2005 2006 2007 2008 2009 2010 2011 19.5 20.321.3 21.6 21.9 22.7 22.7 23.3 23.4 2003 2004 2005 2006 2007 2008 2009 2010 2011 8,561.5 6,209.5 7,850.7 2010 2011 2012 0.2 0.2 5.6
opioids cocaine cannabis 11.3 8.3 5.6 4.3 5.8 13.7 17.8 15.4 2004 2005 2006 2007 2008 2009 2010 2011 32.8 32.0 31.7 31.1 30.4 29.7 2002 2003 2004 2005 2006 2007 83.2 83.8 84.2 84.6 84.9 85.1 85.3 84.9 2005 2006 2007 2008 2009 2010 2011 2012 2004 2008 2.5 2.5 2.7 3.3 0.36 0.38 3.6 3.3 3.4 2005 2006 2007 2008 2009 2010 2011 4.8 3.9 2005 2010 36 36 2006 2009 4,700 5,077 3,889 2,485 2,791 2,702 2007 2008 2009 2010 2011 2012 7,834 9,830 8,913 9,118 9,210 13,661 2007 2008 2009 2010 2011 2012 2.89 4.55 2008 2010 67.6 77.1 97.6 175.4 2008 2010 Tax % final retail price Tax per 1000 sticks/Int.$. PPP
6.4 7.7 2008 2010 4.6 4.9 5.0 4.8 54* 58 52 46 50 48 2008 2009 2010 2011 2012 value rank 10.9 8.5 8.2 8.9 7.5 6.6 6.4 2005 2006 2007 2008 2009 2010 2011 345.5 335.8 328.4332.6330.7327.9 327.9 323.1 300.1 2003 2004 2005 2006 2007 2008 2009 2010 2011 19.5 20.3 21.3 21.6 21.9 22.7 22.7 23.3 23.4 2003 2004 2005 2006 2007 2008 2009 2010 2011 8,561.5 6,209.5 7,850.7 2010 2011 2012 0.2 0.2 5.6
opioids cocaine cannabis 11.3 8.3 5.6 4.3 5.8 13.7 17.8 15.4 2004 2005 2006 2007 2008 2009 2010 2011 32.8 32.0 31.7 31.1 30.4 29.7 2002 2003 2004 2005 2006 2007
19
Chapter 1: The Five Drivers
The factbook on the illicit trade in tobacco products
LITHUANIA
•• Lithuania is a developed country which has undergone important evolution in the past decade. • The Lithuanian HDI was 0.818 in 2012 and the
country ranked 46th out of 186 countries in 2012 (UNDP 2013).
• The country joined the European Union and the NATO in 2004. In December 2007, Lithuania also joined the Schengen Area. As a EU Member State and as a member of the Economic and Monetary Union, Lithuania should adopt the Euro (€). However, high inflation, both in 2004 and in 2008, has delayed the adoption of this currency, and the country is still using the Litas (Lt). In February 2013, the government approved a plan to adopt the Euro in 2015. Processes such as adapting the national law, raising public awareness, making cash changeover, and harmonising monetary policy will be carried out gradually (Tiron and Seputyte 2012; Bank of Lithuania 2013; 15min.lt 2013).
•• Lithuania was hit hard by the global financial crisis. Indeed, it experienced the most severe fall of GDP in the EU (-13.9% in the first quarter of 2009) (Woolfson 2010; Statistics Lithuania 2013c). • The Lithuanian economy grew in the period before
the global financial crisis. Growth was driven by the increase in domestic demand. The GDP growth rate was 8.9% in 2007 and 7.8% in 2006; one of the highest levels in the European Union (Bertelsmann Stiftung 2012). Overall, between 2001 and 2008, GDP grew by 138%, but fell by 18% between 2008 and 2009 owing to the financial crisis (Figure 3) (Statistics Lithuania 2013c).
• Before the global financial crisis, the economy was strongly dependent on exports. Moreover, a constant budget deficit increased the country’s debt. Government deficit rose from 3.3% to 9.5% of GDP between 2008 and 2009. Owing to the crisis, increased interest rates stopped the flows from abroad and undermined economic growth. Indeed, higher interest rates made consumption in foreign countries decrease, restricting opportunities to export (Račickas and Vasiliauskaitė 2010; Davulis 2012).
• At the end of 2008, the government decided to increase the rate of value added tax to 19% (later 21%), income-tax, and excise duty on fuel, cigarettes and alcohol as well as to eliminate the majority of reduced tariffs of the value added tax (Davulis 2012). • Since 2010 the Lithuanian economy has recovered.
The country has substantially rebalanced its economy and reduced the vulnerabilities. GDP has returned to pre-crisis levels (Figure 3) (IMF 2013).
Figure 3. GDP in bn Lt and inflation rate, 2005-2012
Source: Transcrime elaboration on Statistics Lithuania (2013c) data
GDP (bn Lt) Inf lat ion rat e
2005 2006 2007 2008 2009 2010 2011 2012 120 110 100 90 80 70 60 50 40 30 20 10 0 12 11 10 9 8 7 6 5 4 3 2 1 0 inflation rate (%) bn (litras)
• The inflation rate increased between 2005 and 2008 (from around 3% to more than 8%). Subsequently, inflation decreased, falling to about 1.0% in 2009 (Figure 3). After this low record, inflation started to increase again and reached 1.4% in May 2013, following the re-start of the economy (Statistics Lithuania 2013a).
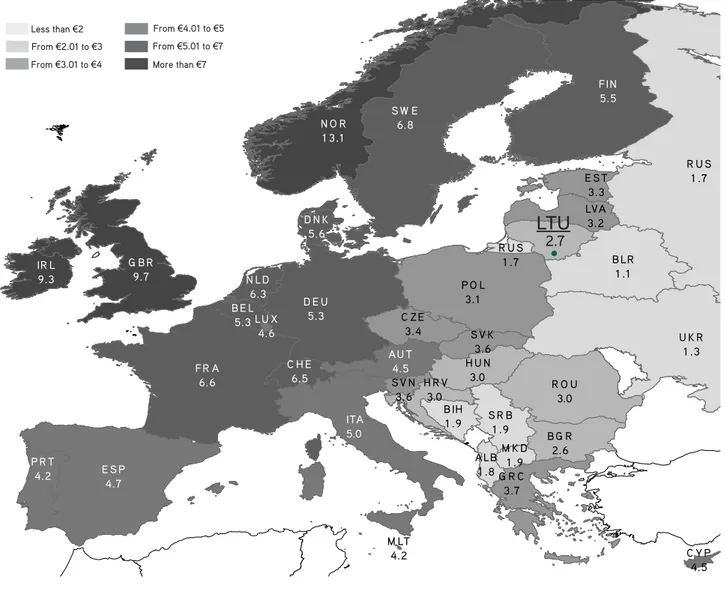
• Estimates show that Lithuania’s public debt was 38.5% of GDP in 2012 and the country ranked 96th out of 153 countries. Greece (161.3% of GDP), Italy (126.1%) and Portugal (119.7%) have the highest public debts in Europe, and Estonia the lowest (8.0%) (CIA 2012a).
20
•• The global financial crisis also affected unemployment and the average net wage (Statistics Lithuania 2013c).
• Lithuania has a high unemployment rate. It reached 15.4% in 2011 and Lithuania ranked 4th out of 35 countries (OECD 2012).1 Unemployment decreased to 13.1% in the first quarter of 2013 (Statistics Lithuania 2013c).
• From 2001 to 2008, unemployment in Lithuania decreased by about 67%. Conversely, from June 2008 to June 2009, Lithuania experienced the largest growth of unemployment in the EU, from 5.1% to 15.8% (Woolfson 2010; Statistics Lithuania 2013c). • Male and female unemployment rates started to
diverge in 2008. The largest difference occurred in 2010, when the male rate was 21.2% and the female rate was 14.4% (Figure 4) (Statistics Lithuania 2013c). • Lithuania has a particular level of employment
since it has a high level of elderly (65 and over) and female employed persons compared with the other EU countries. In 2008 the employment rate among women was 61.8% and that among elderly people was 53.1%. Conversely, the EU averages were 59.1% and 45.6% respectively (Lazutka 2010).
Figure 4. Unemployment rate in Lithuania, % of labour force, 2002-2012
Source: Transcrime elaboration on Statistics Lithuania (2013c) data
Household Expendit ure
B n of I nt .$ 0 1 0 2 9 0 0 2 8 0 0 2 7 0 0 2 6 0 0 2 5 0 0 2 4 0 0 2 3 0 0 2 2 0 0 2 1 0 0 2 0 0 0 2 9 9 9 1 15 12 9 6 3
Tot al Males Females
% 2002 2003 2004 2005 2006 2007 2008 2009 2010 2011 2012 25 20 15 10 5 0
Production Import Export Sales
bn s tic ks 2002 2004 2006 2008 2010 2012 25 20 15 10 5 0
Social Protection Education Public health Economy Public debt management Other general government services Public order and the protection Other contributions to the EU budget
Defence Relaxation, Culture and Religion Environment Housing and communal Households
40.1 15.4 12.7 6.8 5.3 4.4 4.43.0 2.92.6 0.5
Lithuania Latvia Estonia
bn c ig ar et te s 2007 2008 2009 2010 2011 2012 14 12 10 8 6 4 2 0 -2 -4
•• The global financial crisis also affected household expenditure (Figure 5).
1. In this ranking, the Lithuanian figure is provided by a different source (The World Bank 2012a).
• Household expenditure grew until 2008. Between 2008 and 2010, it decreased by about 23% (The World Bank 2012a).
Figure 5. Household final consumption expenditure, PPP (constant 2005 International $, 1999-2010
Source: Transcrime elaboration on World Bank (2012a) data
Household Expendit ure
B n of I nt .$ 0 1 0 2 9 0 0 2 8 0 0 2 7 0 0 2 6 0 0 2 5 0 0 2 4 0 0 2 3 0 0 2 2 0 0 2 1 0 0 2 0 0 0 2 9 9 9 1 15 12 9 6 3
Tot al Males Females
% 2002 2003 2004 2005 2006 2007 2008 2009 2010 2011 2012 25 20 15 10 5 0
Production Import Export Sales
bn s tic ks 2002 2004 2006 2008 2010 2012 25 20 15 10 5 0
Social Protection Education Public health Economy Public debt management Other general government services Public order and the protection Other contributions to the EU budget
Defence Relaxation, Culture and Religion Environment Housing and communal Households
40.1 15.4 12.7 6.8 5.3 4.4 4.4 3.0 2.92.6 0.5
Lithuania Latvia Estonia
bn c ig ar et te s 2007 2008 2009 2010 2011 2012 14 12 10 8 6 4 2 0 -2 -4
•• According to a survey, consumption expenditure changed after the 2004 accession to the European Union.
• A household survey (2004-2006) revealed that a very small number of Lithuanian households considered their financial situation to be very good. However, the majority declared that their financial situation was good because they could cover their expenditure without drawing on their savings (Nikitina 2008). • The respondents had a negative attitude towards the
impact of EU enlargement on prices in the country. They underlined that their expenditure on food and house maintenance increased significantly after accession to the EU (Nikitina 2008).
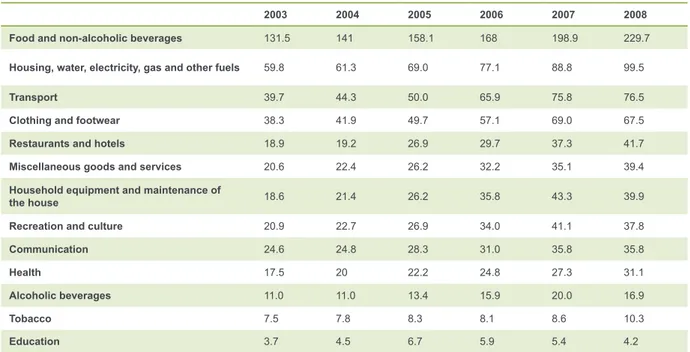
• Consumption expenditure per household member per month increased by 78%, from Lt412.6 (€119.5) in 2003 to Lt734.3 (€212.67) in 2008 (Table 1, p.21) (Statistics Lithuania 2013a).2
2. The ECB reference Lithuanian Litas/Euro exchange rate is used in this report.
21
Chapter 1: The Five Drivers
The factbook on the illicit trade in tobacco products
LITHUANIA
2003 2004 2005 2006 2007 2008
Food and non-alcoholic beverages 131.5 141 158.1 168 198.9 229.7
Housing, water, electricity, gas and other fuels 59.8 61.3 69.0 77.1 88.8 99.5
Transport 39.7 44.3 50.0 65.9 75.8 76.5
Clothing and footwear 38.3 41.9 49.7 57.1 69.0 67.5
Restaurants and hotels 18.9 19.2 26.9 29.7 37.3 41.7
Miscellaneous goods and services 20.6 22.4 26.2 32.2 35.1 39.4
Household equipment and maintenance of
the house 18.6 21.4 26.2 35.8 43.3 39.9
Recreation and culture 20.9 22.7 26.9 34.0 41.1 37.8
Communication 24.6 24.8 28.3 31.0 35.8 35.8
Health 17.5 20 22.2 24.8 27.3 31.1
Alcoholic beverages 11.0 11.0 13.4 15.9 20.0 16.9
Tobacco 7.5 7.8 8.3 8.1 8.6 10.3
Education 3.7 4.5 6.7 5.9 5.4 4.2
• If compared with other 27-EU countries, Lithuania suffered one of the greatest falls in consumption expenditure in 2009 (-16.6%). Particularly,
contractions regarded expenditure on miscellaneous goods and services (-27.7%), transport (-26.0%) and food (-21.6%), while increases concerned communications (47.0%) and education (24.6%) (Gerstberger and Yaneva 2013).
• Tobacco expenditure, as a percentage of monthly consumption expenditure, decreased between 2004 and 2008 (from 1.8% to 1.4% of total expenditure). In absolute terms, as for other types of spending, expenditure on tobacco increased from Lt7.5 (€2.2) in 2004 to Lt10.3 (€3.0) in 2008 (Statistics Lithuania 2013a).
•• Lithuania ranks 6th out of 136 countries for income inequality (CIA 2012b). Moreover, the country ranks 71st out of 134 countries for the GINI index (The World Bank 2012a).
• 20% of Lithuanians are at high risk of poverty. This figure has been stable since 2004 (20.5%). In general, people living in rural areas and aged between 18 and 24 are at a higher risk of poverty (Statistics Lithuania 2013a).
•• Lithuania has a liberal welfare system as provided by the Constitution of 1992.
• In Lithuania, total health expenditure was 6.6% of GDP in 2011. Per capita government expenditure on health was International $953.9 in 2011. This expenditure grew after 2004, the year of the welfare reform. General government expenditure on health was 12.7% of total government expenditure in 2011, stable from 2009 (WHO 2012).
• In 2011, life expectancy at birth was 73.6 years, below the European average (79.0) (The World Bank 2012a).
• Lithuania ranked 43rd out of 151 countries in 2011 for education expenditure (3.4% of GDP). The figure is similar to that for 2010 (3.3% of GDP). The country has a slightly higher level of education expenditure than the world average (3.0%) (The World Bank 2012b).
• 2011 public spending in Lithuania concentrated on social protection (40.1%), education (15.4%), and public health (12.7%) (Figure 6, p.22) (Šimonytė 2011).
Table 1. Average consumption expenditure per household member per month in Lt, 2003-2008
22
Figure 6. Composition of total public spending, 2011
Source: Transcrime elaboration on Šimonytė (2011) data Household Expendit ure
B n of I nt .$ 0 1 0 2 9 0 0 2 8 0 0 2 7 0 0 2 6 0 0 2 5 0 0 2 4 0 0 2 3 0 0 2 2 0 0 2 1 0 0 2 0 0 0 2 9 9 9 1 15 12 9 6 3
Tot al Males Females
% 2002 2003 2004 2005 2006 2007 2008 2009 2010 2011 2012 25 20 15 10 5 0
Production Import Export Sales
bn s tic ks 2002 2004 2006 2008 2010 2012 25 20 15 10 5 0
Social Protection Education Public health Economy Public debt management Other general government services Public order and the protection Other contributions to the EU budget
Defence Relaxation, Culture and Religion Environment Housing and communal Households
40.1 15.4 12.7 6.8 5.3 4.4 4.43.0 2.92.6 0.5
Lithuania Latvia Estonia
bn c ig ar et te s 2007 2008 2009 2010 2011 2012 14 12 10 8 6 4 2 0 -2 -4
•• The emigration rate is high.
• Figures on international net migration show that Lithuania is a country of emigration. Between 1990 and 2011, approximately 670,000 Lithuanians emigrated, while 110,000 returned to the country. In two decades, Lithuania lost half a million people. Lithuania has a population of around 3mn inhabitants (Bolzanė 2012). Emigration peaked in 2010 (77,944) and then decreased (Štreimikienė and Barakauskaitė-Jakubauskienė 2012; Statistics Lithuania 2013a). • As regards migration stock, Lithuania ranked 107th out
of 213 countries in 2010, when the migrant population was 3.6% (The World Bank 2012b).
• Lithuania has one of the largest share of adult population in the world. In 2012, Lithuania ranked 24th out of 225 countries, with 84.9% of its population aged over 15.
• In 2011, 84.2% of the population was Lithuanian, 6.6% Polish, 5.8% Russian, 1.2% Belarusian, 0.5% Ukrainian, and 0.6% of other ethnic groups (Statistics Lithuania 2013b).
Lithuania was hard hit by the global financial crisis. Nonetheless, GDP has recovered to pre-crisis levels, the unemployment rate has started to decrease and inflation to rise. Income inequality is high.
23
The factbook on the illicit trade in tobacco products
LITHUANIA
T
he Lithuanian tobacco market is relatively small
on a global scale, but it is important for its exports
in the Baltic area. National sales have fallen in the
past decade in volume terms and they have increased
in value. Cigars and smoking tobacco sales have
increased in recent years. Smoking prevalence is
decreasing because of the reduction in the number
of male smokers. Since Lithuania has a very low
female smoking prevalence, smoking gender inequality
remains among the highest in the EU.
2.6%
100 out of 168 countries
(2010)
Market Size
Cigarette retail volume
(mn sticks)
Source: Euromonitor International
2,702
92 out of 209 countries
(2012)
13,661
11 out of 72 countries
(2012)
Balance of Trade
Cigarette exports–imports
(mn sticks)
Source: Euromonitor International
Price
Price of a pack of
the most sold brand
(Int.$, PPP)
Source: WHOInt.$, PPP 4.55
40 out of 166 countries
(2010)
Smokers
Current smoking of
any tobacco product
(age–standardised rate)
Source: WHO–Country reports36%
15 out of 147 countries
(2009)
Low High Large Small High Low Positive Negative Legal MarketLast available data (2012):
2.0%
(Euromonitor International 2012, International Monetary Fund 2012)
Last available data (2012):
Int.$, PPP 4.81
(Euromonitor International 2012, International Monetary
Fund 2012)
High %
Low %
Affordability
% of annual per capita
income needed to buy
100 packs of the cheapest
cigarettes
Source: Tobacco Atlas
24
Last available data (2012): Daily smokers
33%
(male),
13%
(female) (Lithuanian statistics department 2013)
83.2 83.8 84.2 84.6 84.9 85.1 85.3 84.9 2005 2006 2007 2008 2009 2010 2011 2012 2004 2008 2.5 2.5 2.7 3.3 0.36 0.38 3.6 3.3 3.4 2005 2006 2007 2008 2009 2010 2011 4.8 3.9 2005 2010 36 36 2006 2009 4,700 5,077 3,889 2,485 2,791 2,702 2007 2008 2009 2010 2011 2012 7,834 9,830 8,913 9,118 9,210 13,661 2007 2008 2009 2010 2011 2012 2.89 4.55 2008 2010 67.6 77.1 97.6 175.4 2008 2010 Tax % final retail price Tax per 1000 sticks/Int.$. PPP
6.4 7.7 2008 2010 4.6 4.9 5.0 4.8 54* 58 52 46 50 48 2008 2009 2010 2011 2012 value rank 10.9 8.5 8.2 8.9 7.5 6.6 6.4 2005 2006 2007 2008 2009 2010 2011 345.5 335.8 328.4332.6330.7327.9 327.9 323.1 300.1 2003 2004 2005 2006 2007 2008 2009 2010 2011 19.5 20.321.3 21.6 21.9 22.7 22.7 23.3 23.4 2003 2004 2005 2006 2007 2008 2009 2010 2011 8,561.5 6,209.5 7,850.7 2010 2011 2012 0.2 0.2 5.6
opioids cocaine cannabis 11.3 8.3 5.6 4.3 5.8 13.7 17.8 15.4 2004 2005 2006 2007 2008 2009 2010 2011 32.8 32.0 31.7 31.1 30.4 29.7 2002 2003 2004 2005 2006 2007 83.2 83.8 84.2 84.6 84.9 85.1 85.3 84.9 2005 2006 2007 2008 2009 2010 2011 2012 2004 2008 2.5 2.5 2.7 3.3 0.36 0.38 3.6 3.3 3.4 2005 2006 2007 2008 2009 2010 2011 4.8 3.9 2005 2010 36 36 2006 2009 4,700 5,077 3,889 2,485 2,791 2,702 2007 2008 2009 2010 2011 2012 7,834 9,830 8,913 9,118 9,210 13,661 2007 2008 2009 2010 2011 2012 2.89 4.55 2008 2010 67.6 77.1 97.6 175.4 2008 2010 Tax % final retail price Tax per 1000 sticks/Int.$. PPP
6.4 7.7 2008 2010 4.6 4.9 5.0 4.8 54* 58 52 46 50 48 2008 2009 2010 2011 2012 value rank 10.9 8.5 8.2 8.9 7.5 6.6 6.4 2005 2006 2007 2008 2009 2010 2011 345.5 335.8 328.4332.6330.7327.9 327.9 323.1 300.1 2003 2004 2005 2006 2007 2008 2009 2010 2011 19.5 20.3 21.3 21.6 21.9 22.7 22.7 23.3 23.4 2003 2004 2005 2006 2007 2008 2009 2010 2011 8,561.5 6,209.5 7,850.7 2010 2011 2012 0.2 0.2 5.6
opioids cocaine cannabis 11.3 8.3 5.6 4.3 5.8 13.7 17.8 15.4 2004 2005 2006 2007 2008 2009 2010 2011 32.8 32.0 31.7 31.1 30.4 29.7 2002 2003 2004 2005 2006 2007 83.2 83.8 84.2 84.6 84.9 85.1 85.3 84.9 2005 2006 2007 2008 2009 2010 2011 2012 2004 2008 2.5 2.5 2.7 3.3 0.36 0.38 3.6 3.3 3.4 2005 2006 2007 2008 2009 2010 2011 4.8 3.9 2005 2010 36 36 2006 2009 4,700 5,077 3,889 2,485 2,791 2,702 2007 2008 2009 2010 2011 2012 7,834 9,830 8,913 9,118 9,210 13,661 2007 2008 2009 2010 2011 2012 2.89 4.55 2008 2010 67.6 77.1 97.6 175.4 2008 2010 Tax % final retail price Tax per 1000 sticks/Int.$. PPP
6.4 7.7 2008 2010 4.6 4.9 5.0 4.8 54* 58 52 46 50 48 2008 2009 2010 2011 2012 value rank 10.9 8.5 8.2 8.9 7.5 6.6 6.4 2005 2006 2007 2008 2009 2010 2011 345.5 335.8 328.4332.6330.7327.9 327.9 323.1 300.1 2003 2004 2005 2006 2007 2008 2009 2010 2011 19.5 20.3 21.3 21.6 21.9 22.7 22.7 23.3 23.4 2003 2004 2005 2006 2007 2008 2009 2010 2011 8,561.5 6,209.5 7,850.7 2010 2011 2012 0.2 0.2 5.6
opioids cocaine cannabis 11.3 8.3 5.6 4.3 5.8 13.7 17.8 15.4 2004 2005 2006 2007 2008 2009 2010 2011 32.8 32.0 31.7 31.1 30.4 29.7 2002 2003 2004 2005 2006 2007 83.2 83.8 84.2 84.6 84.9 85.1 85.3 84.9 2005 2006 2007 2008 2009 2010 2011 2012 2004 2008 2.5 2.5 2.7 3.3 0.36 0.38 3.6 3.3 3.4 2005 2006 2007 2008 2009 2010 2011 4.8 3.9 2005 2010 36 36 2006 2009 4,700 5,077 3,889 2,485 2,791 2,702 2007 2008 2009 2010 2011 2012 7,834 9,830 8,913 9,118 9,210 13,661 2007 2008 2009 2010 2011 2012 2.89 4.55 2008 2010 67.6 77.1 97.6 175.4 2008 2010 Tax % final retail price Tax per 1000 sticks/Int.$. PPP
6.4 7.7 2008 2010 4.6 4.9 5.0 4.8 54* 58 52 46 50 48 2008 2009 2010 2011 2012 value rank 10.9 8.5 8.2 8.9 7.5 6.6 6.4 2005 2006 2007 2008 2009 2010 2011 345.5 335.8 328.4332.6330.7327.9 327.9 323.1 300.1 2003 2004 2005 2006 2007 2008 2009 2010 2011 19.5 20.3 21.3 21.6 21.9 22.7 22.7 23.3 23.4 2003 2004 2005 2006 2007 2008 2009 2010 2011 8,561.5 6,209.5 7,850.7 2010 2011 2012 0.2 0.2 5.6
opioids cocaine cannabis 11.3 8.3 5.6 4.3 5.8 13.7 17.8 15.4 2004 2005 2006 2007 2008 2009 2010 2011 32.8 32.0 31.7 31.1 30.4 29.7 2002 2003 2004 2005 2006 2007
25
Chapter 1: The Five Drivers
The factbook on the illicit trade in tobacco products
LITHUANIA
TOBACCO MARKET
•• Lithuania is the main tobacco-producing country in the Baltic States.
• Tobacco production has increased considerably in the past decade in Lithuania, rising from 3.8 bn cigarettes in 2001 to 22.3 bn in 2012, a 487% increase (Euromonitor International 2013).
• Philip Morris Lietuva UAB owns a large tobacco plant in the western Lithuanian town of Klaipeda, and it is the only manufacturer and exporter of tobacco products in the country. Production of cigarettes almost doubled between 2004 and 2005 as the company upgraded the capacity of the factory (Euromonitor International 2013).
• Lithuania is the main exporter of finished tobacco products in the Baltic region (Figure 7). In 2012, Lithuania exports around 17.64 bn cigarettes, equal to 80% of its national production. The majority of its exports are directed to nearby countries, such as Latvia, Poland and Germany. These markets currently account for over three-quarters of Lithuanian exports (Euromonitor International 2012d; 2013).
• Lithuania is the only Baltic state to have a positive tobacco balance of trade, equal to 13.67 bn sticks. The country ranks 11th out of 72 countries (Euromonitor International 2012d). Nevertheless, it also imports tobacco from other countries. Latvia is the largest exporter to Lithuania, followed by the US and Germany (Euromonitor International 2012d).
•• National sales fell by 40% between 2001 and 2012 (Figure 8).
• The volume of sales has decreased in the past decade (-41%), from 4,583 mn sticks in 2001 to 2,701 mn sticks in 2012 (Euromonitor International 2013). Nevertheless, in 2011 and in 2012 sales stabilised. This may have been due to the economic recovery of Lithuania (Euromonitor International 2012d; Euromonitor International 2013).
Figure 7. Cigarettes balance of trade (exports-imports) in the Baltic states, 2007-2012
Source: Transcrime elaboration on Euromonitor International (2013) data Household Expendit ure
B n of I nt .$ 0 1 0 2 9 0 0 2 8 0 0 2 7 0 0 2 6 0 0 2 5 0 0 2 4 0 0 2 3 0 0 2 2 0 0 2 1 0 0 2 0 0 0 2 9 9 9 1 15 12 9 6 3
Tot al Males Females
% 2002 2003 2004 2005 2006 2007 2008 2009 2010 2011 2012 25 20 15 10 5 0
Production Import Export Sales
bn s tic ks 2002 2004 2006 2008 2010 2012 25 20 15 10 5 0
Social Protection Education Public health Economy Public debt management Other general government services Public order and the protection Other contributions to the EU budget
Defence Relaxation, Culture and Religion Environment Housing and communal Households
40.1 15.4 12.7 6.8 5.3 4.4 4.4 3.0 2.92.6 0.5
Lithuania Latvia Estonia
bn c ig ar et te s 2007 2008 2009 2010 2011 2012 14 12 10 8 6 4 2 0 -2 -4
Figure 8. Cigarette production, exports, imports and sales, 2001-2012
Source: Transcrime elaboration on Euromonitor International (2013) data Household Expendit ure
B n of I nt .$ 0 1 0 2 9 0 0 2 8 0 0 2 7 0 0 2 6 0 0 2 5 0 0 2 4 0 0 2 3 0 0 2 2 0 0 2 1 0 0 2 0 0 0 2 9 9 9 1 15 12 9 6 3
Tot al Males Females
% 2002 2003 2004 2005 2006 2007 2008 2009 2010 2011 2012 25 20 15 10 5 0
Production Import Export Sales
bn s tic ks 2002 2004 2006 2008 2010 2012 25 20 15 10 5 0
Social Protection Education Public health Economy Public debt management Other general government services Public order and the protection Other contributions to the EU budget
Defence Relaxation, Culture and Religion Environment Housing and communal Households
40.1 15.4 12.7 6.8 5.3 4.4 4.43.0 2.92.6 0.5
Lithuania Latvia Estonia
bn c ig ar et te s 2007 2008 2009 2010 2011 2012 14 12 10 8 6 4 2 0 -2 -4
26
•• Tobacco crops are rare in Lithuania. The country instead imports raw tobacco and processes it in tobacco manufacturing facilities.
• Lithuanians cultivated less than 1,000 hectares of tobacco in 2009. Large-scale tobacco production, as in China or Turkey, employs more than 100,000 hectares of land for tobacco cultivation (Eriksen, Mackay, and Ross 2012).
•• The Lithuanian market is relatively small. Its value was €350.5 mn in 2012. Cigarettes are the most popular tobacco product (Figure 9).
Figure 9. Tobacco products volume of sales, 2012
Source: Transcrime elaboration on Euromonitor International (2013) data
Cigaret tes Cigars Smoking tobacco (HRT and pipe tobacco)
96,9% 2,1%
1,0%
Cigars (mn units)
Smoking tobacco (HRT and pipe tobacco in t onnes) 2001 2002 2003 2004 2005 2006 2007 2008 2009 2010 2011 2012 70 60 50 40 30 20 10 0
Male Female Total
% 2000 2002 2004 2006 2008 2010 2012 60 50 40 30 20 10 0 15 -2 4 25 -3 9 4 0 -5 4 55 + 40 30 20 10 0 32% 40% 38% 15%
Less than 15 years old Between 15 and 18 years old
Between 19 and 25 years Older than 25 years oldold
Ref usal and don`t know
9%
4 6% 37%
6% 2%
old
• In 2012, the sales of tobacco products reached a value of €350.5 mn. The size of the Lithuanian market was 2,787.4 mn sticks in the same year. The Lithuanian cigarettes market is average on a global scale (92nd out of 209 countries) (Euromonitor International 2013).
• In 2009, 251 enterprises formed the EU’s tobacco industry. In Lithuania there were three companies employing 193 people (Pantini et al. 2012, 19).
•• Cigarettes constituted almost 97% of the Lithuanian tobacco market in 2012.
• The cigarette market is an oligopoly, and no domestic companies operate within this market. Philip Morris Baltic, JTI Marketing & Sales UAB, British American Tobacco Lietuva UAB are the dominant players. • Philip Morris Baltic is the market leader, with a 64.9%
volume share in 2012. Philip Morris Baltic leads the cigarette market in all three Baltic States (Estonia, Latvia and Lithuania) thanks to its production facility in the town of Klaipeda. This facility enables the company to supply other branches of Philip Morris International, as well as to export tobacco products to foreign countries. The company was the fourth-largest tax contributor in Lithuania in 2011, providing some Lt106 mn (around €30.7 mn). The most popular cigarettes produced by Philip Morris Baltic are L&M, Marlboro and Bond Street, which are the three leading cigarettes brands in Lithuania (Euromonitor International 2012d).
• JTI Marketing & Sales UAB is the second player in the cigarettes market, with a 20.0% share in 2012. In the past, the company concentrated solely on cigarettes. It has recently launched a HRT product in order to intercept the growing demand for hand rolling tobacco. JTI Marketing and Sales has no production facilities in Lithuania and owns Winston, which was the fourth most sold brand in 2012 (Euromonitor International 2012d).
• British American Tobacco Lietuva UAB is the third largest player in the cigarettes market, with a 13.8% market share. The company is particularly strong within the ultra-low tar cigarettes band, where its popular Kent brand accounts for 19% of retail volume sales (Euromonitor International 2012d).
Legal Market
Cigaret tes Cigars Smoking tobacco (HRT and pipe tobacco)
96,9% 2,1%
1,0%
Cigars (mn units)
Smoking tobacco (HRT and pipe tobacco in t onnes)
2001 2002 2003 2004 2005 2006 2007 2008 2009 2010 2011 2012 70 60 50 40 30 20 10 0
Male Female Total
% 2000 2002 2004 2006 2008 2010 2012 60 50 40 30 20 10 0 15 -2 4 25 -3 9 4 0 -5 4 55 + 40 30 20 10 0 32% 40% 38% 15%
Less than 15 years old Between 15 and 18 years old
Between 19 and 25 years Older than 25 years oldold
Ref usal and don`t know
9%
4 6% 37%
6% 2%