demographic knowledge:
general issues and a case-study for Italy
G I A N P I E R O D A L L A Z U A N N A * , F I O R E N Z O R O S S I * , P E T E R M C D O N A L D * *
* Department of Statistical Sciences, University of Padova, Italy
** Melbourne School of Population & Global Health - University of Melbourne, Australia
1. Introduction
One of the main goals of demography is to identify human groups that guarantee optimal descriptions and interpretations of similarities and differences in popula-tion dynamics. For example, to study the differences in mortality, it is ‘natural’ to distinguish between men and women, or between people of different ages, jobs and levels of education. The underlying idea is that the variables sex, age, work and education are relevant in determining different levels of survival or – better – they are directly connected to states of nature or behaviors that are closely linked to the probability of survival.
When individual data are available, the researcher is free to build these human groups of reference by himself, or – if his goal is to measure the connections between the variables – he can also avoid doing it by directly relating the different individual behaviors, using the appropriate statistical techniques. Often – how-ever – the cognitive situation is less favorable, because the data are available only in aggregate form. It is the typical situation for the populations of the past, when we only have data already tabulated, or when the collection of individual data is practically impossible.
When situations of this kind occur, we risk a sort of cognitive drift: the tendency is to give relevance to what one is able to know, putting in second place, both from a theoretical and practical point of view, what is not practically measurable. Often in an unconscious way, we find ourselves in the situation well described by this Witz. Bill, coming home at night, sees Fred crouched under a lamppost, peering at the sidewalk. Bill stops, and asks Fred if something is wrong. Fred replies that he is looking for the house key, which he lost a hundred yards away. Bill asks him why he is looking for the key there, if he lost it from another side. Fred replies that only in this place there is the light of the lamppost…
Starting from these considerations, the first part of this article discusses the limits and the potential linked to the availability of data referring to administra-tive units, one of the most common cogniadministra-tive conditions when we are dealing with
populations of the 19th and 20th centuries. In the second part we will examine a
particular case, namely the description and interpretation of fertility differences between two provinces of the Italian Eastern Alps (Trento and Belluno) in 1951-2011. We will see how – in this case – a constraint (the availability of data only
in aggregate form, at provincial and municipal level) can be transformed into an opportunity to interpret the demographic behaviors actually available.
First part. Administrative boundaries as a ‘golden cage’ for demographic knowledge
2. Four risks
Starting from the end of the 18th century, with the growing role of the State and Public
Administration in the life of common people, the need to have reliable statistics on the state and movement of the population also increased. Consequently, throughout the 19th and 20th centuries, aggregate publication of data referring to states or
sub-state territorial units is multiplying throughout the world. Often these published aggregated data are all that remains in our hands today for the demographic analysis, because individual data have been lost. This is the case – for example – of the Italian post-unitary censuses of 1861-1971, whose questionnaires were destroyed, except for the copies kept in the archives of some municipalities. But the same could be said for the vast majority of demographic sources for all countries with official statistics. Only starting from the end of the 1960s, with the progressive diffusion of the electronic recording of individual records, this constraint comes – at least partially – to fall.
The use of this type of aggregated data is a necessary step to shed light on the demography of the population of the past, and in some cases even those of today. It is therefore important to be aware of the risks and opportunities associated with this investigation. Let’s start with four risks.
If the detection criteria also vary according to the administrative unit, the com-parison between data and indicators can be heavily affected. For example, in a recent
study on perinatal mortality in all the countries of the world for the period 2000-2015, the analysis of the data was necessarily preceded by a complex and patient phase of equalization, due to the different definitions of stillbirths (Blencowe et al. 2016). The authors have adopted as the univocal definition of stillbirths that most accepted internationally, that is the probability of dying before coming to light for
children who had passed the 28th week of gestation. A number of countries,
how-ever, put this threshold at 22 weeks, others adopt a weight threshold (500 or 1,000 grams). Fortunately, since for some countries the stillbirths for more than one of the thresholds just mentioned is available, it was possible to calculate the appropriate equalization coefficients. Without applying this procedure, for countries that set the threshold at 22 weeks of gestation or at 500 grams, stillbirths would have been systematically overestimated, because some conception products otherwise classi-fied as spontaneous abortions would have been classiclassi-fied as stillborn. The example just mentioned refers to contemporary data. In the past, the different definitions and the different methods of detection can be even more diversified, because supranational standardizations – and often even national ones – were non-existent or much less stringent.
A second problem that can affect the validity of comparisons over time and space is the different degree of completeness of the data. Even if the formal rules
for detecting a phenomenon are the same, for many different reasons many events may escape the registration. For example, the times when the dioceses and parishes received the dictates of the Council of Trent (1545-63) and the Ritual of Paul V (1614) were very different. The same happens today for the administrative detec-tion of births and deaths in many developing countries. These under-registradetec-tion differences can make comparisons between even contiguous areas very difficult.
A demographic event may escape detection even due to the inability of the law
governing data collection to adapt to local usages. A good example is what happened
in the decades following the Unity of Italy for marriages and legitimate fertility. With the annexation to the Kingdom of Sardinia, in all Italian regions the civil validity of religious marriage was disregarded. A significant proportion of couples – especially in the Veneto and in the Papal States – did not accept this new regime, and continued to marry only in the church. Therefore, in many Italian provinces after 1861-71 the official data showed an increase in illegitimate fertility. This phe-nomenon continued, although attenuated, until 1929, when with the Concordat between the Italian State and the Catholic Church civil value was given to religious marriage. Consequently, to study the trend of legitimate and illegitimate fertility in the Italian provinces, Massimo Livi Bacci (1977, paragraphs 2.4 and 2.5) was forced to a laborious preventive work of correcting the data, thanks to which it is clear that the decline of legitimate fertility and the parallel increase in illegitimate fertility recorded after the Unification in regions such as Lazio and Veneto are in fact a blindingly statistical one, not corresponding to an effective modification of the fertility behavior of couples.
A final general consideration on the risks linked to analysis based on data referring to administrative units is on the possible inadequacy of the boundaries in
enclosing demographically homogeneous units. Often the boundaries between the
states (but also between the regions, the provinces, the municipalities…) are drawn with criteria that have nothing to do with the homogeneity of the populations that live there. A single state can encompass communities with different demographic habits, or with great health differences or – on the contrary – a border can divide a demographically homogeneous community. Let’s just think about what happened with the dissolution of the USSR. Until 1990 the estimates and forecasts of interna-tional agencies concerned only one state unit, and the differences in territories such as Armenia and Lithuania – ‘drowned’ in the USSR average – were known only to a few insiders. In the last thirty years, on the other hand, the specificities of these new state units are regularly detected and published: in a certain sense, from the point of view of the community of international scholars, before becoming independ-ent states, Armenia and Lithuania ‘didn’t exist’. But no one can say with certainty whether the current subdivision of the former USSR in fifteen sovereign states is able to adequately represent territorial differences in demographic behavior. It is possible that in some cases the subdivision is too small, in others too big – for example considering the immense Russian Federation in a single unit. Certainly, those who find themselves making comparisons between aggregate data must start from this fact, behaving like Fred, when he finds himself looking for his key under the only street lamp.
3. Four opportunities
Thus, knowledge of distinct data and indicators according to administrative units contains the researcher in a cage. However, it can be a golden cage, because there are four important advantages in having tabs according to administrative units.
The first advantage is the progressive homogenization of the data in the various
administrative units, thanks to the application of the same collection, processing
and distribution rules. This process occurs more easily if the administrative units belong to the same state, but can also be generated when international statistical coordination bodies operate.
The second advantage is that the administrative units remain the same for long
periods of time. In this case, the researcher can have long time and territorial series,
which often help to highlight phenomena that would remain unknown in the case of availability of isolated data over time or space.
The third advantage lies in the possibility of systematically comparing
demo-graphic indicators with those of phenomena potentially associated with demography
– detected and published with reference to the same administrative units – using the appropriate statistical techniques. In recent years, the introduction of the multi-level regression technique makes it possible to exploit this possibility even better, because data available at different levels (for example individual and administra-tive unit) can be considered within the same explanatory model (Goldstein 2010). In a recent work Caltabiano and Dalla-Zuanna (2014) have intensively exploited these possibilities, in order to interpret the delay in the decline of births during the demographic transition in Veneto (North-East Italy). Some potentially explana-tory indicators of fertility behavior (such as the ones concerning education and
secularization), for the cohorts born in the 19th century were known only for the
districts (clusters of municipalities remained almost unchanged – for statistical purposes – from 1821 to 1911), thanks to the tabulations of the 1857 Austrian and Italian Censuses of 1881 and 1911; others were known only at the municipal level (such as the vote in the divorce referendum of 1974); finally, we had the individual sample data at 20% of the 1971 census, including some specific questions about the woman’s fertility. Through multi-level regression models it has been possible to exploit all this information in an integrated way by measuring – for example – the influence of secularization and illiteracy on the first phase of the decline in births. Without some indicators available only for districts or municipalities – and without the multilevel regression techniques – this would not have been possible, because in the 1971 census no question was asked about religiosity, while the illiteracy data of the cohorts born during 1880-1910, collected in the 1971 census, are affected by a heavy selection, being the highest mortality for illiterate people.
The last advantage of the availability of data for administrative units lies in the
possibility of connecting demography with the political actions undertaken by the States. In fact – especially starting from the Modern Age – the policies implemented
by the States can influence the different aspects of the demographic dynamics in an increasingly important way. For example, the mortality rate in two neighboring regions of Italy and France over the past two centuries is also influenced by the dif-ferent health and hygiene policies implemented by the two states. This possibility
opens up great problems of analysis: how to enucleate the effect of policies, distin-guishing it from that of other factors. Remaining to our example: how to distinguish between the effect of policies and the effect of the different habits of French and Italians, even though they live in neighboring regions, with regard to the behaviors that they observe on health, such as smoking, drinking alcohol, and regularly going to the doctor?
The next part will be dedicated to an example articulated on the possibility of fully exploiting the availability of data for administrative units in order to measure the effect on the fertility of family and birth support policies, trying to separate them from other factors that may impact on the choice of having or not having a child.
Second part. Comparing counties and municipalities for studying the effect of public policies
4. Low fertility and policies in the Italian regions
In attempting to raise fertility in long-standing low-fertility contexts, public poli-cies should be strong, clear and consistent across time (Gauthier 2002; McDonald 2002, 2006; Thévenon 2011; Rindfuss and Choe 2015). In contrast, during the last forty years in Italy, national fiscal and welfare policies focused on families with children have been weak, confused and inconsistent (Naldini and Saraceno 2008; Gianesini 2014; Tanturri 2015). Moreover, local authorities in Italy (Regions and Municipalities) may implement specific welfare measures adding to national poli-cies. Although these local initiatives may increase the level of uncertainty and con-fusion among couples, in some circumstances the choice of having an (other) child may also be encouraged.
In some Italian areas characterized by autonomia speciale – where more public resources are available, and with relevant administrative and legislative autonomy – family policies have been stronger. The following paragraphs examine the extent to which family-oriented policies in local contexts influence the reproductive behav-ior of couples, in comparison with areas where – although the national cultural and socio-economic milieu could be similar – local family policies are weaker or lacking, adopting a research strategy already followed for other countries (Beaujot and Wang 2010; Beaujot et al. 2013; McDonald and Belange 2016). This kind of analysis may be particularly useful from the political viewpoint in very low fertil-ity contexts where opinions on the efficacy of different policy alternatives are not unanimous (Thévenon 2011).
A previous paper has shown that a specific monetary family policy had an impact on fertility in the Autonomous Region of Friuli-Venezia Giulia (North-East Italy, east border of Veneto) during the years 2000-2003 (Boccuzzo et al. 2008). On 1 January 2000, the regional government introduced a substantial cash bonus at birth, differentiated by birth order. The bonus was higher for the second birth and higher again for third and higher order births. Moreover, the income threshold below which one received the bonus was relatively high. Although the bonus was practi-cally the same irrespective of income level, its relative impact on fertility and
abor-tion behavior was statistically significant only for the fertility and aborabor-tion choices of the lower-income couples. For lower-income women with one or (especially) 2+ children living in Friuli-Venezia Giulia, birth and abortion trends changed after the bonus was introduced whereas the trends did not change for childless women of all income levels and for higher-income women with one or 2+ children living in Friuli-Venezia Giulia or for low-income women living in the other Italian regions. These results show that also in Italy, when the economic load due to an additional child is attenuated by an effective fiscal intervention, fertility may increase.
We do not focus on the impact of a specific family policy, and the just described situation of Friuli-Venezia Giulia may be considered a favorable exception. In fact, it is usually difficult to follow a rigorous statistical path, as most of the time, family-friendly policies are implemented in an articulated way, without it being possible to accurately identify a counterfactual situation, the only one that can allow us to iso-late the effect of a given policy. However – in our opinion – this fact must not lead us to renounce to analyze what happens before, during and after political action, even if we must be aware of the intrinsic limits of the analysis.
Consequently, we try to test if a broad package of family-oriented policies have had an impact on fertility. During the last twenty-five years, a package of family policies has been put in place in the Autonomous Province of Trento (from here on: Trento), characterized by both income approaches and several welfare measures (Provincia Autonoma di Trento 2018). These policies have been strong and persis-tent in time and were clearly communicated to couples in Trento. They are founded on four pillars: monetary contributions that are concentrated on lower-income couples; measures designed to enable the combination of paid employment and childrearing for both parents; incentive measures for companies and public admin-istrations favoring families with children; construction of an accessible territorial network of Family Offices and easily consultable websites to communicate to young couples the possibility of access to the measures available at both the national and the provincial levels. This approach has been implemented over several years under the strict coordination of the Family Department of the Provincial Administration.
In the period, 2004-2017, Trento has been classified by Save the Children (2018) as one of the more parent-oriented areas in Italy. In contrast, the Region of Veneto which borders Trento to the south and does not have the status of
autono-mia speciale and where regional family policies are weak and inconsistent has been
ranked at lower levels than Trento.
Based only on the comparative trends in the fertility rate, the family policies of Trento seem to have influenced fertility behavior. From the second half of the 1980s, the TFR in Trento has been around 0.2 points higher (+15%) than in Veneto, while during 1970-1985 TFR was similar in the two areas (figure 1). The last available value of TFR (2019 – demo.istat.it) was 1.43, ranking Trento in sec-ond position among the 105 Italian provinces, preceded only by the north border-ing province of Bozen with a TFR of 1.69. Bozen is mainly populated by German speaking people and holds a similar form of autonomia speciale and comparable family policies to Trento (Save the Children 2018). By comparison, in the same year, the TFR was 1.32 in Veneto and 1.29 in Italy.
As specified before, it is not easy to determine the specific impact of family policies on fertility in Trento. First of all, the status of autonomia speciale, provides Trento with the possibility of implementing a wider range of policies that could have indirect effects on the fertility choices of couples. These general policies have pulled up development in Trento during the last decades: the per capita GDP for the regions of Veneto and Trentino-Alto Adige (Trento and Bolzano) – Italy = 100 – where 98 and 105 in 1951, 97 and 101 in 1961, 98 and 107 in 1971, 109 and 127 in 1981, 112 and 130 in 1991, 113 and 130 in 2001, 115 and 129 in 2011 (Felice 2017, p. 25). In 2016 the mean individual income is higher in Trento (35,000 euros) than in Veneto (29,500) and in Italy (25,900).
Moreover, it is possible that some of the fertility choices of people living in Trento are affected by cultural, social and economic peculiarities rooted in the past, that have little connection to public policies. To disentangle this hank, we use different research strategies that should minimize the impact of factors influencing fertility other than the family policies.
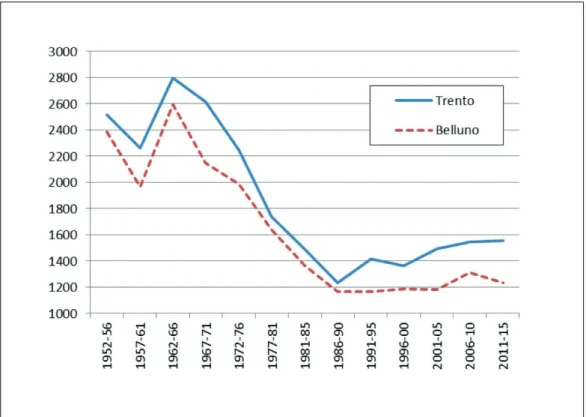
For these reasons, we do not compare the fertility trends and determinants of Trento with Veneto as a whole, but rather with the totally mountainous Venetian province of Belluno (from here on: Belluno) – see figure 2. In § 5 we show com-monalities and differences between the two provinces, mainly focusing on fertility history. In § 6 we describe the different methodologies with which we have com-pared the two provinces, in § 7 we present the results of the comparison and – in the final part – we see if the results obtained can be extended to other low fertility contexts.
Fig. 1. Total Fertility Rate in the Province of Trento and in Veneto. 1970-2017
5. Differences and commonalities of two mountainous Italian counties
While the population of Trento is bigger (at the beginning of 2018: 205 thousand people in Belluno and 538 thousand in Trento), the two provinces share several characteristics. Both the provinces are shaped by long valleys (formed by the Adige, Brenta and Sarca rivers in Trento; the Piave river in Belluno) where the population mainly lives. In both provinces, a couple of medium-size towns lie in the valleys (Rovereto and Trento in the province of Trento; Feltre and Belluno in the province of Belluno), where the majority of the factories are also located. Moreover, a non-negligible segment of the population of both provinces does not live in the main valleys but in villages and small towns 700+ meters above sea level, just under the Dolomites and other imposing mountains, where the economy is largely based on winter and summer tourism. Finally, before 1970, both Trento and Belluno were not rich and little touched by the ‘economic miracle’ that occurred in the northern part of Italy during the 1955-1970 period.
Apart from these commonalities, Belluno and Trento do not share the same history. Trento from the early middle ages has been linked to the German world, although the Italian language largely prevailed. In 1027, the Bishopric of Trento was established as a State of the Holy Roman Empire. For eight centuries, it was an ecclesiastical territory, governed by the Prince-Bishops of Trento. After the Napoleonic Wars of the early 19th century, the bishopric was secularized and
absorbed into the Austrian County of Tyrol, directly governed by Vienna. In 1919, after the First World War, Trento was annexed by the Kingdom of Italy. By contrast, Belluno has been historically connected to Italy. During the late middle ages, Belluno was under the political and economic influence of certain Venetian rich families. From 1404-1420 until 1797, it was part of the Republic of Venice, although maintaining some degree of self-government. After the Congress of Vienna in 1815, it became a subject of the Austrian Empire as a part of the Venetian Province. Belluno remained under Austrian control as part of the Kingdom of Lombardy-Venetia until 1866 when it was ceded to the newly formed Kingdom of Italy (Gullino 2007).
Mirroring these historical differences, the traditional pre-industrial society sur-vived in Trento for a longer time. The proportion of men 15-64 in the primary sec-tor in 1951 was 44% in Trento and 30% in Belluno (Istat, Census 1951, Fascicoli Provinciali, table 7), and the proportion who voted against the divorce reform in
the referendum of 1974 was 60% in Trento and 48% in Belluno. The Ig indices of
marital fertility in 1931, 1936, 1951 and 1961 were 0.500, 0.476, 0.437 and 0.391 in Trento and 0.471, 0.427, 0.352 and 0.321 in Belluno, showing a slower diffusion of birth control in Trento (Livi Bacci 1977).
From 1970 onwards, both Trento and Belluno were strongly influenced by secularization. However, differences remained between the two. For example, the
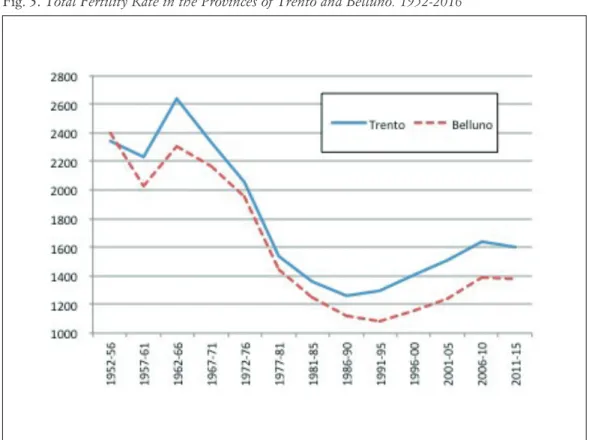
Fig. 3. Total Fertility Rate in the Provinces of Trento and Belluno. 1952-2016
proportion of out-of-wedlock births in 2004-2008 was 20% in Trento and 27% in Belluno. Moreover, in both areas, economic development accelerated after 1970 although the development of Belluno was more fragile, mostly linked to the boom of the eyewear industry, while the development of Trento was more widespread and less exposed to crisis, mixing industry, specialized agriculture and tourism. In Trento – thanks to the autonomia speciale – public resources were more
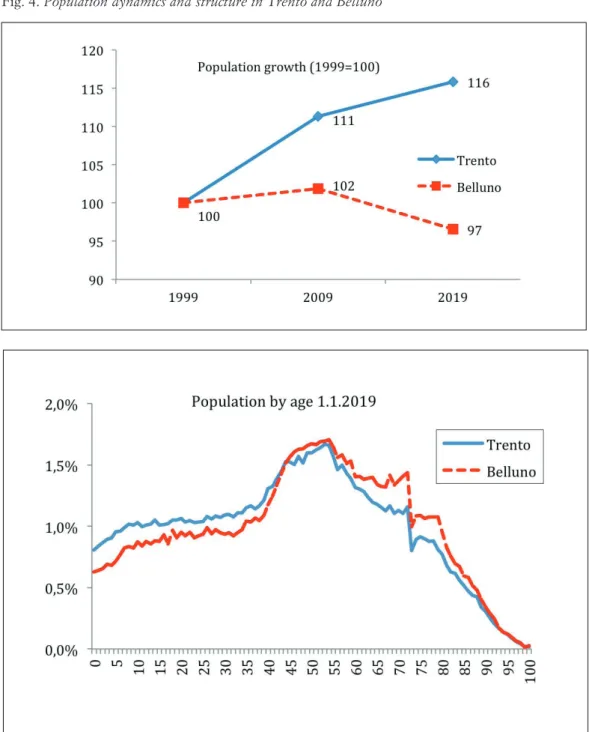
conspicu-Fig. 4. Population dynamics and structure in Trento and Belluno
ously available than in Belluno. Consequently, Trento attracted a higher number of immigrants, mainly from abroad. At the beginning of 2018, the proportion of foreigners was 9% in Trento and 6% in Belluno.
There were significant differences in fertility between the two provinces during the baby boom years (1957-1976) and in the more recent years period (1991-2015), while the differences are small in the intermediate period (1977-1990) – figure 3. The mix between migration and fertility differences produced different trends in population growth and different age structures in the two areas, as figure 4 shows.
6. Methods
6.1. Fertility of foreigners. First, we deal with fertility of foreigners. At the national
level, the fertility of foreigners (non-citizens of Italy) is higher than that of Italian citizens (Mussino and Strozza 2012) and the proportion of foreigners in Belluno is lower than in Trento. Because of this, it is necessary to first consider the contribu-tion of the fertility of foreigners in explaining the fertility difference between the two provinces. For estimating fertility of Italians and foreigners, we use the follow-ing method proposed by Calot (1984; 1985). The TFR can be written as:
TFR = Σfa = Σa(Ba/Wa) = Σa Ba/Σa(Wa∙pa) = B/Σa(Wa∙pa)
where Ba, Wa, fa and pa are respectively births, women, fertility rates and the relative fertility at age a (pa = fa/Σfa), with a = 15, 16, …, 49.
TFR and can be approximated by:
TFR = B/Σa(Wa∙pa) � B/(W20-39/20).
Gérard Calot called Σa(Wa∙pa) «effectif moyen des génération féminines d’âge
fécond» (briefly, mean cohort), that we estimate with (W20-39/20). Once accepted this approximated TFR, we apply the following decomposition for the years 2004-07 (years when fertility differences where wide and foreigner presence intense):
TFR � B/(W20-39/20) = BI/(WI,20-39/20)∙WI,20-39/W20-39 + + BF(WF,20-39/20)∙WF,20-39/W20-39)
TFR � TFRI∙WI,20-39/W20-39 + TFRF∙WF,20-39/W20-39
where the subscripts I: Italians and F: foreigners (source: local population registers, published by Istat – the Italian National Statistics Institute in demo.istat.it).
Castiglioni and Dalla-Zuanna (2009) show that this estimation of TFR, that could seem rough, gives a better idea of fertility of foreign people in Italy during 1990-2010 than the “traditional” formula of TFR = ΣBa/Wa, that overestimates the fertility of foreign women, because of the interdependence between timing of migration and birth.
Once accepted this approximated TFR, the proportion of foreign fertility can be decomposed as follows:
TFRF∙WF,20-39/W20-39/TFR = (TFRF/TFR)∙(WF,20-39/W20-39) = BF/B
6.2. Regression analysis. Second, as stated above, in studying the fertility differences
between Belluno and Trento, we must attempt to distinguish between the differ-ences that are rooted in past history and culture, due to relatively recent social and economic development, and determined by family policies. To do this, we consider the differences of fertility and their possible determinants among the municipalities of the two provinces.
Preliminarily, we estimate fertility for municipalities and provinces during 1957-2017, when female population and birth by age of mother are not always available, and consequently the TFR cannot be calculated using the usual formula TFR = Σ fa. But TFR – as explained before for estimating the fertility of foreigners – can be estimated as:
TFR � B/(W20-39/20).
When infant mortality is low, births can be approximate with P0 (the
popula-tion in the first age), while (W20-39/20) is the mean cohort. So, the fertility of each municipality can be approximate using only population data:
TFR � P0/(W20-39/20) = 20∙P0/W20-39.
If there are errors in the estimate of TFR, they should be similar in the estimates of the two regions, for which the comparison between Trento and Belluno or the respective municipalities remains valid.
Using the regression analysis, we study the determinants of fertility differ-ences between the municipalities of Trento and Belluno during the periods 1950s and 1991-2015. This procedure indicates if: (1) the differences of fertility between the two provinces in the past were due to differences in modernization, measured with indicators of secularization, urbanization and primary educa-tion (Lesthaeghe and Wilson 1986); (2) some of the actual characteristics con-nected to the economic and social development – female secondary education, secularization, the ability of attract immigrants, woman’s condition, income – are connected also to fertility; (3) territorial differences rooted in the past (the past geography of secularization, primary education and fertility) are mirrored in the actual fertility differences; and (4) our explicative indicators explain all the inter-provincial fertility differences.
6.3. Comparing the bordering municipalities. Third, we compare the fertility trends
during the period 1957-2015 in the municipalities bordering Trento and Belluno, excluding the municipality of Feltre (in the province of Belluno), that is the only relatively large city belonging to this set (tab. 1).
The border municipalities should be characterized by stronger economic and social homogeneity than the broader populations in the two provinces. If the homogeneity were exact, the fertility differences on either side of the border
should be caused only by the local differences in policies directly or indirectly con-nected with fertility. Homogeneity is reinforced by the similar topography of the border municipalities that are mountainous. However, the border between Trento and Belluno may mark some differences rooted in their histories that are now mirrored in fertility differences. Moreover, often the border runs between high mountains, that make (or made in the past) trans-border communication difficult. Consequently, the border cannot be considered as exogenous to the phenomena under analysis as has been correctly assumed by others (see, for example, Dehdari and Gehring 2017).
To address this problem, albeit not completely, after comparing fertility of two set of bordering municipalities during 1957-2015, we compare pairings of sets of cross-border municipalities that are economically and socially homogeneous. We compare also the couple of towns in the two provinces: Belluno (35,710) and Feltre (20,608) vs. Trento (117,997) and Rovereto (39,825) – (population size at the beginning of 2018). The methodology for estimating the TFR for each boarder municipality is explained in § 6.2.
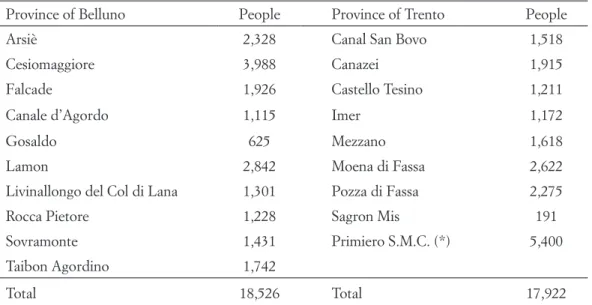
Tab. 1. The municipalities bordering between Trento and Belluno (excluding Feltre) from 1.1.2017
Province of Belluno People Province of Trento People
Arsiè 2,328 Canal San Bovo 1,518
Cesiomaggiore 3,988 Canazei 1,915
Falcade 1,926 Castello Tesino 1,211
Canale d’Agordo 1,115 Imer 1,172
Gosaldo 625 Mezzano 1,618
Lamon 2,842 Moena di Fassa 2,622
Livinallongo del Col di Lana 1,301 Pozza di Fassa 2,275
Rocca Pietore 1,228 Sagron Mis 191
Sovramonte 1,431 Primiero S.M.C. (*) 5,400
Taibon Agordino 1,742
Total 18,526 Total 17,922
(*) Primiero San Martino di Castrozza from 1.1.2017 pooled the municipalities of Fiera di Primiero (471), Siror (1,277), Tonadico (1,527) and Transacqua (2,132) – in brackets population at 1.1.2016. In the regression analysis the original municipalities are considered as four statistical units.
7. Results
7.1. Contribution of foreigners to fertility differences between Trento and Belluno. In
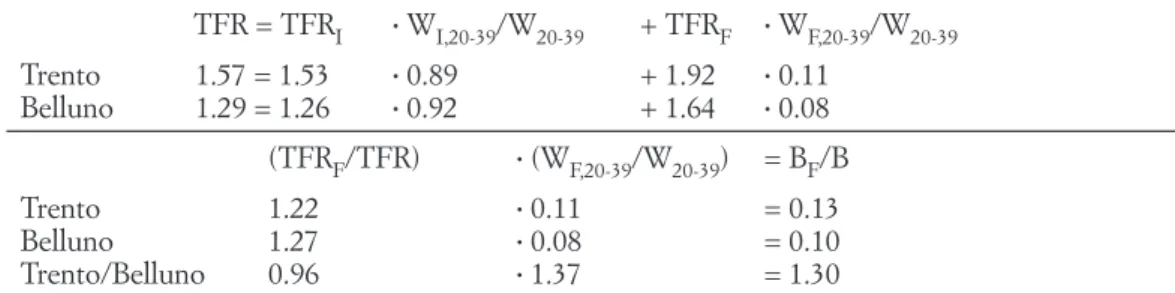
the years 2004-07, fertility was higher in Trento than in Belluno for both Italians (+22%) and foreigners (+17%). In addition, the proportion of foreign women aged 20-39 was higher in Trento (11% vs. 8%) – see table 2. The higher proportion of foreigner births in Trento (13% vs. 10%) is mainly due to the higher proportion of foreign women aged 20-39.
In relation to the aim of this article, the most interesting result of this analysis is that the foreign women who lived in the province of Trento in 2004-07 had 0.28 more children than the foreign women who lived in the province of Belluno (+17%). As the immigrants are not long-standing immigrants, this difference is very unlikely to be due to historical cultural differences between Belluno and Trento. At the same time, it is unlikely that the difference was due to different compositions of foreigners by citizenship, as both in Belluno and in Trento, the three largest nationalities in 2007 were Romanian, Albanian and Moroccon (demo.istat.it).
The cross-border difference between foreigners living in Trento and Belluno could signal a pro-fertility effect of cross-border differences in family policies and/or cross-border differences in the socio-economic climate, at least for the lower classes to which most foreigners belong. A second important result is that the fertility difference between the two provinces in the years, 2004-07, was only marginally due to higher presence of foreigners in Trento.
Tab. 2. The contribute of Italians and foreigners to fertility (Total Fertility Rate – TFR) during
2004-2007 in Belluno and Trento
TFR = TFRI ∙ WI,20-39/W20-39 + TFRF ∙ WF,20-39/W20-39 Trento 1.57 = 1.53 ∙ 0.89 + 1.92 ∙ 0.11 Belluno 1.29 = 1.26 ∙ 0.92 + 1.64 ∙ 0.08 (TFRF/TFR) ∙ (WF,20-39/W20-39) = BF/B Trento 1.22 ∙ 0.11 = 0.13 Belluno 1.27 ∙ 0.08 = 0.10 Trento/Belluno 0.96 ∙ 1.37 = 1.30
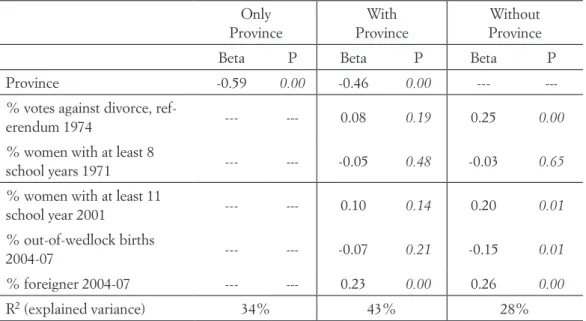
7.2. Regression analysis. Although the fertility differences between Belluno and
Trento were about the same during the 1950s and from 1991 onwards, the dichoto-mous variable Province plays an opposite role in the regression analysis (compare tables 3 and 4). During the 1950s, the statistical explanatory power of Province disappears if indicators of secularization, education and urbanization are included in the model. On the contrary for fertility over the period 1991-2015 when Province is included, only the indicator of foreigners maintains statistical significance in explaining the geographical differences.
Moreover, for fertility over the period 1991-2015, when province is included, the explained variance increases strongly (from 28% to 43%). Province absorbs the statistical explanatory power of the past religion geography and two variables describing the actual differences among municipalities. It means that – contrasting the past – Province has an autonomous explanatory power in shaping the geogra-phy of fertility, apart from some variables included in the model for representing modernization.
Tab. 3. Regression analysis of fertility (TFR) during the 1950s. Municipalities in the provinces of
Belluno (69) and Trento (223)
Only Province With Province Without Province
Beta P Beta P Beta P
Province -0.17 0.00 -0.02 0.78 ---
---% votes against divorce,
referendum 1974 --- --- 0.26 0.00 0.27 0.00
% women with at least
8 school years 1971 --- --- 0.13 0.05 0.14 0.03
Urbanization index 1961 --- --- -0.12 0.08 -0.12 0.07
R2 (explained variance) 3% 10% 10%
Note. The variables are previously standardized (mean=0 and variance=1), for permitting the direct comparison between the beta-coefficients.
Tab. 4. Regression analysis of fertility (TFR) in the period, 1991-2015. Municipalities in the
provin-ces of Belluno (69) and Trento (223)
Only Province With Province Without Province
Beta P Beta P Beta P
Province -0.59 0.00 -0.46 0.00 ---
---% votes against divorce,
ref-erendum 1974 --- --- 0.08 0.19 0.25 0.00
% women with at least 8
school years 1971 --- --- -0.05 0.48 -0.03 0.65
% women with at least 11
school year 2001 --- --- 0.10 0.14 0.20 0.01
% out-of-wedlock births
2004-07 --- --- -0.07 0.21 -0.15 0.01
% foreigner 2004-07 --- --- 0.23 0.00 0.26 0.00
R2 (explained variance) 34% 43% 28%
Note. Two other indicators (per-capita income and % employed women at age 15-64 at 2001) have been tentatively included as explanatory variables. However, their territorial correlation with fertility in 1991-2015 was around zero, and their inclusion in the equation do not influence the values of the other coefficients. Consequently, they were excluded from the final equation. 7.3 The border municipalities. The fertility differences between the two sets of
border municipalities in the provinces of Trento and Belluno are similar to the ones already shown comparing the two provinces as a whole: the gap between the two sets of municipalities was wide during the baby-boom 1957-76, narrow when fertility declined in 1977-90, and wider during 1991-2015 (fig. 5).
Tab. 5. Total Fertility Rate estimations during 1957-2015 in homogeneous sets of municipalities
bordering the provinces of Trento and Belluno
1957-76 1977-90 1991-2015
Ski and trekking/climbing area (*)
Trento 2.38 1.47 1.38 Belluno 2.22 1.41 1.20 Trento / Belluno 1.07 1.05 1.15 Marginal area (**) Trento 2.33 1.48 1.41 Belluno 2.01 1.41 1.14 Trento / Belluno 1.16 1.05 1.23
(*) Ski and trekking/climbing area. Trento: Canazei, Moena di Fassa and Pozza di Fassa; Belluno: Livinallongo, Rocca Pietore, Falcade and Canale d’Agordo.
(**) Marginal area. Trento: Canale San Bovo, Castello Tesino, Imer; Belluno: Sovramonte, Lamon, Arsiè.
Note. Although the populations involved in these comparisons are small (see tab. 2), the results are robust enough, as the number of years for each period is large. The number of births at numerator of TFR is never < 2,000.
Fig. 5. Total Fertility Rate estimates for the 22 municipalities bordering the provinces of Belluno
and Trento, 1957-2015 (*)
Results do not change when the comparison is focused on women in the pair-ings of municipalities that share socio-economic orientation (tab. 5). In both ski/ trekking-climbing areas and marginal areas, the TFR differences between the bor-dering municipalities of Trento and Belluno narrow between 1970 and 1990 and enlarge in the following years.
Finally, in recent years also urban fertility is higher in the province of Trento: during 1991-2016, fertility in Trento/Rovereto is 14% higher than in Belluno/ Feltre. Differences are stronger than in the previous decades.
8. Discussion
Trento maintained some traditional features for a longer period than Belluno, in particular, a greater attachment to religious tradition and an economy more cen-tered on agriculture and livestock breeding. Consistent with the usual readings of the demographic transition, fertility in Trento declined more slowly than in Belluno (Livi Bacci 1977; Lesthaeghe and Wilson 1986). However, during the first half of the 1980s, the differences between the fertility rates of the two provinces had almost disappeared with an average TFR of 1.3 children per woman in both. But after 1990, the cross-border difference enlarged again.
Our results show that this was not due to a return of the pre-1980 influences. Rather, our analyses converge in suggesting that the contemporary differences are due to a more dynamic path of economic development and/or more family-oriented social policies. Unfortunately, with the data at our disposal, it is not possible to distinguish between the effects on fertility of general development policies permit-ted by autonomia speciale or policies explicitly supporting families with children. However, as fertility was higher in Trento than in Belluno also in areas that were very similar from a socio-economic viewpoint, family policies could have had some specific effect.
These results give two indications for implementing measures that can boost fertility in Italy. First, the study has shown that, in an Italian context, a combination of economic development and measures aimed at reconciliation between work and family can convince some couples to have an additional child. Very low fertility is not an ineluctable destiny but it can be turned around even in countries where it has persisted for decades. However, even in Trento, fertility remains low, having never exceeded – even in the most favorable years – 1.6 children per woman. This may be because the family policy measures that have been implemented have been modest, so that families with children are not fiscally favored to a degree compa-rable to the situation in other European countries where the fertility rate is higher. Fertility is not only a matter of money, but money may be important, mainly for the choice of the having the second, the third of the following children.
So, although the road taken by Trento is the right one, the economic develop-ment and reconciliation measures taken in Trento have not been sufficient to raise fertility to the levels seen in France or the European Nordic countries. Without a tax-transfer reform that is more strongly favorable to couples with children, it is difficult to imagine that Italy can abandon very low fertility.
according to administrative boundaries, the latter can be used to highlight the pos-sible effects of the policies themselves on demographic behavior, keeping under control the economic and cultural differences.
The medium-long term data on demography and the socio-economic context for the different administrative units – even if they do not allow to measure accu-rately the causal links between policies and demographic behavior – can be useful to have an idea on the existence of a net effect of the policies themselves. This happens because the administrative areas where individual policies have not been implemented can assume, at least in the first instance, the role of counterfactual situation.
Only experimental or quasi-experimental impact assessment studies allow the effect of a policy on demographic behavior to be rigorously measured (Boccuzzo et
al. 2008). Unfortunately, however, such studies are often not possible, due to the
unavailability of the necessary data or because we are not able to distinguish the effect of individual measures on demographic behaviors. The risk of looking for a non-existent key under the single lamp is always in order, you risk taking fireflies for lanterns. However, measuring the impact of public policies on demographic behavior is so important that it can be worth the effort to accept moving in a sub-optimal cognitive context, making the most of the data actually available.
References
R. Beaujot, J. Wang 2010, Low fertility in Canada: the Nordic model in Quebec and the U.S. model
in Alberta, «Canadian Studies in Population», 37, 3-4, 411-43.
R. Beaujot, D. Ching, Z. Ravanera 2013, Family policies in Quebec and the rest of Canada:
implica-tions for fertility, child care, women’s paid work and child development indicators, «Canadian Public
Policy», 39, 2, 221-239.
H. Blencowe et al. 2016, National, regional, and worldwide estimates of stillbirth rates in 2015, with
trends from 2000: a systematic analysis, «The Lancet – Global Health», 4, 2, 98-108.
G. Boccuzzo, G. Dalla-Zuanna, M. Caltabiano, M. Loghi 2008, The impact of the bonus at birth
on reproductive behavior in a lowest-low fertility context: Friuli-Venezia Giulia (Italy) from 1989 to 2005, «Vienna Yearbook of Population Research», Vienna Institute of Demography (VID) of the
Austrian Academy of Sciences in Vienna, 6, 1, 125-147.
G. Calot 1984, Une notion intéressante: l’effectif moyen des générations soumises au risque. I.
Présentation, «Population», 39, 6, 947-976.
G. Calot 1985, Une notion intéressante: l’effectif moyen des générations soumises au risque. II.
Quelques exemples d’application, «Population», 40, 1, 103-130.
M. Caltabiano, G. Dalla Zuanna 2014, The Delayed Fertility Transition in North-East Italy, «European Journal of Population», 31, 21-49.
M. Castiglioni, G. Dalla-Zuanna 2009, Marital and reproductive behavior in Italy after 1995:
Bridging the gap with Western Europe?, «European Journal of Population», 25, 1, 1-26.
D. Dehdari, K. Gehring 2017, The origins of common identity: Division, homogenization policies
and identity formation in Alsace-Lorraine, CESifo Working Paper.
E. Felice (2017) The roots of a dual equilibrium: GDP, productivity and structural change in the
Italian regions in the long-run (1871-2011), «Economic History Working Papers», 40, Banca
d’Italia.
A. Gauthier 2002, Family policies in industrialized countries: is there convergence?, «Population» 57, 3, 447-474.
G. Gianesini 2014, Family patterns of change in Italy: challenges, conflicts, policies, and practices, in M. Robila (ed.) Handbook of family policies across the globe, 155-174, Springer-Science.
H. Goldstein 2010, Multilevel Statistical Models, John Wiley & Sons, London. G. Gullino 2007, Atlante della Repubblica Veneta 1790, Cierre Edizioni, Verona.
R. Lesthaeghe, C. Wilson 1986, Modes of Production, Secularization, and the Pace of the Fertility
Decline in Western Europe, 1870-1930 in A.J. Coale, S.C. Watkins, The Decline of Fertility in Europe, Princeton University Press, Princeton, USA, 261-292.
M. Livi Bacci 1977, A History of Italian Fertility During the Last Two Centuries, Princeton University Press, Princeton, USA.
M. Mazziotta, A. Pareto 2016, On a generalized con compensatory composite index for measuring
socio-economic phenomena”, «Social Indicators Research», 127, 3, 983-1003.
P. McDonald 2002, Sustaining fertility through public policy: the range of options, «Population» (English edition), 57, 3, 417-446.
P. McDonald 2006, Low fertility and the state: the efficacy of policy, «Population and Development Review», 32, 3, 485-510.
P. McDonald, A. Belange 2016, A comparison of fertility in Canada and Australia, 1926–2011, «Canadian Studies in Population», 43, 1-2, 5-22.
E. Mussino, S. Strozza 2012, The fertility of immigrants after arrival: the Italian case, «Demographic Research», 26, 4, 99-130.
M. Naldini, C. Saraceno 2008, Social and family policies in Italy: not totally frozen but far from
structural reforms, «Social Policy Administration», 42, 7, 733-748.
Provincia Autonoma di Trento 2018, Distretti famiglia: relazione annuale 2017. Rapporto sullo
stato di attuazione de sistema integrato delle politiche familiari per l’anno 2017 (on-line).
R. R. Rindfuss, M. K. Choe 2015, Low and lower fertility: variations across developed countries, Springer.
Save The Chidren 2018, Le equilibriste. La maternità in Italia (The acrobat women. Maternity in Italy), printed in May by the Italian section of Save the Children.
M.L. Tanturri 2015, Aging Italy: low fertility and societal rigidities, in R.R. Rindfuss, M.K. Choe
Low and lower fertility: variations across developed countries, Springer, 221-257.
O. Thévenon 2011, Family policies in OECD countries: a comparative analysis, «Population and Development review», 37, 1, 57-87.
Riassunto
Confini amministrativi e demografia: aspetti generali e un caso-studio sull’Italia
Questo articolo è diviso in due parti. La prima discute limiti e opportunità della disponibilità di dati demografici riferiti a unità amministrative, condizione comune per le popolazioni del XIX e XX secolo. La seconda esamina un caso particolare, interpretando le differenze di fecondità tra due province delle Alpi orientali italiane (Trento e Belluno) dopo il 1951. Le odierne differenze di fecondità non sono radicate nel passato, ma sono piuttosto dovute ai diversi percorsi di sviluppo economico e/o alle diverse politiche familiari che hanno caratterizzato i due territori, portando Trento a livelli di fecondità stabilmente superiori di 0,3-0,4 figli per donna rispetto a Belluno. Questi risultati mostrano innanzitutto che la bassa fecondità, anche nel contesto italiano, non è un destino ineluttabile. Inoltre – più in generale – questo tipo di analisi, pur non permettendo induzioni causali dirette, vincolate alla possibilità di ricreare un contesto sperimentale o quasi-sperimentale, permette di fare passi avanti nell’interpretazione delle differenze demografiche tra diverse unità amministrative.
Summary
Administrative boundaries and demographic knowledge: general issues and a case-study for Italy
This article is divided in two parts. The first part discusses the limits and the potential linked to the availability of data on administrative units, one of the most common data-conditions when deal-ing with populations of the 19th and 20th centuries. In the second part we examine an articulated
example, namely the description and interpretation of fertility differences between two provinces of the Italian Eastern Alps (Trento and Belluno) in 1951-2011. We will see how – in this case – a
constraint (the availability of data only in aggregate form, at provincial and municipal level) can be transformed into an opportunity to interpret the demographic behaviors actually available. The contemporary fertility differences between the two counties are due to a more dynamic path of economic development and/or more family-oriented social policies in Trento. These results show that also in the low fertility Italian context, a combination of economic development, decent family allowances and measures aimed at reconciliation between work and family can help some couples to have an additional child. Moreover, although this type of analysis does not give conclusions about the causality typical of experimental and quasi-experimental contexts, a careful use of the data available for administrative units for the present and for the past allows us to make progress in interpreting demographic differences.
Parole chiave
Confini amministrativi; Dati demografici; Fecondità; Politiche demografiche.
Keywords