SPECIAL REPORT
Hematopoietic SCT in Europe 2013: recent trends in the
use of alternative donors showing more haploidentical
donors but fewer cord blood transplants
JR Passweg1, H Baldomero1, P Bader2, C Bonini3, S Cesaro4, P Dreger5, RF Duarte6, C Dufour7, JHF Falkenburg8,
D Farge-Bancel9, A Gennery10, N Kröger11, F Lanza12, A Nagler13, A Sureda6and M Mohty14for the European Society for Blood and
Marrow Transplantation (EBMT)
A record number of 39 209 HSCT in 34 809 patients (14 950 allogeneic (43%) and 19 859 autologous (57%)) were reported by 658 centers in 48 countries to the 2013 survey. Trends include: more growth in allogeneic than in autologous HSCT, increasing use of sibling and unrelated donors and a pronounced increase in haploidentical family donors when compared with cord blood donors for those patients without a matched related or unrelated donor. Main indications were leukemias, 11 190 (32%; 96% allogeneic); lymphoid neoplasias, 19 958 (57%; 11% allogeneic); solid tumors, 1543 (4%; 4% allogeneic); and nonmalignant disorders, 1975 (6%; 91% allogeneic). In patients without a matched sibling or unrelated donor, alternative donors are used. Since 2010 there has been a marked increase of 96% in the number of transplants performed from haploidentical relatives (802 in 2010 to 1571 in 2013), whereas the number of unrelated cord blood transplants has slightly decreased (789 in 2010 to 666 in 2013). The use of donor type varies greatly throughout Europe.
Bone Marrow Transplantation (2015)50, 476–482; doi:10.1038/bmt.2014.312; published online 2 February 2015
INTRODUCTION
Hematopoietic SCT (HSCT) is an established procedure for many acquired and congenital disorders of the hematopoietic system, including disorders of the immune system, and as enzyme
replacement in metabolic disorders.1–4The annual activity survey
of the European Society of Blood and Marrow Transplantation
(EBMT), describing the status of HSCT in Europe and affiliated
countries, has become an instrument used to observe trends and
to monitor changes in technology use.5–10The survey captures the
numbers of HSCT performed in the preceding year from each participating team, divided by indication, donor type and stem cell source. The standardized structure of the survey over many years and the excellent commitment of the participating teams allow us to observe changes over time and to evaluate factors associated with these changes. More recently, the survey has included additional information on novel cell therapies with hematopoietic stem cells for hematopoietic use, as well as on the use of
non-hematopoietic stem and progenitor cells.11This coincides with the
recent interest of the WHO (www.who.org) in cell and tissue transplants and further stresses the need for adequate and timely
information.12 The analysis of the survey data spanning over 20
years has shown a continued and constant increase in the annual numbers of HSCT and transplant rates (number of HSCT per 10 million inhabitants) for both allogeneic and autologous HSCT.
This report is based on the 2013 survey data. In addition to transplant rates and indications, this report focuses on the use of
donors other than HLA-identical siblings and matched unrelated donors for allogeneic HSCT.
PATIENTS AND METHODS Data collection and validation
Participating teams were invited to report data for 2013 by indication, stem cell source and donor type as listed in Table 1. The survey allows the possibility to report additional information on the numbers of subsequent transplants performed as a result of relapse, rejection or those that are part of a planned sequential transplant protocol. Supplementary information on the numbers of DLIs, reduced intensity HSCT and the numbers of pediatric HSCT is also collected. Quality control measures included several independent systems: confirmation of validity of the entered data by the reporting team, selective comparison of the survey data with MED-A data sets in the EBMT Registry database, cross-checking with the National Registries.
Teams
Six hundred and eighty-seven centers from 48 countries were contacted for the 2013 survey (39 European and 9 affiliated countries); of which 658 teams reported. This corresponds to a 96% return rate and includes 551 active EBMT member teams. Twenty nine teams failed to report in 2013. Contacted teams are listed in the Supplementary appendix in alphabetical order by country, city, EBMT centre code, with their reported numbers offirst and total HSCT, and of first allogeneic and autologous HSCT. The WHO regional office definitions (www.who.org) were used to classify countries as European or Non-European. Nine non-European countries participated in the 2013 EBMT survey: Algeria, Iran, Israel, Jordan, Lebanon, Nigeria, Saudi Arabia, South Africa and Tunisia. Their data from
1
EBMT Activity Survey Office, Hematology, Department of Medicine, University Hospital, Basel, Switzerland;2
Universitätsklinikum Frankfurt, Goethe-Universität, Frankfurt am Main, Germany;3
Ospedale San Raffaele, Milan, Italy;4
Paediatric Haematology Oncology, Policlinico G.B. Rossi, Verona, Italy;5
Medizinische Klinik V, University of Heidelberg, Heidelberg, Germany;6
Hospital Duran i Reynals, Barcelona, Spain;7
Institute G. Gaslini, Genova, Italy;8
Department of Hematology, University Medical Center, Leiden, The Netherlands;9
Service de Médecine Interne, Hopital St Louis, Paris, France;10
Institute of Cellular Medicine, Newcastle University, Newcastle-Upon-Tyne, UK;11
University Hospital Eppendorf, Hamburg, Germany;12
Hematology and BMT Unit, Cremona, Italy;13
Chaim Sheba Medical Center, Tel-Hashomer, Israel and14
Hospital Saint Antoine, Paris, France. Correspondence: Professor J Passweg, EBMT Activity Survey Office, Division of Hematology, University Hospital Basel, Basel CH-4031, Switzerland.
E-mail: [email protected]
Received 4 December 2014; accepted 4 December 2014; published online 2 February 2015
Table 1. Num bers of hemat opoieti c SCT s in Europe 2013 by ind ication, donor typ e and stem cell sour ce Allogeneic Autologous Total Family Total family Unrelated Total unrelated HLA iden tical Non-id entical Tw in BM BM + BM PB Cord BM PB Cord BM PB BM PB cord only PB cord Allo Auto Total L euk emias 725 3140 15 332 557 2 5 24 4800 795 4675 420 5890 10 489 1 1 0 690 500 11 190 AM L 309 1599 5 169 271 1 2 9 2365 315 2337 211 2863 7 373 0 5228 380 5608 1st CR 232 1123 2 8 8 118 1 1 9 1574 209 1340 114 1663 6 313 0 3237 319 3556 Not 1st CR 77 476 3 8 1 153 0 1 0 791 106 997 97 1200 1 6 0 0 1991 61 2052 A cut e ly mphatic leukemi a 276 688 9 8 6 185 1 2 8 1255 271 767 112 1150 3 7 2 0 2405 75 2480 1st CR 148 486 3 4 1 7 7 1 1 6 763 141 477 60 678 0 5 7 0 1441 57 1498 Not 1st CR 128 202 6 4 5 108 0 1 2 492 130 290 52 472 3 1 5 0 964 18 982 CML 31 107 0 1 8 2 0 0 0 0 176 36 173 13 222 0 3 0 398 3 401 Chronic p hase 20 51 0 6 6 0 0 0 83 21 65 5 9 1 0 0 0 174 0 174 Not 1st chron ic phase 11 56 0 1 2 1 4 0 0 0 93 15 108 8 131 0 3 0 224 3 227 MDS , MDS/MPN ov erlap 93 476 1 4 2 6 9 0 1 6 688 134 882 58 1074 0 1 1 1 1762 12 1774 MPN 11 129 0 9 8 0 0 0 157 22 257 16 295 0 5 0 452 5 457 CLL 5 141 0 8 4 0 0 1 159 17 259 10 286 0 2 5 0 445 25 470 L ymp hopr olife rati v e disorde rs 94 721 0 8 0 111 0 1 17 1024 108 1097 55 1260 51 17 623 0 2284 17 674 19 958 Plasma cell disorde rs — MM 18 220 0 6 16 0 1 10 271 29 283 3 315 4 9532 0 586 9536 10 122 Plasma cell disorde rs — other 1 6 0 0 0 0 0 0 7 0 12 1 1 3 2 256 0 2 0 258 278 Hodg kin's lym phoma 14 102 0 3 4 5 5 0 0 1 206 20 161 23 204 21 1859 0 410 1880 2290 Non-Hodgkin lymp homa 61 393 0 4 0 4 0 0 0 6 540 59 641 28 728 24 5976 0 1268 6000 7268 Solid tumo rs 2 5 0 4 34 0 0 0 4 5 7 8 0 15 54 1428 1 6 0 1483 1543 Neu roblast oma 0 2 0 2 26 0 0 0 3 0 2 5 0 7 2 2 464 1 3 7 487 524 Soft tissue sarcom a 0 0 0 0 3 0 0 0 3 1 0 0 1 5 1 9 0 4 2 4 2 8 Germinal tum ors 0 0 0 0 0 0 0 0 0 0 0 0 0 2 353 0 0 355 355 Brea st canc er 0 1 0 0 0 0 0 0 1 0 0 0 0 0 42 0 1 42 43 Ewing 1 0 0 1 2 0 0 0 4 1 1 0 2 1 5 200 0 6 215 221 Other solid tum ors 1 2 0 1 3 0 0 0 7 3 2 0 5 1 0 350 0 1 2 360 372 Non malig nant disorde rs 601 227 47 86 111 1 1 3 1077 355 245 119 719 4 175 0 1796 179 1975 BM failure — SAA 165 124 4 1 3 2 0 0 1 3 330 117 84 19 220 0 0 0 550 0 550 BM failure — othe r 7 2 1 7 8 17 9 1 0 0 124 51 37 10 98 0 1 0 222 1 223 Hemo globinopa thies — thalassemi a 161 55 17 19 8 0 0 0 260 27 13 1 4 1 0 1 0 301 1 302 Hemo globinopa thies — other 55 7 5 5 3 0 0 0 7 5 7 1 0 8 0 0 0 83 0 8 3 P rimar y Immun e d efi ciencie s 120 18 10 28 56 0 0 0 232 118 89 57 264 2 2 0 496 4 500 Inher ited disorde rs o f m etabol ism 25 6 1 3 1 1 0 0 0 46 28 16 31 75 1 1 0 121 2 123 A u to immun e disease 3 0 2 1 4 0 0 0 10 7 5 1 1 3 1 170 0 2 3 171 194 Others 23 20 0 5 7 0 0 0 55 27 26 12 65 0 2 3 0 120 23 143 T o tal pa tients 1445 4113 62 507 820 3 7 44 7001 1292 6051 606 7949 119 19 738 2 1 4 950 19 859 34 809 Retr ansplants 73 265 2 5 4 165 2 1 5 567 69 468 58 595 5 1543 1162 1548 2710 A d ditional transp lants 11 25 13 7 5 6 4 1 2 43 5 1586 99 1591 1690 T o tal ALL tr ansp lants 1529 4403 64 574 992 5 8 49 7624 1361 6560 666 8587 129 22 867 2 1 6 211 22 998 39 209 P ediatric tr ansp lants 878 241 62 166 292 1 2 6 1648 728 475 254 1457 65 1064 2 3105 1131 4236 Abbreviations: MDS = m yelodysplastic; MPN = m yeloproliferative n eoplasm; P BSC = peripheral blood; SAA = severe aplastic anemia. 477
26 actively transplanting teams make up 6.2% of the total data set and is included in all analyses.
Definitions
Patient and transplant numbers. Wherever appropriate, patient numbers corres-ponding to the number of patients receiving afirst transplant and transplant numbers reflecting the total number of transplants performed are listed.
The term sibling donor includes HLA-identical siblings and twins but not siblings with HLA mismatches. Unrelated donor transplants includes HSCT from unrelated donors with PB and bone marrow as a stem cell source but not cord blood HSCT, these are shown as cord blood HSCT in Figures 3–5. Mismatched family donors are termed‘haploidentical’ for the purpose of this analysis but this category includes also mismatched related donors that are mismatched to a lesser degree than a full haplotype. As the haplotype mismatched donors are the vast majority in this category, the term‘haploidentical’ is used for the entire group.
Multiple transplants may include multiple transplants defined as subsequent transplants within a planned double or triple autologous or allogeneic transplant protocol, and retransplants (autologous or allogeneic) defined as unplanned HSCT for rejection or relapse after a previous HSCT.
Information on additional cellular therapies was subdivided into: HSC for non-hematopoietic use; non-hematopoietic stem cell therapies; MSC therapies for rejection or GVHD prevention/treatment; and DLIs. Collection of information was validated by cross-checking with a similar more detailed survey carried out by TERMIS-EU (Tissue Engineering and Regenerative Medicine International Society; www.termis.org), EULAR (European League against Rheumatism; www.eular.org), ICRS-EU (Interna-tional Cartilage Repair Society; www.cartilage.org) and ISCT (Interna(Interna-tional Society of Cellular Therapy; www.celltherapysociety.org).11
Transplant rates. Transplant rates, defined as the total number of HSCT per 10 million inhabitants, were computed for each country without adjustments for patients who crossed borders and received their HSCT in a foreign country. Population numbers were obtained from Eurostats for the European countries (http://epp.eurostat.ec.europa.eu/portal/page/portal/ statistics/search_database) and the US census bureau database for the non-European countries (http://www.census.gov/population/international/ data/idb/rank.php).
Analysis. Wherever appropriate, absolute numbers of transplanted patients, transplants or transplant rates are shown for specific countries, indications or transplant techniques.
RESULTS 2013 data
Participating teams in 2013. Of the 658 teams, 406 (62%)
performed both allogeneic and autologous transplants; 225 (34%) restricted their activity to autologous HSCT only, and 17 teams (3%) to allogeneic transplants only. Ten teams (1%) reported having performed no transplants in 2013 owing to renovation or temporary closure of the transplant unit. Of the 648 active centers, 120 (19%) centers performed transplants on both adult and pediatric patients. An additional 105 (16%) centers were dedicated pediatric transplant centers, and 423 (65%) centers performed transplants on adults only.
Numbers of patients and transplants. A total of 34 809
patients received their first transplant in 2013. Of these, 14 950
(43%) were allogeneic and 19 859 (57%) autologous. When compared with 2012, the total number of patients trans-planted increased by 3.4% (5.5% allogeneic HSCT and 1.8%
autologous HSCT).10 Furthermore, there were 2710 retransplants
(1162 allogeneic and 1548 autologous) and 1690 multiple transplants (99 allogeneic and 1591 autologous), bringing the total to 39 209 HSCT procedures, 16 211 allogeneic (41%) and 22 998 autologous (59%) performed in 2013, which is an increase of 26% compared with 5 years and 88% compared with 15 years previously.
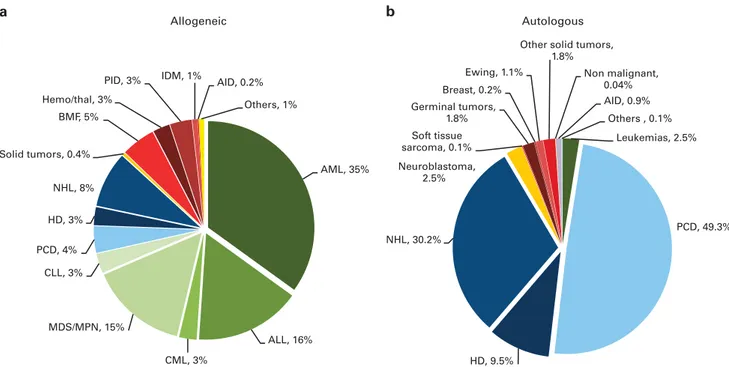
Indications for HSCT in 2013 are listed in detail in Table 1. The main indications were leukemias; 11 190 (32% of total; 96% of which were allogeneic); lymphoid neoplasias including Non-Hodgkin lymphoma, Hodgkin lymphoma and plasma cell disorders, 19 958 (57%; 11% allogeneic); solid tumors, 1543 (4%; 4% allogeneic); and nonmalignant disorders, 1975 (6%; 91% allogeneic). As seen in previous years, the majority of HSCT for lymphoid malignancies were autologous, whereas most transplants for leukemia were performed using stem cells from allogeneic donors. Autologous HSCT for nonmalignant disorders predominantly include patients with autoimmune disorders. AML, 35% ALL, 16% CML, 3% MDS/MPN, 15% CLL, 3% PCD, 4% HD, 3% NHL, 8% Solid tumors, 0.4% BMF, 5% Hemo/thal, 3%
PID, 3% IDM, 1% AID, 0.2% Others, 1% Allogeneic Autologous Leukemias, 2.5% PCD, 49.3% HD, 9.5% NHL, 30.2% Neuroblastoma, 2.5% Soft tissue sarcoma, 0.1% Germinal tumors, 1.8% Breast, 0.2% Ewing, 1.1%
Other solid tumors, 1.8% Non malignant, 0.04% AID, 0.9% Others , 0.1% a b
Figure 1. Relative proportions of indications for an HSCT in Europe in 2013. (a) Proportions of disease indications for an allogeneic HSCT in Europe in 2013. (b) Proportions of disease indications for an autologous HSCT in Europe in 2013.
Distributions of indications for HSCT are shown in Figures 1a and b for allogeneic and autologous HSCT, respectively. Compared with 2012, there were increases in allogeneic HSCT for AML in CR1 (10.7%), MPN (11.1%) and NHL (12.5%). For autologous HSCT, there was a decrease in activity for AML (18%) and HD (10%) but an increase for plasma cell disorders by 6.1%.
DLIs. 2513 patients received treatment with DLIs, a 12% increase
since 2012.
Reduced intensity conditioning. 6534 of the total allogeneic HSCT
were performed using non myeloablative conditioning. This is an increase of 11.4% since 2012 and is 40% of all allogeneic HSCT.
0 or no report 1 - 50 51 – 100 101 - 150 151 – 200 201 – 300 > 300
Allogeneic transplants per 10 million population in
1998 2013
Israel
Algeria, Iran, Kazakhstan, Nigeria, South Africa, Tunisia Lebanon
Jordan, Saudi Arabia Israel
Autologous transplants per 10 million population in
1998 2013
Algeria, Iran, Jordan, Kazakhstan, Saudi Arabia, South Africa, Tunisia Lebanon Israel 0 1 - 100 101 - 200 201 – 300 301 – 400 > 400 Israel a b
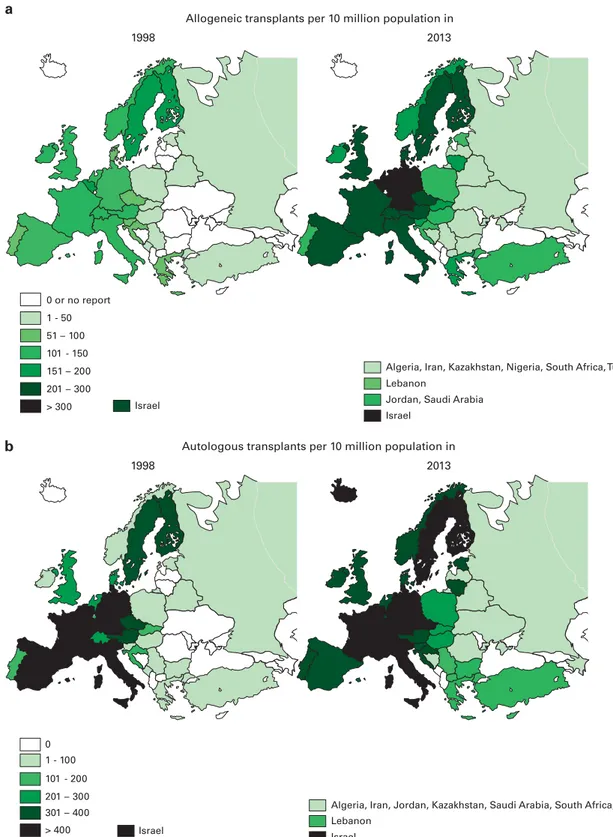
Figure 2. Transplant rates in Europe ( = total number of HSCT per 10 million inhabitants) by participating country, showing 15-year trends
1998–2013. (a) Allogeneic transplant rates per 10 million population in 1998–2013 (b) Autologous transplant rates per 10 million population in
1998–2013.
Fifteen year trends
Figures 2a and b show transplant rates by country for allogeneic and autologous HSCT comparing rates in 2013 to rates 15 years ago, to 1998. Median transplant rates per 10 million inhabitants
were 124 (range, 0.1–493) for allogeneic HSCT and 233 (range,
1.0–538) for autologous HSCT in 2013 as compared with 89 and 164 in 1998.
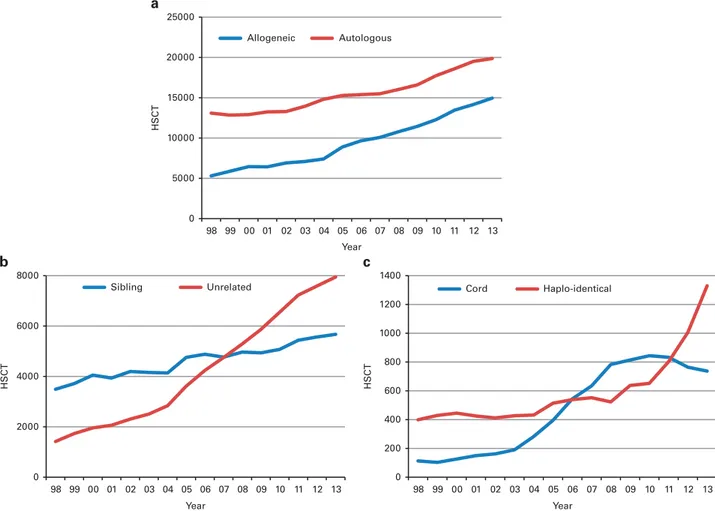
Figure 3a shows the 15-year trends for allogeneic and autologous HSCT showing some narrowing in the difference between autologous and allogeneic HSCT performed.
Figure 3b shows trends for allogeneic HSCT over the past 15 years for sibling donor and unrelated donor transplantation, with more unrelated donor HSCT since 2007 as compared with sibling donor HSCT, unrelated donor HSCT accounting for (53% of all
allogeneic HSCT)% in 2013.13Figure 3c shows trends in the use of
alternative donor transplantation, separately for cord blood and for haploidentical family donor HSCT. It is obvious that the use of cord blood has stabilized in 2011 and is going down slightly; the number of haploidentical HSCT has more than doubled since 2010. For haploidentical HSCT, marrow is used in 37% and PB in
63% as a stem cell source14,15in 2013.
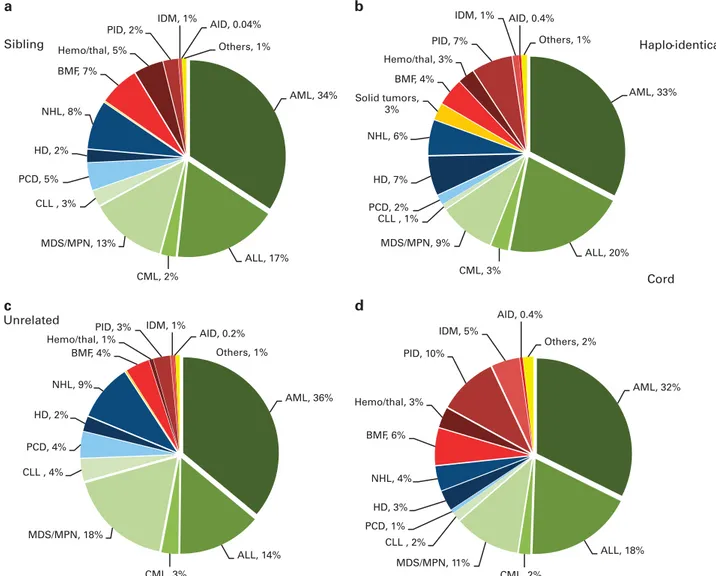
Figures 4a–d depict the indications for allogeneic HSCT separately for sibling donor, unrelated donor, cord blood donor and haploidentical donor HSCT in 2013. When comparing leukemias, lymphoid neoplasias and nonmalignant disorders, distributions of indications do not differ greatly; except for nonmalignant disorders receiving more commonly cord blood
transplants, reflecting the younger age of these patients and the
preference for cord blood in children.
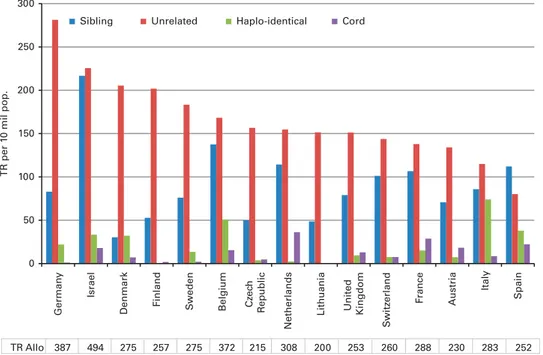
Figure 5 shows transplant rates for the 15 countries with the highest rates of allogeneic HSCT in Europe ordered by decreasing
rate of unrelated donor HSCT. This figure shows considerable
heterogeneity in the use of HSCT technology among countries. Additional cellular therapies
Seventeen teams from 11 countries reported having treated 130 patients with hematopoietic stem cells for non-hematopoietic use
in 2013. All therapies were performed using autologous HSC’s. The
main indications were cardiovascular, 75; neurological, 32; tissue repair, 20; and epithelial, 3. In addition, 405 patients in 86 teams and 21 countries received mesenchymal stromal cells for prevention/treatment of GVHD (344), prevention/treatment of
graft failure (34) and for unspecified reasons (27).11
DISCUSSION
The EBMT activity survey has been conducted annually since
1990.6The 2010 survey reported for the first time in more than
30 000 patients transplanted in a given year.16This trend continues
with an additional increase by 3.6% in 2013, suggesting that HSCT remains an increasingly important treatment modality in the era of targeted antibody and molecular therapy. The present 2013 report focuses on allogeneic transplants using different types of donors.
0 5000 10000 15000 20000 25000 98 99 00 01 02 03 04 05 Year Year Year 06 07 08 09 10 11 12 13 HSCT HSCT Allogeneic Autologous 0 200 400 600 800 1000 1200 1400 98 99 00 01 02 03 04 05 06 07 08 09 10 11 12 13 HSCT Cord Haplo-identical 0 2000 4000 6000 8000 98 99 00 01 02 03 04 05 06 07 08 09 10 11 12 13 Sibling Unrelated a b c
Figure 3. Absolute numbers by transplant and donor type 1998–2013. (a) Absolute numbers of allogeneic and autologous HSCT in Europe in
1998–2013. (b) Absolute numbers of sibling donor and unrelated donor HSCT in Europe 1998–2013. (c) Absolute numbers of haploidentical
and cord blood HSCT in Europe 1998–2013.
HSCT for some indications continues to increase but not for others. Of interest is growth of allogeneic HSCT for AML in CR1, MPN and lymphoma. For autologous HSCT, the number of transplants for myeloma continues to increase. In autologous HSCT, the numbers of procedures for AML in CR1 and for Hodgkin's lymphoma dropped slightly. The decrease in auto-logous HSCT for Hodgkins Lymphoma of 10% may be related to the availability of monoclonal antibodies in this disease.
Notable in this year's survey is the increase in the use of allogeneic HSCT more than autologous HSCT and the increasing use of alternative donor transplants, where an impressive trend for more haploidentical HSCT has been observed. The category of haploidentical HSCT as used for this analysis includes haploiden-tical HSCTs as well as mismatched family donor HSCTs, where the mismatch does not include a full haplotype, for example, 1 or 2 allele mismatched relatives. Unfortunately we do not have the data to separate these categories but we think it is unlikely that the increase observed could be explained by one allele mismatched siblings. The increase in haploidentical HSCT coin-cides with the publications of the post-transplant CY GVHD
prophylaxis in haploidentical HSCT.14 Again we do not have the
data within this survey to separate haploidentical HSCTs using this strategy from other ways to perform haploidentical HSCT.
This is accompanied by a slight decrease in HSCT using cord blood pointing to the fact that mismatched unrelated cord blood and haploidentical donors are in competition for patients in whom no sibling or matched unrelated donor has been
identified.14,5,17
When comparing the use of donors for allogeneic HSCT in countries with high transplant rates, it is obvious that there are important differences. Some may be explained by availability of sibling donors as there are differences in family size across Europe. There are, however, threefold differences in transplant rates for sibling and unrelated donor HSCT among countries and even larger differences in the use of unrelated cord blood and
haploidentical donors probably reflecting availability, financial
issues as well as differences in the interpretation of results of recent studies and local experience.
Overall, this paper reflects current practice, and results may be useful to health care planning and health policy makers.
CONFLICT OF INTEREST
The authors declare no conflict of interest.
AML, 33% ALL, 20% CML, 3% MDS/MPN, 9% CLL , 1% PCD, 2% HD, 7% NHL, 6% Solid tumors, 3% BMF, 4% Hemo/thal, 3% PID, 7% IDM, 1% AID, 0.4% Others, 1% Haplo-identical AML, 34% ALL, 17% CML, 2% MDS/MPN, 13% CLL , 3% PCD, 5% HD, 2% NHL, 8% BMF, 7% Hemo/thal, 5% PID, 2% IDM, 1% AID, 0.04% Others, 1% Sibling AML, 36% ALL, 14% CML, 3% MDS/MPN, 18% CLL , 4% PCD, 4% HD, 2% NHL, 9% BMF, 4% Hemo/thal, 1% PID, 3% IDM, 1% AID, 0.2% Others, 1% Unrelated AML, 32% ALL, 18% CML, 2% MDS/MPN, 11% CLL , 2% PCD, 1% HD, 3% NHL, 4% BMF, 6% Hemo/thal, 3% PID, 10% IDM, 5% AID, 0.4% Others, 2% Cord a b c d
Figure 4. Disease indications by donor type in 2013. (a) Proportions of disease indications in 2013 for sibling donor HSCT. (b) Proportions of disease indications in 2013 for haplo-identical donor HSCT. (c) Proportions of disease indications in 2013 for unrelated donor HSCT. (d) Proportions of disease indications in 2013 for cord blood HSCT.
ACKNOWLEDGEMENTS
The cooperation of all participating teams and their staff (listed in the Appendix), the EBMT Co-ordination office; Barcelona, Paris, London (C Ruiz de Elvira), the Austrian Registry (ASCTR) (H Greinix, B Lindner, CWagner), the Belgium Registry (Yves Beguin, M Van Spauwen) the Czech Registry (P Zak, M Trnkova), the French Registry (SFGM) (N Milpied, N Raus ), the German Registry (DRST) (H Ottinger, K Fuchs, C Müller, H Neidlinger, F Strehle), the Italian Registry (GITMO) (A Rambaldi, B Bruno, A Camboni), the Dutch Registry (JJ. Cornelissen, M Groenendijk), the Spanish Registry (GETH) (J Diez Martin, A Cedillo), the Swiss Registry (SBST) (U Schanz, H Baldomero), the Turkish Registry (G Gurman, M Arat) and the British Registry (BSBMT) (K Kirkland, J Perry) is greatly appreciated. We also thank D John for database support. EBMT is supported by grants from the corporate sponsors: Gentium S.p.A, Molmed S.p.A, AstellasPharma Europe Ltd, Celgene International SARL, Clinigen Group Ltd, Gilead Sciences Europe Ltd, GlaxoSmithKline plc, Hospira Inc., Medac Hematology GmbH, MiltenyiBiotec GmbH, MSD Sharp&Dohme GmbH, Neovii Biotech GmbH, Sanofi Oncology, Takeda, Terumo BCT, Therakos Photopheresis, Alexion, Amgen Oncology GmbH, Exem Consulting SA, Kiadispharma, Macropharma, Mundipharma and Pierre Fabre Médicament SAS.
REFERENCES
1 Copelan EA. Hematopoietic stem-cell transplantation. N Engl J Med 2006;354: 1813–1826.
2 Appelbaum FR. Hematopoietic-cell transplantation at 50. N Engl J Med 2007;357: 1472–1475.
3 Ljungman P, Bregni M, Brune M, Cornelissen J, deWitte T, Dini G et al. European Group for Blood and Marrow. Allogeneic and autologous transplantation for haematological diseases, solid tumours and immune disorders: current practice in Europe 2009. Bone Marrow Transplant 2010;45: 219–234.
4 Gratwohl A, Baldomero H, Aljurf M, Pasquini MC, Bouzas LF, Yoshimi A et al. Hema-topoietic stem cell transplantation: a global perspective. JAMA 2010;303: 1617–1624. 5 Gratwohl A, Baldomero H, Schwendener A, Gratwohl M, Apperley J, Frauendorfer K et al. The EBMT activity survey 2008 impact of team size, team density and new trends. Bone Marrow Transplant 2011;46: 174–191.
6 Gratwohl A. Bone marrow transplantation activity in Europe 1990. Report from the European Group for. Bone Marrow Transplantation (EBMT). Bone Marrow Trans-plant 1991;8: 197–201.
7 Gratwohl A, Baldomero H, Horisberger B, Schmid C, Passweg J, Urbano-Ispizua AAccreditation Committee of the European Group for Blood and Marrow Trans-plantation (EBMT). Current trends in haematopoietic stem cell transTrans-plantation in Europe. Blood 2002;100: 2374–2386.
8 Gratwohl A, Baldomero H, Schwendener A, Rocha V, Apperley J, Frauendorfer K et al. The EBMT activity survey 2007 with focus on allogeneic HSCT for AML and novel cellular therapies. Bone Marrow Transplant 2009;43: 275–291.
9 Gratwohl A, Schwendener A, Baldomero H, Gratwohl M, Apperley J, Niederwieser D et al. Changes in use of hematopoietic stem cell transplantation; a model for diffusion of medical technology. Haematologica 2010;95: 637–643.
10 Passweg JR, Baldomero H, Peters C, Gaspar H B, Cesaro S, Dreger P et al. Hematopoietic SCT in Europe: data and trends in 2012 with special consideration of pediatric transplantation. Bone Marrow Transplant 2014;49: 744–750. 11 Martin I, Ireland H, Baldomero H, Passweg JR. The survey on cellular and
engi-neered tissue therapies in Europe in 2012. Tissue Eng Part A 2014 (e-pub ahead of print).
12 World Health Organisation, WHO (http://www.who.int/topics/transplantation/en/). 13 Foeken LM, Green A, Hurley CK, Marry E, Wiegand T, Oudshoorn M. Monitoring the international use of unrelated donors for transplantation: the WMDA annual reports. Bone Marrow Transplant 2010;45: 811–818.
14 Brunstein CG, Fuchs EJ, Carter SL, Karanes C, Costa LJ, Wu J et al. Blood and Marrow Transplant Clinical Trials Network. Alternative donor transplantation after reduced intensity conditioning: results of parallel phase 2 trials using partially HLA-mismatched related bone marrow or unrelated double umbilical cord blood grafts. Blood 2011;118: 282–288.
15 Luznik L, O'Donnell PV, Symons HJ, Chen AR, Leffell MS, Zahurak M et al. HLA-haploidentical bone marrow transplantation for hematologic malignancies using nonmyeloablative conditioning and high-dose, posttransplantation cyclopho-sphamide. Biol Blood Marrow Transplant 2008;14: 641–650.
16 Passweg JR, Baldomero H, Gratwohl A, Bregni M, Cesaro S, Dreger P et al. The EBMT activity survey: 1990-2010. Bone Marrow Transplant 2012; 47: 906–923.
17 Eapen M, O'Donnell P, Brunstein CG, Wu J, Barowski K, Mendizabal A et al. Mis-matched related and unrelated donors for allogeneic hematopoietic cell trans-plantation for adults with hematologic malignancies. Biol Blood Marrow Transplant 2014;20: 1485–1492.
This work is licensed under a Creative Commons Attribution-NonCommercial-NoDerivs 4.0 International License. The images or other third party material in this article are included in the article’s Creative Commons license, unless indicated otherwise in the credit line; if the material is not included under the Creative Commons license, users will need to obtain permission from the license holder to reproduce the material. To view a copy of this license, visit http:// creativecommons.org/licenses/by-nc-nd/4.0/
Supplementary Information accompanies this paper on Bone Marrow Transplantation website (http://www.nature.com/bmt)
0 50 100 150 200 250 300 German y Israel Denmark Finland S weden Belgium Cz ec h R e public Netherlands
Lithuania United Kingdom
S
witz
erland France Austria
Italy
Spain
TR per 1
0
mil pop.
Sibling Unrelated Haplo-identical Cord
TR Allo 387 494 275 257 275 372 215 308 200 253 260 288 230 283 252
Figure 5. Transplant rates for sibling donor, unrelated donor, haploidentical donor and cord blood HSCT in Europe in 2013 for the 15 countries with the highest transplant rates.
