eISSN 1847-8476
Long-term cropland abandonment does not
lead per se to the recovery of semi-natural herb
communities deemed habitats of community
interest
Natalia Troiani1, Federico Maria Tardella2*, Luca Malatesta3, Marcello Corazza1, Carlo Ferrari1, Andrea Catorci2
1 University of Bologna, Department of Biological, Geological and Environmental Sciences, Botanic Garden via Irnerio 42, 40126, Bologna, Italy; [email protected], [email protected], [email protected]
2 University of Camerino, School of Biosciences and Veterinary Medicine, via Pontoni 5, 62032, Camerino, MC, Italy; [email protected], [email protected]
3 University of Camerino, School of Advanced Studies, via Lili 55, 62032, Camerino, MC, Italy; e-mail: [email protected]
Abstract – Abandoned croplands can be considered a new category of »scattered elements« of mountain
landscapes. To gain a deeper understanding of the conservation status (sensu EEC Directive 92/43) of aban-doned cropland in the northern Apennines, we used the concept of the social behavior type (SBT) of plant communities. SBTs refer to the behaviour and ecological attributes of species at a given observation level and allow the understanding of the plant community conservation status. We found that topographic and soil con-ditions drive species assemblage in pastures after crop abandonment, but that long-term abandonment does not lead per se to the recovery of the semi-natural grassland communities deemed worthy of conservation in the EEC Directive. It was mainly the lack of appropriate disturbance regimes that allowed the spread of dominant tall herbs, which, in turn, reduced site suitability for subordinate plants. Moreover, their spread fos-tered the presence of elements such as ruderals and fringe species. We concluded that these abandoned crop-lands had a good potential to develop into a Habitat as defi ned in the EU Directive but without appropriate management plans they would remain of low representativeness.
Keywords: abandonment, croplands, Ellenberg’s indicator values, grassland recovery, management, protected
habitats, social behaviour types
Abbreviations: AWC – available water capacity, CVRE – cross-validation relative error, DCA – detrended
correspondence analysis, EIV – Ellenberg’s indicator value, ISA – indicator species analysis, IV – indicator value, M – soil moisture, MRT – multivariate regression tree, N – soil nutrients content, R – soil chemical reaction, RDA – redundancy analysis, SBT – social behaviour type, T – air temperature.
* Corresponding author, e-mail: [email protected]
Introduction
In a large part of Europe, the abandonment of traditional extensive farming activities has led to successional changes toward forest (Poschlod and WallisDeVries 2002), and the abandonment of hilly and mountain croplands to the forma-tion of new herbaceous communities (Peroni et al. 2000); these abandoned areas can be viewed as new »scattered ele-ments« in areas where forest recovery and expansion are underway as well as in agricultural landscapes, which are generally undergoing processes of intensifi ed land use. In fact, in both cases, socio-economic and natural processes
are threatening biodiversity and leading to homogeneous landscapes (Robinson and Sutherland 2002). The conserva-tion and management of these new open ecosystems are key elements within the European agricultural policies (Rieger 2000, Rounsevell et al. 2005). Currently, the resto-ration of grassland on former croplands is a high priority of nature conservation (Stadler et al. 2007) and is one of the most frequent habitat restoration actions in central and northern Europe (Cramer et al. 2008).
Habitat (sensu 92/43/EEC Directive) protection entails regular monitoring, but before that, the target habitats must
be properly defi ned and their conservation status assessed (Ejrnæs et al. 2004). However, Annex I of the Directive, building on an extensive classifi cation of habitats, fails to specify how to discriminate between protected and non pro-tected habitats along the continuum from natural to cultural, and there is not much help in the scientifi c literature in this regard (Ejrnæs et al. 2008). Signifi cant contributions to solving this problem may be found in the phytosociological assessment of vegetation, since the phytosociological com-position of a plant community (that is the presence of spe-cies belonging to different phytosociological units, such as classes, orders, etc.) reveals both its ecological and its dy-namic conditions (Biondi 2011). Moreover, since the 92/43/ EEC Directive defi ned habitats in phytosociological terms, the phytosociological assessment of vegetation would be a logical tool for habitat interpretation.
Another useful approach could be species grouping by social behavior types (SBTs) (Moola and Vasseur 2004, Gondard et al. 2006). SBTs derive from species behaviour and ecological attributes at a given observation level (Borhidi 1995). Social behaviour can be defi ned as the role that a plant species plays in the community considering species in regard to their auto-ecology, morphology and physiological performances (Alard and Poudevigne 2000). Therefore, assessment of an SBT provides information on the mechanisms underlying species assemblage and helps to clarify the ecological meaning of the species pool char-acterizing a certain plant community (Catorci et al. 2011a). Since the higher levels of phytosociological classifi cation (class and order) group species that share wide ecological needs and dynamic features, they can be useful indicators of SBTs (Catorci et al. 2011a). In this way, it is possible to couple the phytosociological approach with the SBT as-sessment of a plant community, thus gaining a deeper un-derstanding of its conservation status.
We focused on semi-natural dry grasslands that had tak-en over abandoned croplands in the hilly landscape of the Tuscan-Emilian Apennines, since this territory is undergo-ing strong processes of cropland abandonment and the re-forestation of mountain slopes (Piussi and Pettenella 2000). In addition, only few studies have examined grassland re-covery after fi eld abandonment in a sub-Mediterranean cli-mate in relation to conservation status as EU habitats. Such an assessment of how biotic and abiotic features affect the species assemblage might also provide key information for managing these ecosystems in order to achieve a favorable conservation status.
It has been argued that succession of abandoned fi elds leads to the formation of semi-natural communities whose fl oristic and structural features depend on such factors as resource availability (Ejrnæs et al. 2008), time since aban-donment, and availability of seeds in neighbouring habitats (Pywell et al. 2002, Ruprecht 2006). Moreover, altitude and land form (Burrascano et al. 2013), soil features (Catorci and Gatti 2010), land use history (Catorci et al. 2011a) and disturbance type and intensity (Peco et al. 2006, de Bello et al. 2007, Kramberger and Kaligarič 2008, Catorci et al. 2012, Ribeiro et al. 2012) have proved to be crucial factors in determining grassland species composition. In particular,
grazing animals facilitate the dispersal of seeds, create gaps for colonization (Gibson and Brown 1992, Bruun and Fritz-bøger 2002) and foster species with resistance strategies to herbivory (Grime 2001).
Thus, we expected that in former cropland (abandoned nearly 20 years ago and previously ploughed every year) dynamic processes would lead to the formation of herba-ceous communities with different species composition de-pending on the different abiotic conditions, but these proc-esses are not suffi cient per se to transform abandoned crops into semi-natural grassland communities included in Annex I of the Habitats Directive. We also postulated that the ab-sence of disturbance allows the spread of competitive tall grasses and shrubs and thus affects the species composition, hindering the achievement of a favourable conservation sta-tus.
The specifi c research questions were: i) which environ-mental factors drive the species assemblage of plant commu-nities after crop abandonment? ii) how do environmental features infl uence species composition of plant communi-ties? iii) does the evaluation of the coenological composi-tion of plant communities after crop abandonment provide insight signifi cant for the assessment of their dynamic state and conservation status according the standards defi ned by the 92/43/EEC Directive?
Materials and methods
Study area
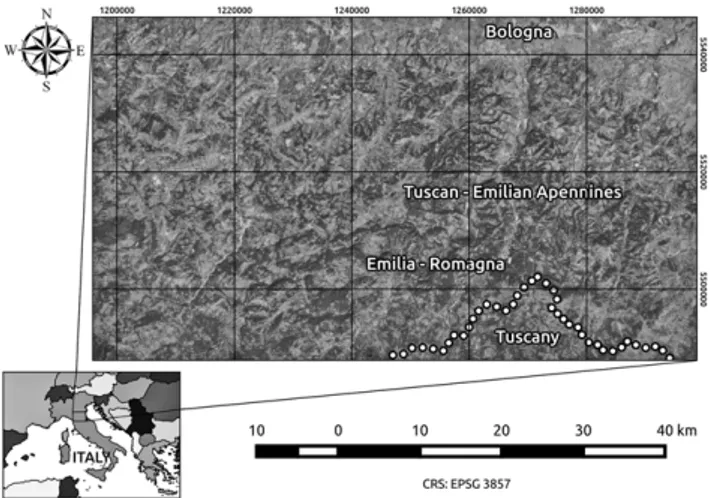
The study area (Fig. 1) is located in the south-eastern and south-western part of Bologna province (Italy), be-tween 200 and 500 m a.s.l. From a bioclimatic viewpoint, the area is included in the sub-Mediterranean variant of the temperate continental and oceanic bioclimates (Pesaresi et al. 2014). The mean annual temperature is 13–14 °C. The annual rainfall is 800–900 mm. A period of drought stress occurs in summer; July is the driest month (average rainfall 40–50 mm), and winter cold stress occurs between early December and late February. The geological substratum consists of a mosaic of clays with chaotic structure (debris fl ow – mudfl ow), stone material, conglomerates and gravel,
Fig. 1. Location of the study area in the eastern and
chalks, sandstones, marly, silty and fl aky clays. Soils are generally deep (30–60 cm) with neutro-basic pH (6.5–7.5), mainly with sandy-loam and silty-clayey textures. The ac-tual natural potential vegetation is referred to Quercus
pu-bescens s.l. woods of the Peucedano cervariae-Quercetum pubescentis association and hop-hornbeam woods of the Ostryo-Aceretum opulifolii (Blasi 2010). The studied sites
encompass former croplands (with wheat and alfalfa grown in rotation), where agricultural or pastoral practices have been absent at least for the last 20 years. All the study sites are characterized by herbaceous communities that are cur-rently unmanaged.
Sampling design and data collection
We collected data in June-July 2013 in order to observe both the spring and the summer fl owering species. Using a GIS, we overlaid the study area with a grid composed of 100 × 100 m macro-plots, each further divided into 100 plots (10 × 10 m). In each macro-plot we randomly selected one 10 × 10 m plot, excluding those that fell completely or partly on woods, brush and shrub vegetation, as well as those that fell in a buffer of 50 m from these vegetation types to avoid the edge effect. In all, we surveyed 100 plots. In each plot we recorded species cover values (percent val-ues, visually estimated), altitude (m a.s.l.), slope aspect (azimuth degrees), slope angle (vertical degrees), outcrop-ping rock cover and litter cover (percent values, visually estimated), soil depth (cm, fi ve measurements per plot) and collected fi ve soil sub-samples, taken within a depth of 30 cm and combined in one bulked sample.
To better characterize the plant communities from an ecological viewpoint, we assessed the Ellenberg indicator values (EIVs). We gathered EIVs from Pignatti (2005) and Guarino et al. (2012). EIVs proved to be useful in analyzing the drivers of vegetation change (i.e. McCollin et al. 2000, Klaus et al. 2012) especially when they are considered for comparison on a local scale (Godefroid and Dana 2007). In particular, we assessed air temperature (T), soil moisture (M), soil nutrient content (N), and soil chemical reaction (R).
To assess the dynamic and conservation state of the plant communities, we grouped species in SBTs. Species SBTs were assessed with respect to their regional synecol-ogy, following the most widely accepted phytosociological placement of each species (Ubaldi 2013, Biondi et al. 2014, Biondi and Pesaresi 2004, Biondi et al. 2005, Čarni 2005). We considered the following SBTs: SBT1, species of per-ennial semi-natural grassland usually undergoing herbivory (characteristic of Festuco-Brometea Br.-Bl. et Tx. 1943 class); SBT2, species of xeric grasslands (characteristic of
Tubera-rietea guttatae Br.-Bl., Roussine & Nègre 1952 and Sedo-Scleranthetea Br.-Bl. 1955 classes); SBT3, species of
mea-dows (characteristic of Molinio-Arrhenatheretea Tx. 1937 class) usually undergoing soil nitrogen enrichment and an-nual cutting; SBT4, species of fringe habitats (i.e. species usually growing at the border of woody ecosystems and of forest clearings, characteristic of Trifolio-Geranietea
sangui-nei Müller 1962 class); SBT5, successional species
(char-acteristic of Rhamno-Prunetea Rivas Goday & Borja ex Tüxen 1962, Calluno-Ulicetea Br.-Bl. & Tüxen ex Klika & Hadac 1944 and Querco-Fagetea Br.-Bl. & Vlieger in Vlieger 1937 classes); and SBT6, pioneer, ruderal, nitrophi-lous and semi-nitrophinitrophi-lous species growing in cultivated and uncultivated lands (characteristic of Artemisietea
vul-garis Lohmeyer, Preising & Tüxen ex von Rochow 1951
and Stellarietea mediae Tüxen, Lohmeyer & Preising ex von Rochow 1951 classes). In this way we were able to as-sess the dynamic status of the plant communities (consider-ing for instance SBTs 1, 2, and 3 versus SBTs 4 and 5) or the management-related impact on species composition (i.e. by assessing the abundance of SBTs 5 and 6), besides the relationship between environmental constraints and species composition. To assess the state of conservation of plant communities according the standards defi ned by the 92/43/EEC Directive, we consulted as a reference manual the »Italian Interpretation Manual of Habitats of the 92/43/ EEC Directive« (Biondi et al. 2009). Species nomenclature followed Conti et al. (2005).
Data analysis
Aspect azimuth was fi rst converted from the 0–360 compass scale to a linear (0–180) scale, giving northerly as-pect a value approaching 0 and southerly asas-pect a value ap-proaching 180. This transformation also converted east and west azimuth degrees so that they were equally distant from north. Moreover, as south-south-west-facing slopes are the warmest aspect, the aspect azimuth was shifted to a mini-mum on north-north-east slopes (22.5°) and a maximini-mum on south-south-west slopes (202.5°).
Data on soil depth were averaged for each plot. Soil samples were analysed in the laboratory of the University of Bologna to determine the percentages of skeleton, sand, loam, and clay. In order to have a proxy for the soil water regimes, for each plot we calculated the soil available water capacity (AWC) using the software developed in Microsoft Offi ce Excel 2000 by Armiraglio et al. (2003). AWC repre-sents the maximum amount of available water the soil can provide. It mainly depends on soil texture and depth and, secondly, on soil specifi c weight and organic matter content (McRae 1991). The input variables processed were soil depth (cm), soil texture (percentage of sand, clay, loam, and percentage of skeleton), and a coeffi cient of water available for plants under a pressure of 0.05–15.00 bars, obtained from tabulated values (McRae 1991). Even though the out-puts obtained are imprecise because they lack data on or-ganic matter, nonetheless they offer a good proxy for com-paring plots, because the estimation was based on soil depth and texture, and thus was independent of vegetation struc-ture (i.e. vegetation cover, tiller density, canopy height, lit-ter decomposition rate, etc.), which might allit-ter the soil or-ganic matter content.
To transform SBT binary data (presence/absence) into quantitative data (i.e. aggregated cover values of each SBT), we multiplied the »relevés × species cover« matrix by the »species × SBT« matrix to provide a »relevés × SBT cover« matrix, which formed the basis for the following analyses.
i) Environmental features driving the species assemblage after cropland abandonment
To assess the infl uence of macro-environmental vari-ables on species assemblage, a constrained clustering using multivariate regression tree (MRT) analysis (De’ath 2002) with 100 iterations was executed on the »relevés × species« matrix constrained by the environmental variables (altitude, slope aspect, slope angle, AWC, outcropping rock cover, and litter cover). Prior to MRT analysis, species data were transformed using chord transformation (Legendre and Gallagher 2001). An overall error statistic (cross-validation relative error, CVRE) was computed for each test group and partition size (number of groups), to choose the optimal size of the tree. For each partition size, the mean and stan-dard error of all CVRE estimates were computed. To pro-vide a general overview of the ecological characteristics of the plant communities highlighted by MRT, we calculated mean, standard deviation, median, and 1st and 3rd quartiles
for each environmental variable. We used the Shapiro-Wilk test to test the distribution normality of data. As data were not normally distributed, we ran the non-parametric Wil-coxon exact rank test to evaluate differences between groups at each step of clustering. Mean species cover val-ues and species relative frequency in each group are report-ed in the On-line Suppl. Tab. 1.
To further assess the environmental features character-izing the groups of relevés emerging from MRT analysis, we first calculated the unweighted mean of T, M, N and R EIVs of the species present within each plot. Following Zelený and Schaffers (2012), we fi tted mean EIVs, calcu-lated for samples, onto a detrended correspondence analysis (DCA) ordination employing a permutation test that cor-rects the bias in the relationship between mean species EIVs and sample scores along ordination axes, introduced by the fact that mean EIV inherits compositional similarity among samples. Finally, we calculated the mean and medi-an EIV for each group of relevés.
To perform MRT analysis, Shapiro-Wilk tests, Wilcox-on exact rank tests, and DCA we used the R software (ver-sion 2.15.2, R Core Team 2012) packages mvpart ver(ver-sion 1.6-1 (mvpart function), stats version 2.15.2 (shapiro.test function), exactRankTests version 0.8-27 (wilcox.exact function), and vegan version 2.0-10 (decorana function), re-spectively. The R function used for projection of mean EIVs onto an ordination, with modifi ed permutation test was envfi t.iv (Zelený and Schaffers 2012).
ii) How do environmental features infl uence species and coenological composition of plant communities? To understand how abiotic factors infl uence the species composition of plant communities, we performed indicator species analysis (ISA) to highlight the indicator species set (i.e. the species pool showing a preferential distribution among clusters) of each group (Dufrêne and Legendre 1997). To identify the indicator SBTs (aggregated cover values of species sharing the same SBT) for each group identifi ed by MRT, we executed ISA on the »relevés × SBT cover« matrix using membership of MRT groups as group-ing variable. To perform ISA we used labdsv version 1.6-1
(indval function) R-package. Finally, to better assess the status of grassland communities, we calculated the relative abundance of each SBT in every plant community consid-ered (cover percent value of the considconsid-ered SBT out of the total cover value of all the recorded SBTs in the plant com-munity).
Results
i) Environmental features driving the species assemblage after cropland abandonment
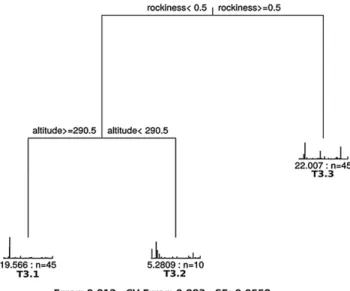
MRT analysis generated a 3-leaved MRT with CVRE = 0.88 and standard error = 0.056 (Fig. 2), which was fre-quently selected as the best solution during the cross-vali-dation iterations. The basic descriptive statistics of the envi-ronmental variables for each group highlighted by MRT and the statistical signifi cance of differences between groups at each partition are shown in Tab. 1. The variable discrimi-nating between the two branches in the fi rst node of the 3-leaved MRT was rockiness. The relevés of the third leaf (T3.3) were characterized by the presence of outcropping rocks, while in the other groups rockiness was absent. More-over, this group had lower AWC mean values and higher litter cover and altitude mean values than the group com-posed of T3.1 and T3.2. Differences between the two groups with regard to these variables were statistically sig-nifi cant (Tab. 1). The second partition was defi ned by tude (Fig. 2). Group T3.1 included relevés located at alti-tudes higher than 290 m a.s.l. (mean value 418 m), with low
Fig. 2. The 3-leaved multivariate regression tree for the species
data set, constrained by the explanatory variables data set. Rocki-ness (%) and altitude (m a.s.l.) discriminated the two branches of the tree. The threshold values shown for each partition of the tree correspond to the mean of the two limit values of the considered variables at the break between the branches. The relative abun-dances of the species are shown in histograms at the tips of the branches, with the species in the same order as in the input fi le. Under each histogram, the sum of squared errors for the group and the number of relevés in the leaf (n) are indicated. Below the tree, the residual error (Error), the cross-validation error (CV Error) and standard error (SE) are indicated.
slope angles, while altitudes lower than 290 m, slightly high-er AWC values and lowhigh-er litthigh-er covhigh-ers characthigh-erized relevés belonging to group T3.2 (Tab. 1). The fi rst two axes of DCA based on the »relevés × species« matrix using mean ran-domized EIV values as constraining variables explained 77% of the constrained variance (52% explained by axis 1 and 25% by axis 2). Soil chemical reaction was strictly re-lated to axis 1, while temperature was rere-lated to both axes. The combination of these two variables explained the sepa-ration of the three groups of plots, as indicated by the DCA scatterplot (Fig. 3). The differences in mean and median values of EIVs are in line with DCA results (Tab. 2). The T3.1 group was positively correlated with EIV soil reaction (i.e. with soils with higher pH), and characterized by a mean value greater than groups T3.2 and T3.3. The T3.2 group was positively correlated with EIV air temperature and characterized by higher mean T value than the other groups. Moisture and nutrient values showed very small differences among the three communities (Tab. 2).
ii) How do environmental features infl uence species and coenological composition of plant communities? We recorded 209 species in the total set of relevés. The indicator species identifi ed by ISA for groups highlighted by MRT analysis, as well as their mean abundances, are shown in Tab. 3. The fi rst and second groups of the 3-leaved MRT included ten indicator species each; instead, the third was characterized by 17 indicator species. Bromus erectus
Huds. dominated group T3.1, which also showed a high cover value of Brachypodium rupestre (Host) Roem. &
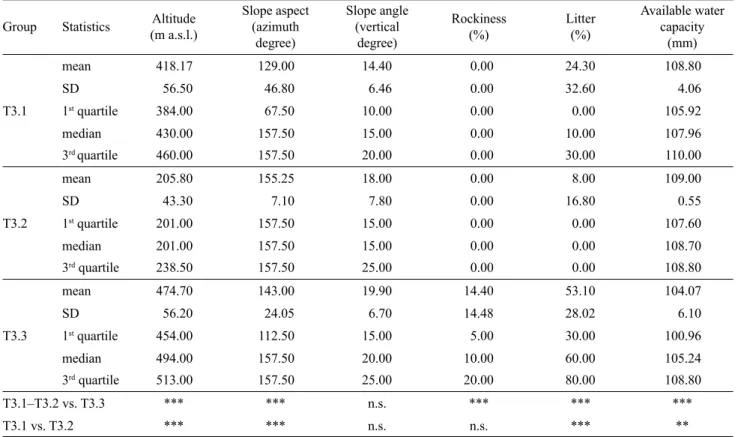
Tab. 1. Descriptive statistics of the environmental variables for the groups highlighted by the multivariate regression tree analysis (T3.1,
T3.2, and T3.3) and statistical signifi cance of differences, as indicated by the results of Wilcoxon exact rank test (2-tailed), between the groups segregated in the 3-leaved multivariate regression tree.Aspect azimuth was converted from the 0–360 compass scale to a linear scale, giving northerly aspect a value approaching 0 and southerly aspect a value approaching 180; then it was shifted to a minimum on north-north-east slopes (22.5°) and a maximum on south-south-west slopes (202.5°). SD – standard deviation. * P < 0.05; ** P < 0.01; *** P < 0.001; n.s. – not signifi cant.
Group Statistics (m a.s.l.)Altitude
Slope aspect (azimuth degree) Slope angle (vertical degree) Rockiness (%) Litter (%) Available water capacity (mm) T3.1 mean 418.17 129.00 14.40 0.00 24.30 108.80 SD 56.50 46.80 6.46 0.00 32.60 4.06 1st quartile 384.00 67.50 10.00 0.00 0.00 105.92 median 430.00 157.50 15.00 0.00 10.00 107.96 3rd quartile 460.00 157.50 20.00 0.00 30.00 110.00 T3.2 mean 205.80 155.25 18.00 0.00 8.00 109.00 SD 43.30 7.10 7.80 0.00 16.80 0.55 1st quartile 201.00 157.50 15.00 0.00 0.00 107.60 median 201.00 157.50 15.00 0.00 0.00 108.70 3rd quartile 238.50 157.50 25.00 0.00 0.00 108.80 T3.3 mean 474.70 143.00 19.90 14.40 53.10 104.07 SD 56.20 24.05 6.70 14.48 28.02 6.10 1st quartile 454.00 112.50 15.00 5.00 30.00 100.96 median 494.00 157.50 20.00 10.00 60.00 105.24 3rd quartile 513.00 157.50 25.00 20.00 80.00 108.80 T3.1–T3.2 vs. T3.3 *** *** n.s. *** *** *** T3.1 vs. T3.2 *** *** n.s. n.s. *** **
Fig. 3. Scatterplot of the detrended correspondence analysis
(DCA) ordination executed on mean randomized Ellenberg indi-cator values and relevés data set. Sites are represented with differ-ent symbols to highlight the groups iddiffer-entifi ed by multivariate re-gression tree analysis (circles – group T3.1; triangles – group T3.2; crosses – group T3.3). Only signifi cant vectors (P < 0.05) have been represented (T – air temperature; R – soil chemical re-action).
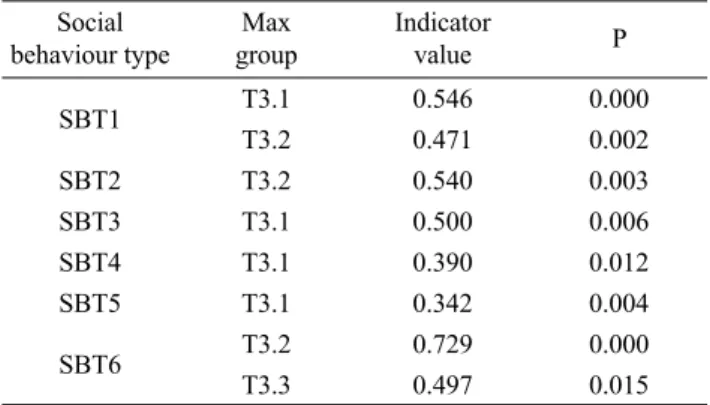
Schult. The T3.2 group had higher values of Avena sterilis L. and Triticum ovatum (L.) Raspail, while Bromus erectus and Sulla coronaria (L.) Medik. dominated group T3.3 (Tab. 3, On-line Suppl. Tab. 1). ISA identifi ed several coe-nological differences among groups (Tab. 4). SBT1, 3, 4, and 5 were indicators of the T3.1 community. SBT1, 2, and 6 were indicators of T3.2 community. SBT6 was indicator of T3.3 community (Tab. 4). The abundance (cover per-centage) of each SBT with respect to the total cover value in the three groups is shown in Tab. 5.
Discussion
i) Plant community composition and site ecology
MRT analysis highlighted three main plant communi-ties, linked to different environmental conditions (Fig. 2, Tabs. 1–2). This is consistent with previous research, which showed that in the sub-Mediterranean climate, landforms are key factors in determining plant species and communi-ties distribution (Arévalo et al. 2012, Burrascano et al. 2013, Catorci et al. 2014b). In fact, sub-Mediterranean re-gions are characterised by summer drought stress with dif-ferent intensities, depending on the elevation and landform factors (Somot et al. 2008). The main ecological factor be-hind these variables is the total solar radiation amount per unit area (Biondi et al. 2011). On south-facing slopes, the greater radiation in summer dramatically reduces the soil water content (Joffre and Rambal 1993), posing one more stress factor faced by plants in mountain areas (Catorci et al. 2014b). Landforms affect soil features (i.e. soil depth) as well (Cerdà et al. 1995). In detail, the T3.1 cluster grouped plots located on moderately steep slopes with southerly as-pects (from east to west) (Tab. 1) and is dominated by com-petitive caespitose species, i.e. Bromus erectus (occurring in about 96% of plots with mean cover of 40.4%) and
Brachypodium rupestre (occurring in 77.8% of plots with
mean cover of about 23%). This community spreads in con-ditions that are not very dry, as highlighted by the lowest temperature EIV and the slightly higher AWC values (Tabs. 1–2). It is also noteworthy that the T3.1 group was posi-tively correlated with soil reaction EIV and characterized by a mean value greater than the T3.2 and T3.3 groups, namely by the most basic pH among the considered clusters (Tab. 2, Fig. 3). In accordance with Catorci and Gatti (2010), these conditions allow the spread of species of SBT1 and
SBT3 (Tab. 4), indicating the affi nity of these plant com-munities with the sub-Mediterranean grasslands of the
Fes-Tab. 2. Mean and median Ellenberg indicator values (EIVs) for
air temperature, soil moisture, soil reaction, and soil nutrients of each group (T3.1, T3.2, and T3.3) emerging from the multivariate regression tree analysis.
Ellenberg indicator values
Group
T3.1 T3.2 T3.3
mean median mean median mean median air temperature 5.98 5.68 7.72 7.67 6.92 6.93 soil moisture 3.58 3.44 3.45 3.56 3.47 3.46 soil reaction 7.05 7.28 5.64 5.67 5.68 5.75 soil nutrients 3.75 3.68 3.73 3.62 3.54 3.52
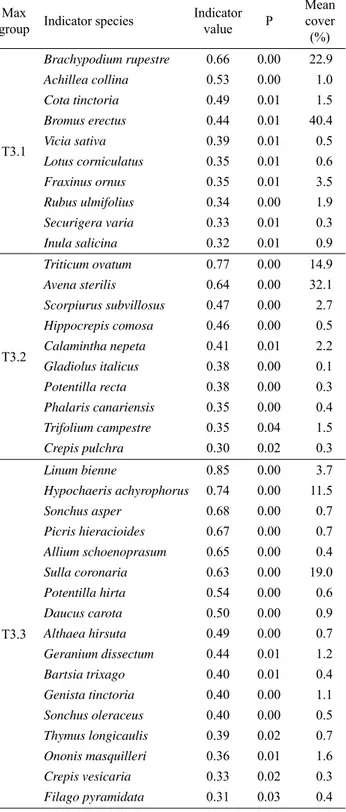
Tab. 3. Indicator species of the relevé groups highlighted by
indi-cator species analysis for the 3-leaved multivariate regression tree and their respective indicator values (calculated by multiplying the relative abundance and the relative frequency of species in a group) and mean cover percentages, as highlighted by the indica-tor species analysis. Only signifi cant indicaindica-tor values (P < 0.05) higher than 30 are shown. Max group: group with maximum indi-cator value; P: proportion of indiindi-cator values obtained by random-ized trials, equal to or exceeding the observed indicator value. The statistical signifi cance (P) of the observed maximum indicator val-ues was tested using permutation tests with 4,999 iterations.
Max
group Indicator species
Indicator value P Mean cover (%) T3.1 Brachypodium rupestre 0.66 0.00 22.9 Achillea collina 0.53 0.00 1.0 Cota tinctoria 0.49 0.01 1.5 Bromus erectus 0.44 0.01 40.4 Vicia sativa 0.39 0.01 0.5 L otus corniculatus 0.35 0.01 0.6 Fraxinus ornus 0.35 0.01 3.5 Rubus ulmifolius 0.34 0.00 1.9 Securigera varia 0.33 0.01 0.3 Inula salicina 0.32 0.01 0.9 T3.2 Triticum ovatum 0.77 0.00 14.9 Avena sterilis 0.64 0.00 32.1 Scorpiurus subvillosus 0.47 0.00 2.7 Hippocrepis comosa 0.46 0.00 0.5 Calamintha nepeta 0.41 0.01 2.2 Gladiolus italicus 0.38 0.00 0.1 Potentilla recta 0.38 0.00 0.3 Phalaris canariensis 0.35 0.00 0.4 Trifolium campestre 0.35 0.04 1.5 Crepis pulchra 0.30 0.02 0.3 T3.3 Linum bienne 0.85 0.00 3.7 Hypochaeris achyrophorus 0.74 0.00 11.5 Sonchus asper 0.68 0.00 0.7 Picris hieracioides 0.67 0.00 0.7 Allium schoenoprasum 0.65 0.00 0.4 Sulla coronaria 0.63 0.00 19.0 Potentilla hirta 0.54 0.00 0.6 Daucus carota 0.50 0.00 0.9 Althaea hirsuta 0.49 0.00 0.7 Geranium dissectum 0.44 0.01 1.2 Bartsia trixago 0.40 0.01 0.4 Genista tinctoria 0.40 0.00 1.1 Sonchus oleraceus 0.40 0.00 0.5 Thymus longicaulis 0.39 0.02 0.7 Ononis masquilleri 0.36 0.01 1.6 Crepis vesicaria 0.33 0.02 0.3 Filago pyramidata 0.31 0.03 0.4
tuco-Brometea class (see Biondi and Galdenzi 2012),
re-ferred to the habitat »Semi-natural dry grasslands and scrubland facies on calcareous substrates
(Festuco-Bromet-alia)« (habitat code 6210, important orchid sites)].
Accord-ing to the Italian interpretation manual of the 92/43/EEC Directive habitats (Biondi et al. 2009), this habitat includes perennial species-rich secondary grasslands dominated by hemicryptophytic grasses, from xeric to semi-mesophylous, mainly spread along the Apennine ridge. In the study case, however, as postulated by Grime (2001), the absence of dis-turbance allows a relatively high litter cover value (Tab. 1). Likewise, as stated by Bonanomi et al. (2013), the lack of disturbance enhances the spread of B. rupestre (Tab. 3, On-line Suppl. Tab. 1). This species is a dominant tall grass whose competitive success is related to its high tiller densi-ty and branching frequency (Pottier and Evette 2011), as
well as to its capacity for clonal growth and clonal integra-tion strategy (de Kroon and Bobbink 1997). These traits al-low a rapid spread in the absence of disturbance, especially in productive conditions (Grime 2001). The invasion of
Brachypodium species has a strong impact on the species
composition of plant communities (Catorci et al. 2011a, b) and gives rise to the spread of fringe and successional spe-cies (Catorci et al. 2011a). Actually, SBT4 (spespe-cies of fringe habitat) and SBT5 (successional species) are indicators of the T3.1 group (Tab. 4). Vegetation of the T3.1 community is also undergoing dynamic processes, as indicated by the presence among the indicator species of successional spe-cies such as Fraxinus ornus L. and Rubus ulmifolius Schott (Tab. 3), potentially leading to the formation of woody communities and to the loss of open habitats. Plots of the T3.2 group are located at the lowest altitudes and on mark-edly south-facing slopes (Tab. 1). The most abundant and frequent species are Avena sterilis (mean cover 32.1%, oc-curring in 90.0% of plots), Triticum ovatum (mean cover 14.9%, in 90.0% of plots), and B. erectus (mean cover 12.6%, in 80.0% of plots) (see On-line Suppl. Tab. 1). This community was positively correlated with temperature EIV and showed its highest mean value (Tab. 2). These harsh conditions may explain why SBT2 (species of xeric, grass-lands) emerged as indicators. The indication of SBT6 (rud-eral species) as well as their great cover values (Tab. 5) is consistent with the indication by ISA (Tab. 4) of several species of croplands and abandoned fi elds (e.g. T. ovatum,
Phalaris canariensis L., A. sterilis, Crepis pulchra L., and Scorpiurus subvillosus L.). It indicates the incomplete
evo-lution of the considered communities towards the kind of semi-natural grasslands indicated in the EU Directive. In particular, this herbaceous community seems to have a po-tential affi nity for the *6220 habitat [Pseudo-steppe with grasses and annuals (Thero-Brachypodietea) because it hosts several species of the Tuberarietea guttatae class, even if the total cover value of SBT2 is not very high. The manual of interpretation of EU Habitats includes in this habitat Mediterranean and sub-Mediterranean xerophilous, mostly open, short-grass annual grasslands rich in thero-phytes and therophyte communities of oligotrophic soils on base-rich, often calcareous substrates. According to the Ital-ian interpretation manual of the 92/43/EEC Directive (Bi-ondi et al. 2009), this habitat encompasses vegetation types that differ considerably in physiognomy, fl oristic composi-tion, ecological and structural features, sometimes very valuable from a naturalistic viewpoint, but more often trivi-al and very common in Mediterranean sectors of Ittrivi-aly.
The T3.3 cluster includes undisturbed plots of the steep-est hilly southerly slopes, characterized by the highsteep-est rock-iness and litter cover, and the lowest AWC values (Tab. 1), as well as by low soil moisture EIVs. The most abundant and frequent species were Bromus erectus (mean cover 25.9%, occurring in 97.8% of relevés), Sulla coronaria (mean cover 19.5% in 95.6% of relevés), and Hypochaeris
achyrophorus L. (mean cover 11.8% in 93.3% of relevés).
The xerophilous group of indicator species such as Filago
pyramidata L., H. achyrophorus, Thymus longicaulis C.
Presl, and Potentilla hirta L. (Tab. 3) suggests the presence of patches with shallow soils. On the other hand, the
indica-Tab. 4. Indicator social behaviour types (SBTs) of the relevés
groups (T3.1, T3.2, and T3.3) calculated by multiplying the rela-tive abundance and the relarela-tive frequency of SBTs in a group, highlighted by Indicator species analysis for the 3-leaved multi-variate regression tree. Only signifi cant (P < 0.05) indicator values higher than 30 are shown. SBT1 – species characteristic of peren-nial pastures; SBT2 – species of xeric grasslands; SBT3 – species of meadows; SBT4 – species of fringe habitats; SBT5 – succes-sional species; SBT6 – ruderal species. Max group: group with maximum indicator value; P – proportion of indicator values ob-tained by randomized trials, equal to or exceeding the observed indicator value. The statistical signifi cance of the observed maxi-mum indicator values was tested using permutation tests with 4,999 iterations. Social behaviour type Max group Indicator value P SBT1 T3.1 0.546 0.000 T3.2 0.471 0.002 SBT2 T3.2 0.540 0.003 SBT3 T3.1 0.500 0.006 SBT4 T3.1 0.390 0.012 SBT5 T3.1 0.342 0.004 SBT6 T3.2 0.729 0.000 T3.3 0.497 0.015
Tab. 5. Percent abundance of each social behavior type (SBT) in
each group of relevés (T3.1, T3.2, T3.3) highlighted by the multi-variate regression tree analysis. SBT1 – species characteristic of perennial pastures; SBT2 – species of xeric grasslands; SBT3 – species of meadows; SBT4 – species of fringe habitats; SBT5 – successional species; SBT6 – ruderal species.
Social behaviour type Group T3.1 T3.2 T3.3 SBT1 62.7 18.6 28.3 SBT2 6.3 20.7 16.7 SBT3 3.7 1.9 1.4 SBT4 1.4 0.7 0.6 SBT5 10.2 6.2 5.4 SBT6 15.7 51.9 47.6
tion by ISA of Sulla coronaria, Sonchus asper (L.) Hill, S.
oleraceus L., Geranium dissectum L., Crepis vesicaria L., Daucus carota L., as well as of SBT6 (pioneer, ruderal,
ni-trophilous and semi-nini-trophilous species) (Tabs. 3–4), high-lights both the past use of these areas as croplands and the absence of disturbance, suggested also by the highest litter cover value (Grime 2001). In fact, the abundance of these species is reduced by both grazing and mowing (Grime 2001). Moreover, litter can infl uence the processes of spe-cies assemblage within plant communities (Catorci et al. 2011b), reducing seed germination, establishment of indi-viduals (Eriksson 1995) and growth of established plants (Facelli and Pickett 1991). On the other hand, the low cover value of dominant tall grasses (Tab. 3) such as
Brachypodi-um rupestre, usually fostered by abandonment, may be due
to the harsh condition of sites (Vitasović Kosić et al. 2011). The spread of geophytes, such as orchids (i.e. Anacamptis
pyramidalis (L.) Rich., Orchis morio L., O. coriophora L.),
as well as the relatively high cover value of SBT1 (28%) and of SBT2 (17%) that are typical of semi-natural dry grasslands belonging to the Scorzonero-Chrysopogonetalia (Brometalia erecti) order and the Festuco-Brometea class (Biondi and Galdenzi 2012), suggests the existence of eco-logical conditions that potentially could lead to xeric
Bro-mus erectus-dominated community (which could be
re-ferred to the 6210 habitat). Finally, the not negligible cover value of successional species (SBT5 – 5–6%) in the T3.2 and T3.3 groups indicates the presence of dynamic process-es leading to forprocess-est recovery and, therefore, the future loss of these open habitats.
ii) Conservation status of plant communities and manage-ment implications
The three communities highlighted by MRT analysis showed a different contribution of SBTs to the species pool (Tab. 5). It also emerged that after fi eld abandonment, dif-ferent environmental conditions drive the dynamic process-es towards herbaceous communitiprocess-es that are likely to de-velop into EU habitats. However, in only one community (T3.1) did we observe a fl oristic composition clearly domi-nated by species of permanent pastures (namely, SBT1) as happens in the semi-natural dry grasslands of the Italian peninsula. In fact, in these communities the average cover value of Festuco-Brometea and/or
Molinio-Arrhenathere-tea species generally exceeds 70% (see Biondi et al. 2005).
In the other groups (T3.2 and T3.3), species of semi-natural grasslands had a lower mean cover value (ranging from 41 to 46%), with a conspicuous contribution (17–21%) to the total abundance of species belonging to Tuberarietea
gut-tatae and Sedo-Scleranthetea classes, especially in cluster
T3.2, while species of Artemisietea vulgaris and
Stellarie-tea mediae classes had a cover ranging from 48 to 52%. As
a matter of fact, only grasslands of the T3.1 and T3.3 groups seem to have the potential to develop into dry grasslands belonging to the Festuco-Brometea class (6210 habitat), with inclusions, in grasslands belonging to the T3.3 group, of patches of the Tuberarietea guttatae class (6220 habitat). However, an open issue is the assessment of their degree of representativeness in comparison with the standards de-fi ned by the Italian manual of interpretation of EU habitats (Biondi et al. 2009). In fact, the studied grasslands spread
on non-calcareous substrates instead of on limestone. On the other hand, it should be considered that pH values are quite neutro-basic, as indicated by the manual of interpreta-tion.With regard to the plant community of the T3.2 group, it is diffi cult to evaluate its representativeness with respect to aspects of greater conservation interest of the 6220 habi-tat. We found that the abundance of SBT 4, 5 and 6 (encom-passing species of fringe habitat, successional species, and pioneer, ruderal, nitrophilous and semi-nitrophilous spe-cies, respectively) is still high in any condition. Time after abandonment is considered a key issue in recovery of semi-natural grassland (Pywell et al. 2002, Ruprecht 2006), but probably these species (generally tall plants with ruderal-like ecological needs) are also able to persist in abandoned fi elds due to the absence of disturbance (Grime 2001).This means that the herbaceous plant communities considered fail to meet the fl oristic standards needed to ascribe them to the habitat sensu the 92/43/EEC Directive. Because of this, we can argue that the achievement of a favourable conser-vation status requires careful and deliberate management plans. In particular, sheep or cows should graze on grass-lands belonging to the T3.3 group during the late spring and summer periods to reduce the abundance of dominant tall plants and enhance that of species with avoidance and toler-ance strategies, which are species of the Festuco-Brometea class (Grime 2001). Sheep, in particular, are known as dis-persal vectors for most of the species of the
Festuco-Brom-etea class (Fischer et al. 1995), and thus they can facilitate
the processes related to species spread in managed grass-lands (Kaligarič et al. 2006). Grassgrass-lands of the T3.1 and T3.2 groups should be mown once a year in early summer, since late mowing allows the conservation of the maximum species richness (Catorci et al. 2014a). Moreover, fresh phytomass should be removed to avoid litter deposition and summer grazing can be useful to achieve a higher level of representativeness.
In conclusion, we found that the environmental factors driving the species assemblage in the sub-Mediterranean hilly landscape of the Tuscan-Emilian Apennines after crop abandonment are linked to topographic (rockiness and alti-tude) and soil (pH and AWC) conditions, which mainly de-termine the intensity and duration of water scarcity. More-over, our results indicated that not all former croplands, notwithstanding their having undergone the same land use history, have the potential to achieve a high representative status of the EU Directive habitats (sometime because of unsuitable soil pH) and that long-term abandonment of croplands does not lead per se to the recovery of the semi-natural herb communities of the EU Habitats Directive in sub-Mediterranean climate. In line with Smith et al. (2000), the main reason of such a result may be found in the lack of appropriate disturbance regimes. The absence of distur-bance has a further double effect. It allows the spread of woody successional species (shrubs and pioneer trees) and thus leads to forest recovery as well as the permanence of plants with ruderal-like ecological needs. Likewise, the ab-sence of disturbance allows the spread of competitive spe-cies which, in turn, reduces the site suitability for non-dom-inant herbaceous plants (such as small-sized and early fl owering species – Grime 2001), which are key elements
of the grasslands referred to the 6210 priority habitat pro-tected by the 92/43/EEC Directive. Moreover, the spread of competitive grasses (i.e. Brachypodium rupestre) fosters the presence of elements, such as fringe species, that are not characteristic of semi-natural disturbed grasslands (Catorci et al. 2011a). Finally, we can assert that the use of phytoso-ciologically determined SBT of species is a very useful tool in understanding the conservation status of herbaceous communities undergoing successional processes along the continuum from cultural to natural, thus helping to solve a major problem in the EU Directive and habitat
interpreta-tion. Moreover, it gives information on the type of manage-ment required in order to achieve a better conservation sta-tus of habitats.
Acknowledgements
The authors wish to thank the Department of Agricul-tural Science of Bologna University for analysis on soils samples and Sheila Beatty for editing the English of the manuscript.
References
Alard, D., Poudevigne, I., 2000: Diversity patterns in grasslands along a landscape gradient in northwestern France. Journal of Vegetation Science 11, 287–294.
Arévalo, J. R., Cortés-Selva, F., Chiarucci, A., 2012: Ecological de-terminants of species composition in the forest vegetation of Tuscany (Italy). Plant Ecology and Evolution 145, 323–331. Armiraglio, S., Cerabolini, B., Gandellini, F., Gandini, P., Andreis,
C., 2003: Computerized calculation of the soil water balance (Italian). Natura Bresciana, Annals of Natural Science Civic Museum 33, 209–216.
Biondi, E., 2011: Phytosociology today: Methodological and con-ceptual evolution. Plant Biosystems 145, 19–29.
Biondi, E., Blasi, C., Burrascano, S., Casavecchia, S., Copiz, R., Del Vico, E., Galdenzi, D., Gigante, D., Lasen, C., Spampinato, G., Venanzoni, R., Zivkovic, L., 2009: Italian interpretation manual of the 92/43/EEC Habitats Directive. Ministero dell’Ambiente e della Tutela del Territorio e del Mare. Retrieved January 15, 2015 from http://vnr.unipg.it/habitat/index.jsp
Biondi, E., Casavecchia, S., Pesaresi, S., 2011: Phytosociological synrelevés and plant landscape mapping: From theory to prac-tice. Plant Biosystems 145, 261–273.
Biondi, E., Galdenzi, D., 2012: Phytosociological analysis of the grasslands of Montagna dei Fiori (central Italy) and syntaxo-nomic review of the class Festuco-Brometea in the Apennines. Plant Sociology 49, 91–112.
Biondi, E., Allegrezza, M., Casavecchia, S., Galdenzi, D., Gas-parri, R., Pesaresi, S., Blasi, C., 2014: New and validated syn-taxa for the checklist of Italian vegetation. Plant Biosystems 148, 318–332.
Biondi, E., Pesaresi, S., 2004: The badland vegetation of the north-ern-central Apennines (Italy). Fitosociologia 41, 155–170. Biondi, E., Allegrezza, M., Zuccarello, V., 2005: Syntaxonomic
revision of the Apennine grasslands belonging to Brometalia
erecti, and an analysis of their relationships with the
xerophi-lous vegetation of Rosmarinetea offi cinalis (Italy). Phytocoe-nologia 35, 129–164.
Blasi, C., 2010: Vegetation of Italy with map of vegetation series in scale 1:500.000 (Italian). Palombi Editori, Roma.
Bonanomi, G., Incerti, G., Allegrezza, M., 2013: Assessing the impact of land abandonment, nitrogen enrichment and fairy-ring fungi on plant diversity of Mediterranean grasslands. Bi-odiversity and Conservation 22, 2285–2304.
Borhidi, A., 1995: Social behaviour types, the naturalness and rel-ative ecological indicator values of the higher plants in the Hungarian fl ora. Acta Botanica Hungarica 39, 97–181. Bruun, H. H., Fritzbøger, B., 2002: The past impact of livestock
husbandry on dispersal of plant seeds in the landscape of Den-mark. Ambio 31, 425–431.
Burrascano, S., Anzellotti, I., Carli, E., Del Vico, E., Facioni, L., Pretto, F., Sabatini F. M., Tilia A., Blasi, C., 2013: Drivers of beta-diversity variation in Bromus erectus semi-natural dry grasslands. Applied Vegetation Science 16, 404–416.
Čarni, A., 2005: Trifolio-Geranietea vegetations in south and southeast Europe, Acta Botanica Gallica 152, 483–496. Catorci, A., Cesaretti, S., Gatti, R., Ottaviani, G., 2011b: Abiotic
and biotic changes due to spread of Brachypodium genuense (DC.) Roem. & Schult. in sub-Mediterranean meadows. Com-munity Ecology 12, 117–125.
Catorci, A., Cesaretti, S., Gatti, R., Tardella, F. M., 2012: Trait-re-lated fl owering patterns in submediterranean mountain me-adows. Plant Ecology 213, 1315–1328.
Catorci, A., Cesaretti, S., Malatesta, L., Tardella, F. M., 2014a: Ef-fects of grazing vs mowing on the functional diversity of sub-Mediterranean productive grasslands. Applied Vegetation Sci-ence 17, 658–669.
Catorci, A., Gatti, R., 2010: Floristic composition and spatial dis-tribution assessment of mountain mesophilous grasslands in central Apennines, Italy: a multi-scale and diachronic ap-proach. Plant Biosystems 144, 793–804.
Catorci, A., Ottaviani, G., Cesaretti, S., 2011a: Functional and coenological changes under different long-term management conditions in Apennine meadows (central Italy). Phytocoeno-logia 41, 45–58.
Catorci, A., Piermarteri, K., Tardella, F. M., 2014b: Pedo-climatic and land use preferences of Gentiana lutea subsp. lutea in central Italy. Plant Ecology and Evolution 147, 176–186. Cerdà, A., Immeson, A. C., Calvo, A., 1995: Fire and aspect
in-duced differences on the erodibility and hydrogeology of soils at La Costera, Valencia, southeast Spain. Catena 24, 289–304. Conti, F., Abbate, G., Alessandrini, A., Blasi, C., 2005: An annotated
checklist of the Italian vascular fl ora. Palombi Editori, Roma. Cramer, V. A., Hobbs, R. J., Standish, R. J., 2008: What’s new
about old fi elds? Land abandonment and ecosystem assembly. Trends in Ecology and Evolution, 23, 104–112.
de Bello, F., Lepš, J., Sebastiá, M. T., 2007: Grazing effect on spe-cies and functional diversity along a climatic gradient. Journal of Vegetation Science 18, 25–34
de Kroon, H., Bobbink, R., 1997: Clonal plant dominance under elevated nitrogen deposition, with special reference to
Brachy-podium pinnatum in chalk grassland. In: de Kroon, H., Van
Groenendael, J. (eds.) The ecology and evolution of clonal plants, 359–379. Backhuys Publishers, Leiden.
De’ath, G., 2002: Multivariate regression trees: a new technique for modeling species-environment relationships. Ecology 83, 1105–1117.
Dufrêne, M., Legendre, P., 1997: Species assemblages and indica-tor species: the need for a fl exible asymmetrical approach. Ecological Monographs 67, 345–366.
Ejrnæs, R., Bruun, H. H., Aude, E., Buchwald, E., 2004: Develop-ing a classifi er for the habitats directive grassland types in Denmark using species lists for prediction. Applied Vegetation Science 7, 71–80.
Ejrnæs, R., Liira, J., Poulsen, R. S., Nygaard, B., 2008: When has an abandoned fi eld become a semi-natural grassland or heath-land? Environmental Management 42, 707–716.
Eriksson, O., 1995: Seedling recruitment in deciduous forest herbs: the effects of litter, soil chemistry and seed bank. Flora 190, 65–70.
Facelli, J. M., Pickett, S. T. A., 1991: Plant litter: its dynamics and effects on plant community structure. Botanical Review 57, 1–32.
Fischer, S., Poschlod, P., Beinlich, B., 1995: The importance of transhumance for the exchange of species between isolated sheep pastures (German). Veröffentlichungen der Landesstelle für Naturschutz und Landschaftspfl ege Baden-Württemberg 83, 229–256.
Gibson, C. W. D., Brown, V. K., 1992: Grazing and vegetation change defl ected or modifi ed succession. Journal of Applied Ecology 29, 120–131.
Godefroid, S., Dana, E. D., 2007: Can Ellenberg’s indicator values for Mediterranean plants be used outside their region of defi -nition? Journal of Biogeography 34, 62–68.
Gondard, H., Romane, F., Ignacio Santa, R., Leonardi, S., 2006: Forest management and plant species diversity in chestnut stands of three Mediterranean areas. Biodiversity Conservation 15, 1129–1142 Grime, J. P., 2001: Plant strategies, vegetation processes and
eco-system properties, 2, Wiley & Sons Ltd, Chichester.
Guarino, R., Domina, G., Pignatti, S., 2012: Ellenberg’s indicator values for the fl ora of Italy fi rst update: Pteridophyta,
Gymno-spermae and Monocotyledoneae. Flora Mediterranea 22, 197–
209.
Joffre, R., Rambal, S., 1993: How tree cover infl uences the water balance of Mediterranean rangelands. Ecological Society of America 74, 570–582.
Kaligarič, M., Culiberg, M., Kramberger, B., 2006: Recent vegeta-tion history of the North Adriatic grasslands: expansion and de-cay of an anthropogenic habitat. Folia Geobotanica 41, 241–258. Klaus, V. H., Kleinebecker, T., Boch, S., Müller, J., Socher, S. A.,
Prati, D., Fischer, M., Hölzel, N., 2012: NIRS meets Ellen-berg’s indicator values: prediction of moisture and nitrogen val-ues of agricultural grassland vegetation by means of near-infra-red spectral characteristics. Ecological Indicators 14, 82–86. Kramberger, B., Kaligarič, M., 2008: Semi-natural grasslands: the
effects of cutting frequency on long-term changes of fl oristic composition. Polish journal of Ecology 56, 33–43.
Legendre, P., Gallagher, E., 2001: Ecologically meaningful trans-formations for ordination of species data. Oecologia 129, 271–280.
McCollin, D., Moore, L., Sparks, T., 2000: The fl ora of a cultural landscape: environmental determinants of change revealed using archival sources. Biological Conservation 92, 249–263. McRae, S. G., 1991: Soil science practice. How to study the soil in the
fi eld (Italian) Zanichelli, Bologna.
Moola, F. M., Vasseur, L., 2004: Recovery of late-seral vascular plants in a chronosequence of post-clearcut forest stands in coastal Nova Scotia, Canada. Plant Ecology 172, 183–197. Peco, B., Sánchez, A. M., Azcárate, F. M., 2006: Abandonment in
grazing systems: Consequences for vegetation and soil. Agri-culture Ecosystems and Environment 113, 284–294.
Peroni, P., Ferri, F., Avena, G. C., 2000: Temporal and spatial changes in a mountainous area of central Italy. Journal of Veg-etation Science 11, 505–514.
Pesaresi, S., Galdenzi, D., Biondi, E., Casavecchia, S., 2014: Bio-climate of Italy: application of the worldwide bioclimatic clas-sifi cation system. Journal of Maps 10, 538–553.
Pignatti, S., 2005: Bioindication values of vascular plants of Italy (Ital-ian). Braun- Blanquetia 39, 1–97.
Piussi, P., Pettenella D., 2000: Spontaneous afforestation of fal-lows in Italy. In: Weber, N. (ed.), NEWFOR – New forests for Europe: afforestation at the turn of the century. EFI Proceed-ings 35, Freiburg, Germany, 151–163.
Poschlod, P, WallisDeVries, M. F., 2002: The historical and socio-economic perspective of calcareous grasslands. Lessons learnt from the distant and recent past. Biological Conservation 104, 361–376.
Pottier, J., Evette, A., 2011: Spatial pattern and process at the plant neighbourhood scale: insights from communities dominated by the clonal grass Elymus repens (L.) Gould. Journal of Veg-etation Science 22, 973–982.
Pywell, R. F., Bullock, J. M., Hopkins, A., Walker, K. J., Sparks, T. H., Burke, M. J. W., Peel, S., 2002: Restoration of species-rich grassland on arable land: assessing the limiting processes using a multisite experiment. Journal of Applied Ecology 39, 294–309.
R Core Team 2012: R: a language and environment for statistical com-puting. R foundation for statistical computing, Vienna, AT. Re-trieved September 15, 2012 from http://www.R-project.org Ribeiro, S., Ladero, M., Espirito-Santo, M. D., 2012: Floristic
com-position patterns of Mediterranean annual non-nitrophilous grasslands in Eastern Portugal. Plant Biosystems 146, 534–549. Rieger, E., 2000: The common agricultural policy. Policy-making in
the European Union 4, 179–210.
Robinson, R. A., Sutherland, W. J., 2002: Post-war changes in ar-able farming and biodiversity in Great Britain. Journal of Ap-plied Ecology 39, 157–176.
Rounsevell, M. D. A., Ewert, F., Reginster, I., Leemans, R., Cart-er, T. R., 2005: Future scenarios of European agricultural land use: II. Projecting changes in cropland and grassland. Agricul-ture, Ecosystems and Environment 107, 117–135.
Ruprecht E., 2006: Successfully recovered grassland: a promising example from Romanian old-fi elds. Restoration Ecology 14, 473–480.
Smith, R. S., Shiel, R. S., Millward, D., Corkhill, P., 2000: The interactive effects of management on the productivity and plant community structure of an upland meadow: an 8-year fi eld trial. Journal of Applied Ecology 37, 1029–1043. Somot, S., Sevault, F., Déqué, M., Crépon, M., 2008: 21st century
climate change scenario for the Mediterranean using a cou-pled atmosphere-ocean regional climate model.Global Planet Change 63, 112–126.
Stadler, J., Treffl ich, A., Brandl, R., Klotz, S., 2007: Spontaneous regeneration of dry grasslands on set-aside fi elds. Biodiversity and Conservation 16, 621–630.
Ubaldi, D., 2013: Vegetation and shrubs in Italy. Phytosociologi-cal types and ecology (Italian) Aracne Editrice.
Vitasović Kosić, I., Tardella, F. M., Ruščić, M., Catorci, A., 2011: Assessment of fl oristic diversity, functional composition and management strategy of North Adriatic pastoral landscape (Croatia). Polish Journal Ecology 59, 765–776.
Zelený, D., Schaffers, A. P., 2012: Too good to be true: pitfalls of using mean Ellenberg indicator values in vegetation analyses. Journal of Vegetation Science 23, 419–431.