TABLE OF CONTENTS
LIST OF PUBLICATIONS PRODUCED DURING PhD…………..………...iv
LIST OF FIGURES………...x
LIST OF TABLES………...…...xv
CHAPTER 1 Introduction
………..….1CHAPTER 2 The integrated assessment of the regional Air Quality
Management Plans through the Italian national model
2.1 Introduction……….………..72.2 National modelling system: the MINNI project………..……….8
2.3 Definition of Technical and Non-Technical Measures ………..……11
2.4 RAINS and NTMs in the Italian experience with Regional Air Quality Plans…………. 13
2.4.1 Scenario analysis ……….………..…13
2.2.4 Measures analysis………...15
2.5 Conclusions and future directions ………..20
References………..………...21
CHAPTER 3 Source Identification through Multivariate Receptor
Modelling
3.1 Introduction……….……263.2 Methodology……….…………..27
3.2.1 Sampling and Analytical Methods………...27
3.2.2 Multivariate Receptor Modelling…….. ……….………...28
3.2.2.1 Principal Component Analysis………..28
3.3 Results and Discussion………..………..29
3.3.1 Chemical composition………...…...…………..………….29
3.3.2 Meteorological influence……….………...33
3.3.3 Enrichment Factor analysis………..……...34
3.3.4 Source identification and apportionment………...36
3.3.4.1 Case Study #1: Rende (Urban site) …..………...………...36
ii
3.3.4.3 Case Study #3: Longobucco (Rural site)…..………...38
3.4 Conclusions……….………42
References………..………...43
CHAPTER 4 Natural Sources: Aerosol-Ozone variability at a Marine,
Urban and High Altitude monitoring stations in Southern Italy during
summer 2007
4.1 Introduction……….………474.2 Materials and Methodologies………..………48
4.2.1 Monitoring Sites description……….……….48
4.2.2 Sampling and Analysis Procedures ……….…..50
4.2.3 Data Analysis Treatment………....51
4.2.4 Methods applied for the identification of Saharan dust outbreaks in Calabria Region………...…52
4.3 Results and Discussion………....53
4.3.1 Overview on PM10 and O3 levels recorded during summer 2007………..53
4.3.2 Saharan Dust Outbreak influence on PM10 and O3 levels………..57
4.3.3 Biomass Burning events………...65
4.3.4 Air mass backward-trajectory analysis………...67
4.3.5 PM10 Exceedences evaluation………...70
4.4 Conclusions……….…72
References………..………...73
CHAPTER 5 Large Point Industrial Sources: a focus on mercury emissions
and concentrations
5.1 Contaminated Sites of National Interest (SIN) in Italy ……….………815.2 Mercury as a Hazardous Air Pollutant.………...84
5.3 Mercury in the Atmosphere………...………. ..85
5.3.1 Speciation and Chemistry.………85
5.3.2 Global Emissions Sources……...………...…...87
5.4 Mercury Emissions from Large Industrial Point Sources in Italy…….………88
5.5 Mercury Emission Control: Current Policies and Effect of Existing Technologies…...92
5.6 Mercury Measurements………...95
5.6.1 Experimental……….……….……...95
5.6.3 Comparison of Results to Previous Studies………...…...98
5.7 Conclusions……….….100
References………..……….101
CHAPTER 6 Air pollution over the Mediterranean Basin: observations
through six cruise campaigns on board the CNR Research Vessel URANIA
6.1 Introduction………...1056.2 Experimental Section………....107
6.3 Results and Discussions………....108
6.3.1 Overview of the data recorded………108
6.3.2 Aerosol-Ozone variation within Western and Eastern Mediterranean sectors.…..113
6.3.3 Observations along each single cruise campaign ………..….116
6.3.3.1 Urania Cruise Campaign 2003…...116
6.3.3.2 Urania Cruise Campaign 2004…...120
6.3.3.3 Urania Cruise Campaign 2005…...123
6.3.3.4 Urania Cruise Campaign 2006…...126
6.3.3.5 Urania Cruise Campaign 2007…...129
6.3.3.6 Urania Cruise Campaign 2009…...133
6.4 Conclusions……… ………..……134
References………..……….135
CHAPTER 7 Role of Atmospheric Pollution on Harmful Health Effects
7.1 Introduction………..1377.2 Air Pollution and Health ………..……….…...139
7.2.1 Modelling approach on health impact ………...…………..142
7.2.2 Indoor vs outdoor air pollution ………..………144
7.3 Inorganic Air Pollutants...144
7.3.1 Gaseous matter………144
7.3.2 Particulate Matter……...152
7.4 Future Perspectives and Developments ………..…....155
iv
LIST OF PUBLICATIONS PRODUCED DURING PhD
ISI ARTICLES
1. D’Elia I., Bencardino M., Ciancarella L., Contaldi M., Vialetto G., 2009. Technical
and Non Technical Measures for Air Pollution Emission Reduction: the Integrated Assessment of the Regional Air Quality Management Plans through the Italian National Model. Atmospheric Environment 43, 6182-6189. [IF= 3.139]
A summery of this paper, recognized by the European Commission as relevant for environmental policies, has been reported in "Science for Environment Policy": European Commission DG Environment News Alert Service, edited by SCU, The University of the West of England, Bristol.News Alert Issue 182, 28 January 2010. 2. Bencardino, M., Sprovieri, F., Cofone F., Pirrone, N. Variability of atmospheric
Aerosol and Ozone concentrations at a Marine, Urban and High Altitude monitoring stations in Southern Italy during the 2007 summer Saharan Dust outbreaks and Biomass Burning episodes. Submitted to Journal of Air & Waste Management Association [IF= 2.02] in July 2010 and currently in Revision. Referee comments
received in September 2010.
3. Sprovieri, F., Bencardino, M., Cofone F., Pirrone, N. Sources affecting the aerosol
concentration and composition in Southern Italy. Submitted to Journal of Air & Waste Management Association [IF= 2.02] in April 2010 and currently in Revision.
Referee comments received in August 2010.
NON-ISI ARTICLES
1. Bencardino M, Sprovieri F., Cofone F., Pirrone N. Chemical characterization and
source apportionment of airborne particulate matter in Southern Italy during summer 2007. Proceedings of the 15th International Conference on Heavy Metals in the Environment. 19-23 September 2010; Gdańsk, Poland. pp. 269-272 [ISBN:
978-83-928986-5-8].
2. Bencardino M, Cofone F., Manna G., Sprovieri F., Pirrone N. Spatial variation and
chemical composition of PM2.5-10 and PM2.5 across the Mediterranean basin during
Metals in the Environment. 19-23 September 2010; Gdańsk, Poland. pp. 273-276
[ISBN: 978-83-928986-5-8].
3. Pignatelli T, Bencardino M, Ciancarella L, D’Elia I, Racalbuto S, Vialetto G, Calori G., Contaldi M. Scenarios downscaling: qualitative comparison between
RAINS_Europe and RAINS_Italy, in the perspective. In: Anderssen RS, Braddock RD,
Newham LTH, editors. MODSIM09. Proceedings of the 18th World IMACS Congress and International Congress on Modelling and Simulation. 2009 Jul 13-17; Cairns,
Australia. 2009. pp. 2321-232. [ISBN: 978-0-9758400-7-8. http://www.mssanz.org.au/modsim09/F12/kragt.pdf].
4. Bencardino M., Vialetto G., D’Elia I., Calori G., Contardi C., Contaldi M., Sordi F., Radice P., Truffo G., Arduino G., Pittini T., Ciancarella L., Pignatelli T. Regional air
quality plans: assessment of plans efficacy through the use of integrated assessment modelling and other local models. In: Francis X.V., Khaiwal R., Chemel C., Newbold
J., Incecik S., Kahya C. and Sokhi R.S. editors, University of Hertforfshire, UK. Proceedings of the 7th International Conference on Air Quality-Science and
Application. Istanbul, 24-27 March 2009. pp. 764-767 [ISBN: 978-1-905313-64-8].
5. Pignatelli, T., D’Elia, I., Vialetto, G., Bencardino, M., Contaldi, M., 2008. The use of biomass: synergies and trade-offs between climate change and air pollution in Italy. Proceedings of the 17th International emission inventories conference. 2 – 5 June
2008, Portland, Oregon (USA).
6. Pignatelli T., Bencardino M., Contaldi M., Gracceva F., Vialetto G. Synergies
between energy efficiency measures and air pollution in Italy. In: Brebbia C.A. &
Longhurst J.W.S. editors, WIT press, UK. Proceedings of the Air Pollution 2009: 17th International conference on modelling, monitoring and management of air pollution, Skiathos, Greece, 20-22 September 2008. Vol.123, pp. 431-438. [doi: 10.2495/AIR090391, ISSN: 1743-3541].
vi BOOK CHAPTERS
1. A. Pietrodangelo, M. Bencardino, A. Cecinato, S. Decesari, C. Perrino, F. Sproviei, N. Pirrone and M.C. Facchini. Role of atmospheric pollution on harmful health effects. Contributo al Volume CNR Environment and Health Inter-departmental Project:
present knowledge and prospects for future research. Editor Fabrizio Bianchi,
Giuseppe Cavarretta, Liliana Cori. Publisher: Consiglio Nazionale delle Ricerche –
Roma © 2010, Consiglio Nazionale delle Ricerche [ISBN 978-88-8080-113-9].
PEER REVIEWED CONFERENCE PROCEEDINGS
1. Bencardino M., Sprovieri F., Manna G., Cofone F., Pirrone N. Identificazione delle
sorgenti di Emissione del Particolato Atmosferico mediante Applicazione dell’Analisi delle Componenti Principali. In proceedings of the PM 2008, 3rd National Conference on Particulate Matter. Il particolato atmosferico: la conoscenza per l’informazione e le strategie di intervento. 6-8 Ottobre 2008. Bari.
2. De Marco A., D’Elia I., Bencardino M., Screpanti A., Vialetto G. Risk assessment for
ozone and nitrogen impacts on forestall vegetation. In proceedings of the 23rd IUFRO Conference for Specialists in Air Pollution and Climate Change Effects on Forest Ecosystems, Murten, 7-12 September 2008.
3. De Marco A., D’Elia I., Bencardino M., Screpanti A., Vialetto, G. Efficacy of
different CO2 reduction policies and their impacts on ozone precursor emissions in
forestall environments. In proceedings of the 23rd IUFRO Conference for Specialists in Air Pollution and Climate Change Effects on Forest Ecosystems, Murten, 7-12
TECHNICAL REPORTS
1. Pignatelli T., Gracceva F., Vialetto G., Bencardino M. Valutazione dell’efficacia di
misure di risparmio energetico in termini di emissioni di inquinanti atmosferici e CO2.
Rapporto ENEA/ACS/2007*, pp.15.
2. Vialetto G., Ciancarella L., Racalbuto S., Pignatelli T., De Marco A., D’Elia I., Bencardino M. Scenari di emissione e di deposizione/concentrazione al suolo dei
principali inquinanti atmosferici finalizzati alla analisi e valutazione delle misure introdotte dalle Regioni in materia di qualità dell’aria. Rapporto ENEA/ACS/2007*, pp.7.
3. Racalbuto S., Bencardino M., D’Elia, I., Vialetto G., Contaldi, M. Scenari di
emissione e di deposizione/concentrazione di inquinanti atmosferici della Regione Valle d’Aosta. Rapporto ENEA/ACS/2007*, pp.22.
4. Bencardino M., Racalbuto S., Ciancarella, L.,Vialetto G., Contaldi, M. Scenari di
emissione e di deposizione/concentrazione di inquinanti atmosferici della Regione Marche. Rapporto ENEA/ACS/2007*, pp.24.
5. Bencardino M., Racalbuto S., Vialetto G., Contaldi, M. Scenari di emissione e di
deposizione/concentrazione di inquinanti atmosferici della Regione Abruzzo. Rapporto ENEA/ACS/2008*, pp.21.
6. Racalbuto S., Bencardino M., Ciancarella, L., Vialetto G., Contaldi, M. Scenari di
emissione e di deposizione/concentrazione di inquinanti atmosferici della Regione Emilia Romagna. Rapporto ENEA/ACS/2008*, pp.22.
7. Bencardino M., Vialetto G., Contaldi, M. Scenari di emissione e di
deposizione/concentrazione di inquinanti atmosferici della Regione Friuli Venezia Giulia. Rapporto ENEA/ACS/2008*, pp.22.
8. Bencardino M., Vialetto G., Contaldi, M. Scenari di emissione e di
deposizione/concentrazione di inquinanti atmosferici della Regione Calabria. Rapporto ENEA/ACS/2008*, pp.26.
9. Bencardino M., Vialetto G., Contaldi, M. Scenari di emissione e di
deposizione/concentrazione di inquinanti atmosferici della Regione Sicilia. Rapporto ENEA/ACS/2008*, pp.20.
10. Bencardino M., Vialetto G., Contaldi, M. Scenari di emissione e di
deposizione/concentrazione di inquinanti atmosferici della Regione Molise. Rapporto ENEA/ACS/2008*, pp.20.
viii
11. Bencardino M., Vialetto G., Contaldi, M. Scenari di emissione e di
deposizione/concentrazione di inquinanti atmosferici della Regione Basilicata. Rapporto ENEA/ACS/2008*, pp.20.
CONTRIBUTIONS WITHIN INTERNATIONAL TASK FORCES & NATIONAL AIR QUALITY EXPERT GROUP
1. Pignatelli, T., Bencardino, M., D’Elia, I., Vialetto, G., Racalbuto, S., Ciancarella, L., Contaldi, M., De Lauretis, R. New Italian Climate Policy Emission Scenarios for the
Gothenburg Protocol Revision Process. Task Force on Integrated Assessment Modelling (TFIAM), 35th meeting – NL EPA/PBL, Bilthoven, 8-10 June, 2009.
2. Vialetto, G., Racalbuto, S., Ciancarella, L., Bencardino, M., D’Elia, I., Contaldi, M., Pantaleoni, M. Nuovi scenari regionali: Da RAINS-Italia a GAINS-Italia. Seminario
ISPRA Esperti Inventari locali, Roma, 26 Maggio 2009.
3. D’Elia I., Bencardino M., Ciancarella L., Contaldi M., Vialetto G. Assessment with
the Italian national IAM of technical and non-technical measures in the Regional Air Quality Management Plans. NIAM - Network of Integrated Assessment Modelling,
Laxenburg, 23 Marzo 2009.
4. Pignatelli, T., Ciancarella, L., D’Elia, I., Bencardino, M. Integrated Assessment
Modelling: Applications at different scales. Air Quality assessment strategies: addressing the new Air Quality Directive and CAFE Thematic Strategy, JRC ISPRA,
17-18 November, 2008.
5. Ciancarella L., Bencardino M., D’Elia I. Il modello MINNI e la valutazione dei piani
regionali per il risanamento della qualità dell’aria . Ecomondo, Rimini 5 Novembre
2008.
6. Vialetto, G., Racalbuto, S., Ciancarella, L., Bencardino, M., D’Elia, I., Contaldi, M., Pantaleoni, M. Analisi dell’efficacia delle misure contenute nei piani regionali di
Qualità dell’Aria. Tavolo Tecnico Qualità dell’Aria MATTM – Regioni, Roma, 1
luglio 2008.
7. Pignatelli T., Bencardino M., D’Elia I., Vialetto G., Contaldi, M. Example of
Non-Technical measures assessment by RAINS-Italy: LTZ effects in 2 Italian regions. Task Force on Integrated Assessment Modelling (TFIAM), 34th session, 7-9 May 2008, School of Industrial Engineering, Technical University Madrid.
8. Zanini, G., Pignatelli, T., D’Elia, I., Bencardino, M., Pace, G., Vitali, L., Brusasca, G., Calori, G., Finardi, S., Radice, P., Silibello, C. The MINNI Project: National
Intagrated Assessment Modelling System for Policy Making, in Italy. NIAM - Network of Integrated Assessment Modelling, Laxenburg, 2-3 Aprile 2008.
9. Vialetto G., Racalbuto S., Ciancarella L., Bencardino M., D’Elia I., Contaldi M. Analisi degli
inventari regionali: principali differenze riscontrate. Seminario APAT Inventari locali,
x
LIST OF FIGURES
Figure
2.1 The simplified flow-chart of the MINNI national modelling system………...10
2.2 PM10 mass concentration (µg m-3) at target year 2010: a) CLE scenario; b) difference (µg m-3) between Air Quality Management Plan scenario and CLE
scenario………..14 2.3 Losses in average Life Expectancy (months) attributable to PM2.5 concentrations at 2010: a) CLE scenario; b) difference (months) between Air Quality Management Plan scenario and CLE scenario………..………..15 2.4 AQMP measure adoption frequency in regions, shown by the bars, and percentage contribution by measure to SO2, NOx and PM10 emission reductions, reported by the three plot lines………...17 2.5 SO2, NOx and PM10 emission reductions (in %) on regional sector emissions calculated
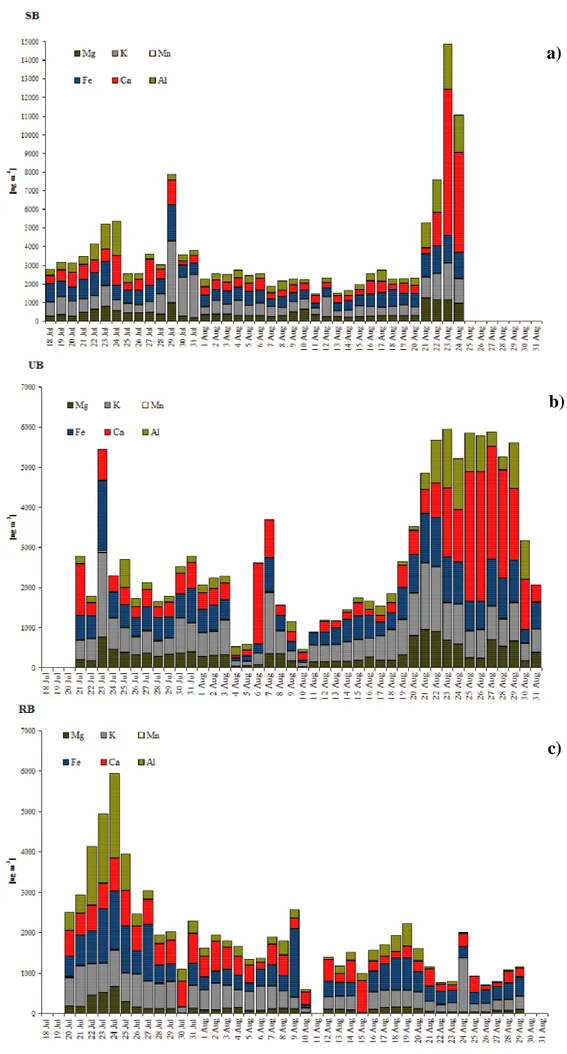
respect to the 2010 CLE scenario for 6 selected measures. The stacked bars, whose patterns represent a different administrative Region, show the sector emission reductions for each Region where the AQ measures were applied………...19 3.1 Time series of PM10 levels recorded at a Suburban, Urban and Rural Background sites………....30 3.2 Time series of crustal element levels recorded at: a) SB; b) UB and c) RB...…...31 3.3 Saharan dust outbreaks occurred over the southern Italy. On the left panels 5-days HYSPLIT backward trajectories are reported for the: a) 24th of July; c) 24th of August and e) 30th of August. On the right panels NAAPs based dust concentration maps for the: b) 24th of July; d) 24th of August and f) 30th of August are reported…..32
3.4 Sampling sites in Calabria region; inset wind direction distribution of PM10 average concentration at: a) Urban, b) Suburban and c) Rural Background sites………..33 3.5 a) Temperature, b) Wind Speed, c) Pressure and d) Relative Humidity behaviour observed at the Urban, Suburban and Rural Background monitoring stations……….…………..34 3.6 Enrichment Factors (EFs) of trace elements detected at SB, UB and RB site locations………….……….…………..35
3.7 Source profile for PM10 collected at the Urban site……….. 39
3.8 PM10 source apportionment of at the Urban site ………...……….. 39
3.9 Source profile for PM10 collected at the Suburban site………..…….. 40
3.10 PM10 source apportionment of at the Suburban site ……...…...……….. 40
3.11 Source profile for PM10 collected at the Rural site………….……...…..……..…….. 41
3.12 PM10 source apportionment of at the Rural site ………...…...……...………….. 41
4.1 Monitoring site locations: Suburban Background (SB), Urban Background (UB) and Rural Background (RB) sites……….………...49
4.2 Time series of PM10 levels recorded at: a) SB; b) UB and c) RB sites.……….………...56
4.3 Saharan dust outbreaks occurred over the southern Italy. On the left panels 5-days HYSPLIT backward trajectories are reported for the: a) 24th of July; c) 24th of August and e) 30th of August. On the right panels NCEP-based 700 mbar geopotential height (m) for the: b) 24th of July; d) 24th of August and f) 30th of August are reported………..59
4.4 Trajectory and Mixed Layer altitudes along the path followed by backward trajectory before their arrival at: a) SB; b) UB and c) RB sites, respectively on 30th of August………...61
4.5 Time series of PM10-O3 levels (left panels) and of T-RH values (right panels) for: a)-b) SB; c)-d) UB and e)-f) RB sites, respectively. Grey bars highlight the periods in which the identified SDO occurred……….………..62
4.6 Time series of PM10 and O3 levels recorded at: a) Firmo and b) Saracena rural sites…63 4.7 Daily total hot-spots fire (HSF) over Cosenza Province (Calabria Region), from the MODIS Rapid Response System-Web Fire Mapper (http://maps.geog.umd.edu). Dots represent the number of hot-spots fire singularly affecting each sampling site……....66
4.8 Cluster analysis based on the prevailing air mass trajectories and paths. Average values for PM10, O3, T and RH over each kind of influence (left panels) and occurrence frequencies of the identified air mass classes (right panels) are reported for: a)-b) SB; c)-d) UB and e)-f) RB sites, respectively………..69
4.9 Assessment of the net African dust load. Left panels report time series of PM10 concentrations along with the absolute dust load (black bars) calculated for days with SDO influence. Absolute and percent values of number of exceedances are showed on the right panels with and without Saharan dust contribution. Either graphs refer to: a) SB; b) UB and c) RB sites, respectively………...………..………..71
xii
5.2 Mercury emissions referring to each single IPPC facilities in Italy, 2002-2006……...90 5.3 Mercury emissions referring to IPPC activities as a whole, 2002-2006………91 5.4 Percentage variation (∆%) between 2006 and 2005 mercury emissions referring to each single IPPC facilities………...92 5.5 The R.V. Urania cruise paths during the 2004, 2005 and 2007 Mediterranean
oceanographic campaigns………96 5.6 TGM, RGM and Hg(p) measurements recorded during: a) 2004; b) 2005 and c) 2007 URANIA Cruise Campaign………...………..97 5.7 TGM comparison between values published in D. Gibičar et al., 2009 and those presented in this work. Data refer to winter and summer sampling periods……….98 5.8 Spatial distribution of RGM (left panels) and Hg(p) (right panels) concentrations
observed during: a) 2004-2007 and b)2005-2007 cruise campaigns performed onboard the CNR Research Vessel URANIA along the reported tracks………...99 6.1 Spatial distribution of PM10 concentrations observed during six cruise campaigns performed onboard the CNR Research Vessel URANIA along the reported tracks………...110 6.2 Time series of fine and coarse particle levels overlaid to a) PM2.5/PM10 ratio and b) daily O3 mean values referring to each cruise campaigns………..111 6.3 Descriptive statistics: mean (as a dots), Maximum and minimum (as the highest and lowest shaft) for a) fine and coarse particle; b) hourly O3 mean and Maximum O3 daily 8-hour mean and c) meteorological parameter values referring to each cruise campaign……….112 6.4 Time series of a) fine and coarse particle levels and b) Maximum O3 daily 8-hour mean
values referring to Western and Eastern Mediterranean sectors……….114 6.5 For a)Western; b) Eastern and c) the whole Mediterranean area, fine and coarse frequency distribution and relative contribution are reported in the left and right panels, respectively……….115 6.6 Spatial distribution of a) fine and b) coarse particle concentrations observed during the
2003 cruise campaign performed onboard the CNR Research Vessel URANIA along the reported track……….117 6.7 Time series of fine and coarse particle concentrations and ozone levels recorded during the 2003 cruise campaign………118
6.8 Hysplit and NAAPS-based maps showing: back-trajectories and ship position in the left panels, sulphate concentrations or optical depth in central panels and smoke or dust concentrations for a) 15th; b) 21st and c) 23rd August 2003, respectively……...119 6.9 Spatial distribution of a) fine and b) coarse particle concentrations observed during the 2004 cruise campaign performed onboard the CNR Research Vessel URANIA along the reported track……….120 6.10 Time series of fine and coarse particle concentrations and ozone levels recorded during the 2004 cruise campaign………121 6.11 Time series of Al, Cr, Cu, Mn, Ni, Pb, Sb and V concentrations associated to the aerosol particles during the 2004 cruise campaign. Distribution between fine and coarse size fraction is also reported………121 6.12 Hysplit and NAAPS-based maps showing: back-trajectories and ship position in the
left panels, smoke or sulphate concentrations in central panels and dust concentrations for a) 30th October; b) 4th and c) 9th November 2004, respectively……….122 6.13 Spatial distribution of a) fine and b) coarse particle concentrations observed during the 2005 cruise campaign performed onboard the CNR Research Vessel URANIA along the reported track……….123 6.14 Time series of fine and coarse particle concentrations and ozone levels recorded during the 2005 cruise campaign………124 6.15 Hysplit and NAAPS-based maps showing: back-trajectories and ship position in the left panels, sulphate concentrations in central panels and smoke concentrations for a) 18th; b) 20th and c) 23rd June 2005, respectively………125 6.16 Spatial distribution of a) fine and b) coarse particle concentrations observed during the 2006 cruise campaign performed onboard the CNR Research Vessel URANIA along the reported track……….126 6.17 Time series of fine and coarse particle concentrations and ozone levels recorded during the 2006 cruise campaign………127 6.18 Time series of Al, Cr, Cu, Mn, Ni, Pb, Sb and V concentrations associated to the aerosol particles during the 2005 cruise campaign. Distribution between fine and coarse size fraction is also reported………127 6.19 Hysplit and NAAPS-based maps showing: back-trajectories and ship position in the
left panels, sulphate concentrations in central panels and smoke concentrations for a) 7th; b) 14th and c) 19th July 2006, respectively……….128
xiv
6.20 Spatial distribution of a) fine and b) coarse particle concentrations observed during the 2007 cruise campaign performed onboard the CNR Research Vessel URANIA along the reported track……….129 6.21 Time series of fine and coarse particle concentrations and ozone levels recorded during the 2007 cruise campaign………130 6.22 Time series of Al, Cr, Cu, Mn, Ni, Pb, Sb and V concentrations associated to the aerosol particles during the 2007 cruise campaign. Distribution between fine and coarse size fraction is also reported……….………130 6.23 Hysplit and NAAPS-based maps showing: back-trajectories and ship position in the left panels, sulphate or dust concentrations in central panels and smoke concentrations for a) 12th; b) 17th and c) 28th September 2007, respectively………..131 6.24 Spatial distribution of a) fine and b) coarse particle concentrations observed during the
2009 cruise campaign performed onboard the CNR Research Vessel URANIA along the reported track……….132 6.25 Time series of fine and coarse particle concentrations and ozone levels recorded during the 2009 cruise campaign………133 6.26 Hysplit and NAAPS-based maps showing: back-trajectories and ship position in the left panels, optical depth or dust concentrations in central panels and sulphate or smoke concentrations for a) 15th; b) 17th and c) 24th June 2009, respectively……...134 7.1 Deposition probability of inhaled particles in the respiratory tract according to particle size……….141 7.2 Changes in EU life expectancy loss in 2000 and in the interim objective in 2020 (Strategy)………...143
LIST OF TABLES
Table
2.1 Technical and Non-Technical Measures adopted in the Italian Regional
AQMPs……...12
3.1 Statistical summary of PM10 and trace element mass concentrations at the three sampling sites………....30
3.2 Varimax rotated factor matrix for Urban site …..………... 39
3.3 Varimax rotated factor matrix for Suburban site …..………..…………... 40
3.4 Varimax rotated factor matrix for Rural site …..……….………... 41
4.1 Coordinates and monitoring station classification for each sampling site………50
4.2 Descriptive statistics for ozone levels.………...…57
4.3 Comparison of PM10, O3, T and RH explorative statistic values recorded during days with and without SDO. Percent variation (∆%) between mean values calculated over days with and without SDO is also reported………...64
5.1 List of the National Interest Rehabilitation Sites in Italy……….83
5.2 Toxic effects of Mercury as reported by the World Health Organisation (WHO, 2008)………...85
5.3 IPPC activity definition……….91
5.4 Median mercury removal efficiency (%) for some technologies and different categories (from (USEPA, 1997, 2002a,b; Wang et al., 2010))………93
1 he Mediterranean Basin still does suffer from the impact of anthropogenic pressures which lead to environmental degradation. Chemical pollution, maritime transport and climate change are key factors causing air quality degradation at both regional and local scales. On the other hand, air pollutant dynamics and distribution in the Mediterranean region are closely related to its unique geographical characteristics and specific weather conditions that favour the enhancement of air pollutant photochemical production and accumulation. Poor air quality within the Mediterranean Basin has effects on human health, ecosystem conditions and economic resources. Already existing measures to manage pressures have been proven inadequate and the EC proposed new policies and environmental legislation, both currently close to adoption. Owing to this context, the work developed during this PhD focuses over the Mediterranean region in order to investigate key pressure affecting Mediterranean regional air quality, to gain further insight into the atmospheric mechanisms leading to high air pollutant levels across the Mediterranean Basin and to describe the resulting trade-offs that will have to be dealt by management and policy. These overall goals have been achieved through the application of innovative modelling techniques as well as the assimilation and integration of monitoring-based data, with the supporting facilities of both ENEA (National Agency for New Technologies, Energy and Environment) – Casaccia Research Centre and CNR-IIA (Institute of Atmospheric Pollution Research of the Italian National Research Council) - Division of Rende (CS). The DPSIR (Driver-Pressure-State-Impacts-Response) conceptual framework has been followed in the PhD dissertation to highlight the several factors
CHAPTER 1
Introduction
T
influencing this complex study. The DPSIR model, adopted by the European Environmental Agency, is in fact useful in describing the relationships between the origins and consequences of environmental problems; furthermore, in order to understand their dynamics, it is also useful to focus on the links between DPSIR elements. In this way, the relationship between the Driving forces and the Pressure from the Italian economic activities as well as the effectiveness of some Responses, like the measures taken into account in the Italian Regional Air Quality Management Plans (AQMPs), were investigated through the RAINS-Italy model and within the convention between the Ministry of the Environment, Land and Sea (MATTM) and ENEA. As reported in Chapter 2, the application of the RAINS-Italy model, starting from the Italian official energy and production activities scenario and transmitted to the EU Commission for the Emission Trading National Allocation Plans, provided the related Current Legislation (CLE) emission scenarios of SO2, NOx, PM10, PM2.5, VOC and NH3. The effectiveness in air pollution emission reduction at the target year, 2010, of the Italian Regional AQMPs was then assessed comparing the Current Legislation (CLE) and an alternative scenario, which contains all the measures that the Regional administrations intend to adopt to preserve air quality within their territory. The efficacy of all AQMPs measures at 2010 was shown in terms of SO2, NOx and PM10 emissions avoided and PM10 concentration reductions together with the improvements of the health impact indicator, the Life Expectancy Reduction (LER), defined as months lost attributable to PM2.5 concentrations. The carried out analyses show that the Italian Regional AQMPs contain Technical and Non-Technical Measures especially in the energy, domestic and transport sectors both having a crucial role, although the normative compliance is not assured everywhere. The identification and quantification of the main natural and anthropogenic sources (Drivers) affecting air pollutant levels in the Southern Italy were, otherwise, carried out by refining a range of multivariate and linear modelling techniques for covariance and time series analysis (Chapter 3). Principal Component Analysis (PCA) statistical method was also applied to the available air pollutant levels in order to decouple the sample amounts into estimated source profiles and source contributions to each sample. The air quality assessment, representing the State of the air matrix within the DPSIR framework, was then carried out through observational measurements obtained from both land-based and over-water monitoring campaigns (Chapters 4, 5 and 6). The PhD dissertation specifically focuses on three priority pollutants: Particulate Matter (PM), Ozone (O3) photo-chemically produced and Mercury (Hg) that is long-lived in the atmosphere (from 6 months to 1 year on average) and thus representative of hemispheric/global pollutants which are subject to long-range transport. The air quality, in term of variations of the above mentioned air pollutant levels was furthermore evaluated in
3 relation to both natural and anthropogenic sources. Central-Southern Mediterranean Basin, especially in summertime, is heavily affected by natural sources, like Saharan dust outbreaks and wildfire events, therefore a focus on their influence on both oxidizing capacity of the atmosphere and air quality over Calabria region, southern Italy was addressed and presented in Chapter 4. During summer 2007 an intensive sampling campaigns on PM10 and O3 concentrations have been simultaneously performed at three monitoring stations of the CNR-IIA - Division of Rende, the Marine, Urban and High Altitude monitoring sites. The results obtained were then coupled with both backward trajectories analysis and satellite derived products which were useful to understand the aerosol sources and transport pathways. These crossed analysis permitted to register some Saharan dust intrusion, highlighting that a huge rise in PM10 levels with a concurrent decrease in O3 values usually characterized these transport events. According to the Air Quality Directive 2008/50/EC and skipping the obtained net dust load from the measured PM10 levels, a notably reduction in the number of daily excedancees was observed highlighting the large influence of this natural source over the air quality in the southern Mediterranean regions. Moreover, even if further analysis should be conducted to better evaluate the specific amount of O3 and PM10 concentrations directly due to wildfire emissions, the observations carried out suggest that during favourable weather conditions, the contribution of biomass fires on both tropospheric O3 and aerosol concentrations cannot be neglected during specific periods of summertime. The influence of anthropogenic sources was otherwise assessed in Chapter 5 focusing on the “ Large Industrial Point Sources” (regulated by the IPPC Directive 2008/1/EC) that refer to the major combustion plants, including chemicals production and steel plants, refineries and incinerators. Atmospheric mercury emissions from all IPPC activities located in Italy were checked on the INES (Inventario Nazionale delle Emissioni e delle loro Sorgenti) register. The results showed that the highest value of mercury emissions in air, ranging from 1062 to 1385 Kg yr-1, refers to the largest pig iron and steel facility in Europe (ILVA S.p.a) located in the city of Taranto, whereas the second contribution, in terms of absolute mercury emission values, comes from the refinery (SYNDIAL S.p.A. - ex EniChem S.p.A.) located at Augusta-Priolo city in Sicily. Moreover, it could be observed that within the mercury emissions related to all IPPC activity, the largest part (about 74%), come from those IPPC facilities whose involved area has been defined as a National Interest Rehabilitation Site (Law n. 426/1998 and Ministerial Decree 468/2001). Measurements of atmospheric mercury species were also performed across both the Tyrrhenian and the Adriatic sea aboard the Research Vessel (RV) Urania of the Italian CNR during three oceanographic campaigns within MEDOCEANOR project, in order to assess the spatial distribution and temporal variation of mercury species
concentrations in Marine Boundary Layer close to industrial contaminated sites. Two of these three cruise campaigns were performed across the Adriatic sea following the same route in different meteorological conditions during two seasons, autumn 2004 (27th of October to 12nd of November) and summer 2005 (17th to 29th of June) whereas the third one took place across the Tyrrhenian sea during 2007 (12nd of September to 1st of October). Furthermore, to gain more insight into the atmospheric mechanisms leading to high air pollutant levels across the Mediterranean Basin, the measurements performed duringsix cruise campaigns on board the CNR RV URANIA, from 2003 to 2009 and within the CNR MED-OCEANOR programme, were synthesized, integrated and then analysed in a coherent way (Chapter 6). Sampling periods of each of this six cruise campaigns refer to: summer 2003 (6 to 27 August); autumn 2004 (27 October to 12 November); summer 2005 (17 to 29 June); summer 2006 (5 to 20 July); autumn 2007 (12 September to 1 October) and summer 2009 (5 to 30 June). In the Mediterranean marine environment the maritime transport became a “hot” issue in the past decade for atmospheric research and air pollution and climate policy. Despite implications on both human health and radiative budget involve an increasing interest, data referring to air pollutants directly measured on the sea are yet relatively scarce. Owing to this context, the overview reported in Chapter 6 holds a relevant interest in that it fills in part the observation gaps over the Mediterranean basin. Specifically, for each oceanographic cruise campaigns performed on board the CNR RV URANIA, temporal and spatial variations of both fine (PM2.5) and coarse (PM2.5-10) particles concentrations along with ozone and meteorological parameters were examined. Elemental composition of both PM2.5 and PM2.5-10 were furthermore determined in order to identify specific tracers for different classes of particles that can be found in the Mediterranean atmosphere. Shipping emissions, representing both local harbours and maritime traffic across the basin, were also tested using the marker ratio of V and Ni, showing a quite large contribution to the total aerosol load. Variations of the two size range of inhalable particulate matter (PM2.5-10, PM2.5) over the eastern and western sector of the Mediterranean basin were also investigated in respect to source-receptor relationships. Finally, in Chapter 7, the role of atmospheric pollution on harmful health effects (Impacts) are investigated. Within the CNR Environment and Health Inter-departmental (PIAS) Project, recent findings on toxicity routes attributable to particulate and gaseous pollutants are reviewed. Toxicity routes are discussed as evidence or hypothetical relationships between sources, diffusion paths, receptor sites and susceptible populations. The body of knowledge which has received during the whole PhD activity was thus necessary and essential for the acquisition of a methodology which proved to be really suitable for the evaluation of complex problems relating to air pollution in the Mediterranean Basin. The results obtained during this
5 study give a valuable contribution to our current understanding of how and why regional air quality may change in the Mediterranean region and could provide important information for scientists and policy implications.
he Italian Air Quality legislation underwent sweeping changes with the implementation of the 1996 European Air Quality Framework Directive when the Italian administrative Regions were entrusted with air quality management tasks. The most recent Regional Air Quality Management Plans (AQMPs) highlighted the importance of Non-Technical Measures (NTMs), in addition to Technical Measures (TMs), in meeting environmental targets. The aim of the present work is to compile a list of all the TMs and NTMs taken into account in the Italian Regional AQMPs and give in the target year, 2010, an estimation of SO2, NOx and PM10 emission reductions, of PM10 concentration and of the health impact of PM2.5 concentrations in terms of Life Expectancy Reduction. In order to achieve this objective the RAINS-Italy, as part of the National Integrated Modeling system for International Negotiation on atmospheric pollution (MINNI), has been applied. The management of TMs and NTMs inside RAINS have often obliged both the introduction of exogenous driving force scenarios and the control strategy modification. This condition has inspired a revision of the many NTM definitions and a clear choice of the definition adopted. It was finally highlighted that only few TMs and NTMs implemented in the AQMPs represent effective measures in reaching the environmental targets.
CHAPTER 2
The integrated assessment of the regional Air
Quality Management Plans through the Italian
national model
T
7 2.1 Introduction
A new approach to air quality assessment was introduced in 1996 with the publication of the European Air Quality Framework Directive (EC,1996), which defined for the first time howair quality should be assessed and managed in the Member States. Together with the subsequently issued four daughter directives (EC, 1999, 2000, 2002, 2004), a common framework for the assessment and reporting of air quality was set, the pollutants for which air quality standards and objectives were to be considered in the legislation were specified. The new Directive 2008/50/EC on ambient air quality and cleaner air for Europe (EC, 2008) confirms substantially the planning and management approach to air quality, even introducing new limit values for PM2.5, the assessment of the contribution of natural sources and other new features. The Italian Air Quality legislation underwent sweeping changes through the Italian Government Decree no. 351 issued under Parliamentary Delegation on 1999 (Italian Government, 1999) to implement the European Directive 96/62/EC. The air pollution prevention, improvement and preservation have been assigned to the 20 Italian administrative Regions while the European Directive implementation remains at a national level. This institutional division implies the elaboration of different Regional Air Quality Management Plans (AQMPs), a fundamental phase of the entire assessment process, planning and management where air quality measures should be defined and adopted in order to meet established air quality targets. The most powerful tool to verify the compliance with those targets seems to be the integrated assessment models, and among them the RAINS model, already applied in many negotiation processes (RAINS, 2007). Many options are available to reduce emissions from the different sources and they can be generally divided into technical (e.g. end-of-pipe measures), structural (e.g. fuel switch) and behavioural measures. The RAINS-Italy model in its current version is restricted to the analysis of end-of-pipe measures, while behavioural measure evaluation is reflected through alternative exogenous scenarios of the driving forces (Amann et al., 2004). The Italian Regional AQMPs include both Technical and Non- Technical Measures and in this work their assessment have been carried out with the RAINS-Italy model comparing the Current LEgislation (CLE) and an alternative scenario, which contains all the measures the Regional administrations intend to adopt to preserve air quality in their territory. The CLE scenario is based on the assumptions that at the target year the air pollution laws and directives at European, national and local level have been applied. Translated into the RAINS model language, this assumption means that the CLE trends reflect an energy and non-energy activity level scenario and a control strategy which takes into account the technological abatement evolution expressed for each fuel/sector/technology as
implementation rate of the abatement technologies. The alternative scenario (AQP scenario) considers in addition the TMs and NTMs adopted by the Regions in the Air Quality Management Plan. To take into account the single measure, both TM and NTM, modification of energy/activity levels and control strategy was often made at the same time, not representing these two clusters of RAINS model input data a clear boundary line between TMs and NTMs. The cost analysis is thus not feasible in a direct way at this stage and it has been put off to future works. The aim of this work is to draw up a reasoned list about all the Technical and Non-Technical Measures assessed into the Italian Regional AQMPs revising critically the more spread classification systems and to give an estimation of the emissions saved at the target year, 2010, using RAINS-Italy as a part of the National Integrated Modeling system for International Negotiation on atmospheric pollution (MINNI). The efficacy of all AQMPs measures at 2010 is shown in terms of SO2, NOx and PM10 emissions avoided and PM10 concentration reductions together with the improvements of the health impact indicator, the Life Expectancy Reduction (LER), defined as months lost attributable to PM2.5 concentrations.
2.1 National modeling system: the MINNI project
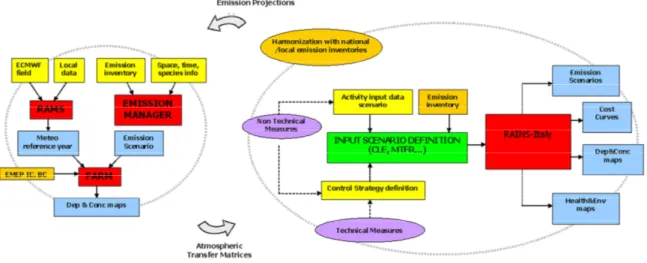
Integrated Assessment Models (IAMs) have been widely applied since the first Regional Air Pollution Information and Simulation (RAINS) model version (Alcamo et al., 1990) has been used as reference tool for policy makers in developing cost-effective solution to complex problems (Warren and ApSimon, 1999). IAMs are transdisciplinary tools in combining the scientific research results in different field like atmospheric chemistry, meteorology, economy, abatement technologies, policies and influences on human health. The most used IAM tool in Europe is the RAINS model (Amann et al., 1999), developed at the International Institute for Applied Systems Analysis (IIASA),which provides a framework for the analysis of emission reduction strategies, focusing on acidification, eutrophication and tropospheric ozone. The RAINSmodel considers emissions of SO2, NOx, PM10, PM2.5, VOC and NH3 (Amann et al., 2001), provides deposition and concentration maps and addresses threats to human health posed by fine particulates and ground-level ozone (Amann et al., 2004). It has now been extended to greenhouse gases (Klaasen et al., 2005; Ho¨glund-Isaksson and Mechler, 2005; Winiwarter, 2005) evolving to the GAINS model (GAINS, 2009). The same approach has been adopted in Italy where ENEA, since 2002 and on behalf of the Italian Ministry of the Environment, the Land and the Sea, has been leading the National Integrated Modeling system for International Negotiation on atmospheric pollution (MINNI) project.
9 The MINNI project consists of two different but connected models (Fig. 2.1):
- the Atmospheric Modeling System (AMS-Italy), simulating air pollution dynamics and multiphase chemical transformations;
– the RAINS-Italy model, calculating emission scenarios, cost curves, impact analysis on environment and health.
The AMS-Italy (Zanini et al., 2005) consists of three main components:
• RAMS (Regional Atmospheric Modeling System), a non-hydrostatic meteorological model (Pielke et al., 1992; Cotton et al., 2003), provides the hourly 3D meteorological fields using a 2- way nested grid system, the outer one covering large part of central Europe and the Mediterranean Sea with a 60 km resolution and the inner one being the target area. Input data come from the ECMWF (European Centre forMedium rangeWeather Forecast) analyses and surface synoptic observations, assimilated during the whole model simulation using nudging technique. Planetary boundary layer scaling parameters, diffusivities and deposition velocities of the chemical species of interest have been then computed with a diagnostic post-processing module;
• an emissions processing system prepares hourly gridded emissions for air quality simulations starting from yearly inventory data, using sets of activity-specific thematic layers, time modulation and speciation profiles. Reference data employed are the province-based Italian inventory and the EMEP (Cooperative Programme for Monitoring and Evaluation of the Long-range Transmission of Air Pollutants in Europe) inventory for surrounding European countries (EMEP, 2003). Emissions from maritime activities included are also considered, as well as volcanoes, whereas some almost 300 large point sources are treated explicitly, taking directly into account plume rise effect;
• the Flexible Air quality Regional Model (FARM) (ARIANET, 2004), derived from STEM (Carmichael et al., 1998), a threedimensional Eulerian chemical-transport model modelling advection–diffusion and multiphase chemistry of atmospheric pollutants, and including different chemical schemes and aerosol modules. Time-varying chemical boundary conditions have been assigned from the three-dimensional fields produced by the EMEP Eulerian model for the same period.
In order to better capture sub-national characteristics, e.g. stagnation inside the Po Valley, a large plane downwind the Alps, the local circulation induced by the complex coastal peculiarities of the Italian Peninsula, both affecting pollutant dispersion and transformation, and to consider a higher resolution land-use definition and consequently a more precise reconstruction of deposition processes, the spatial resolution ranges between 20 km _ 20 km for preparing the Atmospheric Transfer Matrices (ATMs) to 4 km_ 4 km for more detailed calculation. The ATMs provide the link between the AMS and RAINS-Italy. RAINS-Italy (Vialetto et al., 2005) is the national version of the RAINS-Europe model, and considers as emission source areas either the nation as a whole or the 20 administrative Regions; moreover, it considers the national sea traffic. The autonomy of the Regions in defining air quality reduction measures, together with the high orographic and meteorological regional variability requires an administrative regional approach. So 20 km _ 20 km ATMs have been calculated by AMS-Italy (compared to GAINS-Europe 50 km _ 50 km ATMs calculated by EMEP). By means of these transfer matrices, for any of the calculated emission projection, RAINS-Italy quickly generates ambient concentration, deposition and impact maps, allowing the assessment of fine particle health impacts through the Life Expectancy Reduction indicator. These evaluations are obviously affected by simplified assumptions about emission–concentration relations. In RAINS-Italy, the Energy and Production Activities Scenarios, which drive the emission projections in the target years (every 5 years up to 2030) starting from the base year (2000), are developed by ISPRA and ENEA with the optimization model MARKAL (MARKet ALlocation) (Gracceva and Contaldi, 2005). The energy scenario
11 (Contaldi, 2005) represents the Italian official energy scenario transmitted to the EU Commission for the Emission Trading National Allocation Plans (2005), with updated assumptions on the development of natural gas consumption. Both scenarios were downscaled to a regional level and then compared with the scenarios developed by Regional Administrations themselves. In this way, the RAINS model attempts to develop a holistic understanding of a complex reality through a variety of reductionistic steps.
2.3 Definition of Technical and Non-Technical Measures
An emerging issue in meeting policy targets for air pollution is the need to consider Non-Technical Measures (NTMs) for pollution abatement in addition to Non-Technical Measures (TMs) (Oxley and ApSimon, 2007). In spite of their increasing importance, no comprehensive and often contrasting definitions are given in literature as underlined by the UNECE workshop (ASTA, 2005; UNECE, 2006). In the MERLIN Project TM and NTM definition is based respectively on emission factor and activity data changes (Reis, 2005),while in the RAINS perspective, Technical Measures are seen mainly as end of- pipe while Non-Technical Measures as structural and behavioural changes (Schucht, 2005). It is, however, more complicated than this. The NTMs, often supported by fiscal/economic incentives, are actually not completely independent from technology changes even if they are rather geared towards changing the behaviour of technology users (Sternhufvud et al., 2006). Therefore, the definition itself and the assumptions used for NTMs assessment could result in an evaluation process lacking in transparency. An initial attempt to ‘‘translate’’ NTMs both for transport and energy sectors has been implemented in the RAINS-Italy model. In order to do this, the classification followed in the present study derives from Barrett who defines NTMs as measures where the behaviour of people changes such as to reduce a given environmental impact (Barrett, 2005). This means that consumption reduction, substitution, but also technology choice and technology use could be classified as NTMs, while in RAINS view these measures are strictly treated as TMs. In this perspective, although technology changes occurred and, in RAINS language, a control strategy modification was introduced (see Fig. 2.1), measures like the purchase of photovoltaic solar panel to produce electricity instead of fossil fuels or the purchase of high efficiency domestic boilers have been classified as NTMs. The assessment of some NTMs in RAINS-Italy requires consequently modifications of both control strategy and energy consumption, the last ones to take into account different people behaviours towards technology uptake rates with or without regional incentives, so implying a different emission reduction for the same measure. The methodology followed to translate
these measures in RAINS-Italy is further explained and the results of the classification adopted in the present work are reported in Table 2.1.
Table 2.1: Technical and Non-Technical Measures adopted in the Italian Regional AQMPs.
SECTOR TYPE of MEASURES
Photovoltaic NTM
Wind TM
Hydroelectric TM
Geothermic Well TM
Urban Waste incineration with heat recovery TM
District heating Plant TM
ENERGY
Biogas recovery in agricultural and in farming sectors TM
High efficiency domestic boilers NTM
Energy efficiency in building NTM
Residential heating accountability NTM
Heat pumps NTM
Regulation of some fuel use NTM
Efficiency improvements in fireplaces and stoves TM
Solar heating systems NTM
DOMESTIC
Incentives for shift to natural gas in domestic boilers NTM
Low emission zones NTM
Road traffic restriction NTM
Pollution charge NTM
Car sharing NTM
Motorway speed limits NTM
Bike sharing NTM
Incentives for new cars TM
Incentives for new diesel heavy duty TM
Antiparticulate filter TM
Incentive for hydrogen cars TM
New methane service stations TM
Incentives for biofuel public transport TM
Opening new rail lines NTM
Opening new underground lines NTM
Cycle paths NTM
Sea motorway NTM
Bus investment (new buses, service extension, frequency increase) NTM
ROAD
TRANSPORT
13 2.4 RAINS and NTMs in the Italian experience with Regional Air Quality Plans
The aim of the activities undertaken in 2008 in close cooperation with all the Italian Regions was to support their institutional functions in air pollution assessment and management by means of a model able to create multiple emission scenarios starting from a coherent and shared input data assessment. The central task was the analysis of emission reduction strategies followed in the Regional Air Quality Plans to meet environmental quality targets by means of Technical and Non-Technical Measures. In particular, the PM10 emission reductions achieved at 2010 will be hereby the focus of the analysis being this pollutant still a challenge for air quality policies; furthermore results for SO2 and NOx will be shown. The TM and NTM effect on air quality will be shown as PM10 concentrations and losses in Life Expectancy attributable to exposure to fine particulate matter, the health impact indicator in RAINS for anthropogenic PM2.5 (Mechler et al., 2002).
2.4.1 Scenario analysis
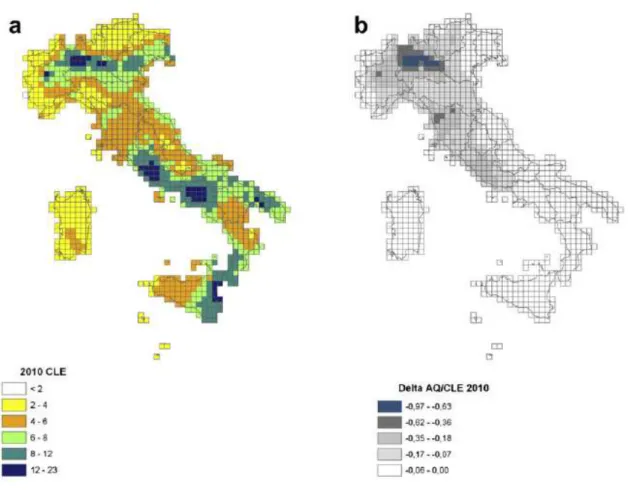
The activity premise was an acceptable harmonization, at a given base year, between regional emission inventories, set up with a bottom–up approach, and RAINS-Italy emissions, estimated with a top–down approach. When the total emission difference between the two estimations was around 5%, the harmonization process (Pignatelli et al., 2007) stopped. The RAINS-Italy regional emission reference scenarios were so developed for the future years downscaling on Regions the baseline national energy and non-energy activity level scenarios with proxy variables and the CLE control strategy. Once defined the regional baseline scenarios, the regional air quality scenarios result from the assessment of the additional measures both technical and non-technical implemented in the Regional AQMPs. At national level, the 2010 CLE total emission scenario shows 213 kt of PM10, 376 kt of SO2 and 1057 kt of NOx with reductions, respect to 2000, the reference year, respectively of 7.9%, 50.1% and 24.0% (D’Elia et al., 2007). The resulting PM10 yearly average concentrations (Fig. 2.2a) show exceedances of 40 (µg m-3), the standard value, at the most important Italian metropolitan areas. Furthermore, the whole Po Valley shows critical conditions considering that in the first runs of AMS model, from which atmospheric transfer matrices were calculated (see Paragraph 2.2), the organic component of primary PM was not considered. Regarding health impacts (Fig. 2.3a), the most important Italian metropolitan and industrial areas have a loss of average Life Expectancy in a range of 12–23 months in 2010. These first evidences highlight the need to implement air quality plans to reduce the PM10 and PM2.5 concentrations in urban agglomerations where the greatest part of population lives and to preliminarily assess the efficacies of the reduction measures. The AQMPs adopted by 15 of the 20 Italian Regions
were so analysed and assessed (see Paragraph 2.4.2). If compared to the 2010 CLE scenario, the 2010 AQMP scenario reduces PM10, NOx and SO2 emission of respectively 2.8%, 2.4% and 0.5% and both the variables mapped in Figs. 2.2 and 2.3 do not show significant improvements. Regions with a more effective AQMP reach higher PM10 yearly average concentrations reductions, with peaks of 7.5% in northern and central Italy, even if not sufficient to assure the compliance at 2010 with air quality standard (Fig. 2.2b). Similarly the improvement in losses of average Life Expectancy indicator achieves 1 month only in Lombardy Region (Fig. 2.3b).
Figure 2.2: PM10 mass concentration (µg m-3) at target year 2010: a) CLE scenario; b) difference (µg
15
2.4.2 Measures analysis
The complete list of the measures adopted in the AQMPs is presented in Table 2.1. A first level of classification is used to refer to the macro-sectors of the activities involved in the adopted measures: Energy, Domestic and Transport. For these macro-sectors, according to the definition used in this work (see Paragraph 2.3), each measure is firstly defined as TM or NTM (see Table 2.1) and then analysed in terms of SO2, NOx and PM10 emission reductions (Fig. 2.4). In Fig. 2.4, the adoption frequency in Regions, shown by the bars, is overlaid with three plot lines, which report the percentage contribution by measure to SO2, NOx and PM10 emission reductions. The figure highlights how the most common measures not always allow the higher emission reductions. In the energy sector, most of the regional AQMPs measures consist of the promotion of renewable energy sources, including electricity and heat generated
Figure 2.3: Losses in average Life Expectancy (months) attributable to PM2.5 concentrations at 2010:
a) CLE scenario; b) difference (months) between Air Quality Management Plan scenario and CLE scenario.
from solar, wind, hydropower, geothermal resources, biomass and biofuels. These measures do not alter the energy services for consumers in terms of a ‘‘technical’’ change in energy supply structures. The energy policy assumptions in the AQMPs support power and/or heat regional-based Plant installation. Therefore, the related incentives have not a consequence on consumer behaviour. The ‘‘Photovoltaic’’ measure provides instead domestic building-integrated photovoltaic systems whose installation depends directly on people’s agreement with the measure and, as already said in Paragraph 2.3, the behaviour could be affected by regional incentives. For this reason, according to the definition adopted in this study, the ‘‘Photovoltaic’’ measure is NTM whereas the other energy measures are TMs. In comparison to the other sectors, the energy measures have a low adoption frequency, varying from 1 to 3 times and their total contribution to SO2, NOx and PM10 emission reductions is respectively 6.3%, 1.5% and 8.0%. In the domestic sector almost allmeasures have been classified as NTMs, concerning prevalently energy conservation/efficiency strategies with or without the support of command and control policies or economic incentives. The total domestic measure contribution to emission reductions is 17.4% for NOx, 93.0% for SO2 and 63.6% for PM10. Among all these measures, the ‘‘Regulation of residential biomass, oil and coal use’’ reaches the highest contribution to the reduction of SO2 emissions (36.4%) and contributes to the 15.8% of PM10 emission reduction. This measure, together with the most effective measure in reducing PM10 emissions (23.8%), the ‘‘Efficiency improvements in fireplaces and stoves’’, highlight another important problem concerning PM10 emissions: the biomass burning for heating, a measure sustained by greenhouse gas reduction policies that originates trade-off with air quality policies. Regarding the road transport sector, the predominant measures are NTMs, whose contribution is strongly needed to achieve a notable NOx emission reduction. All transport measures achieve a total contribution to emission reductions of 0.7% for SO2, 28.3% for PM10 and 81.1% for NOx; of this last reduction, 31.4% was reached through the implementation of ‘‘Incentives for new diesel heavy duty’’. Although its high efficacy, only one Italian Region adopted it, while the contribution of the ‘‘Low emission zones’’, one of the most common measures adopted by 7 regions, is 2.3%. Therefore, modeling NTMs, but also TMs, with RAINS-Italy has not always been a simple task because some measures act in different ways for different pollutants (e.g. motorway speed limits) and others require quantitative assumptions to translate the given input data (e.g. km of new cycle paths) in a suitable RAINS-Italy input data (e.g. energy consumption of cars). These quantitative assumptions often deal with a behavioural component measure and their local applicability; transparency is then required when related impact is shown.
17 To cope with the complexity of the subject and to better point out the methodological approach, a focus on only 6 of all the AQMP measures is reported. The choice arises from the remarkable relevance of these 6 measures in terms of both their results and their modeling through RAINS-Italy. Two measures have been chosen for each macro-sector and reported (Fig. 2.5) in terms of SO2, NOx and PM10 sectorial emission reductions respect to the 2010 regional CLE scenario. In this graph (Fig. 2.5) the stacked bars, whose patterns represent a different administrative region, showthe different sectorial emission reduction for each Region where the AQ measures were applied. Being NTMs dependent on people’s behaviour and varying the hypotheses about measure implementation among Regions, different responses to the same measures have been observed throughout the country with a broad variation of each single measure effect on SO2, NOx and PM10 sectorial emissions, as shown in Fig. 2.5. In the energy sector, the 2 selected measures are ‘‘Urban Waste incineration with
Figure 2.4: AQMP measure adoption frequency in regions, shown by the bars, and percentage
contribution by measure to SO2, NOx and PM10 emission reductions, reported by the three