Università Politecnica delle Marche
Scuola di Dottorato di Ricerca in Scienze dell’Ingegneria Curriculum in Ingegneria Informatica, Gestionale e dell’Automazione
Machine vision and IoT applications
in intelligent retail environments
Ph.D. Dissertation of:
Marco Contigiani
Advisor:
Prof. Primo Zingaretti
Coadvisor:
Prof. Emanuele Frontoni
Curriculum Supervisor:
Prof. Claudia Diamantini
Facoltà di Ingegneria
The problem is not having good ideas,
but is to keep believing
Acknowledgments
Take stock of an intense period like that of a PhD period is never an easy task. These three years have been rich in terms of experiences and opportunities for my own growth. I had the opportunity to do research in a challenging sector such as the customer behaviour analysis in retail environments not only in the university context but also with the collaboration of the Grottini Lab company. The technology transfer between universities and industry it is not only impor-tant for the technological advancement but also to make local company more competitive and I am proud to have contributed to this purpose.
The first thanks go to Prof. Primo Zingaretti for his time, patience and attention shown about my research path.
The second thanks goes to Prof. Emanuele Frontoni for his vision, the ability to far seeing and his contagious passion for innovation.
A big thanks goes to all the Grottini Lab team. A company seemingly small but instead made of great people, skills and ambitious projects.
Thanks to Valerio because he has always shown to believe in me.
Thanks to Luigi for the friendship and continuous technical and philosophical discussion about the future.
Thanks to Francesco for the friendship and the great spirit of collaboration. Thanks to Rocco for the availabiliy and dedication.
Thanks to Marco, Erika and Davide for their helpfulness and friendliness. Thanks also to all the university’s research group VRAI especially Daniele and Roberto for their great collaboration and support.
Finally, thanks to my family and my wife Chiara because there is always and never stops believing in me every day, even when I can not do it alone.
Ancona, Novembre 2016
Abstract
In the retail sector, in recent years, has grown the need to acquire information about customer behavior. This information allows to optimize stores, improve the commercial offer, innovate products and maximize profits by monitoring in real time the behavior and choices of customers. The physical sales point is now no longer the only place where the purchase takes place and for this reason should be able to rapidly align with the needs of customers transforming the spaces and the shopping experience using the data collected. This aim can be achieved through the use of IoT solutions based on machine vision, indoor tracking systems and distributed sensors for environmental parameters monitoring.
In this context the research activity had as its main focus the study and development of solutions based on RGB-D cameras, WiFi smart camera for planogram maintenance, UWB indoor tracking systems and the analysis of distributed networks of capacitive sensors placed inside floor for human move-ment control. The effectiveness of these measuring systems and the analysis software developed have allowed to realize a complete monitoring system for retail environments that thanks to IoT communication protocols allows to an-alyze in detail and in real time in a store: how many people, how they move, how interact, what they buy and how long it takes to perform each of the above actions.
The research path has been conducted in full collaboration and cooperation with the Grottini Lab company. Through this synergy several installations have been made in real stores that have allowed to test the validity of technological solutions designed and at the same time to collect many data useful for the behavior analys of individual and groups of customers.
The data produced with these analysis systems are collected on IoT cloud platforms and once stored, can be processed and made visible in appropriate dashboards in terms of charts and key performance indicator to make a care-ful analysis of the human behavior in a retail space. In this thesis it is also mentioned the topic of interpretation of the data, crucial aspect for a correct understanding and right use of results.
Contents
1 Introduction 1
2 State of the art 3
2.1 Customer behavior and retail environments . . . 3
2.2 The IoT approach . . . 6
2.3 Fields of application . . . 8
2.3.1 Machine vision . . . 8
2.3.2 Smart floor for user localization . . . 10
2.3.3 Indoor tracking system . . . 13
3 Technical solutions 17 3.1 Shopper Analytics . . . 18
3.1.1 System architecture and method . . . 18
3.1.2 Retail test . . . 22
3.2 Planogram Integrity . . . 25
3.2.1 System architecture and method . . . 26
3.2.2 Description of experiments . . . 32
3.3 Smart floor . . . 36
3.3.1 System architecture and method . . . 36
3.3.2 Description of experiments . . . 39
3.4 Indoor trolley tracking . . . 41
3.4.1 System architecture and method . . . 41
3.4.2 Retail test . . . 46
4 Shopper conversion: a real application 49 4.1 About the architecture . . . 50
4.1.1 Macro system technology . . . 50
4.1.2 Micro system technology . . . 52
4.2 Dashboard and KPI . . . 54
List of Figures
2.1 The structure of the sensor floor unit [1]. . . 11
2.2 The prototype sensor mat with 4 grids and 2 layers [2]. . . 12
3.1 Technological solutions developed for the customer behavior anal-ysis. . . 17
3.2 General scheme of the implemented system. . . 18
3.3 Environment of system installation. . . 19
3.4 Logical steps of the implemented algorithm. . . 20
3.5 Object tracking implementation. . . 21
3.6 Setting parameters of the shelf zone. . . 22
3.7 Details of Shopper Analytics roll out phase. (a) Camera installed above shelves of Ferrero’s products. (b) Camera installed on Angelini’s pharmacy showcases. . . 23
3.8 Statistics per day of data collected. . . 24
3.9 Interaction and sell intex trends of a selected product during test period. . . 25
3.10 The smart camera . . . 27
3.11 Diagram of the five components with their input/output connec-tions. . . 28
3.12 Example of planogram used in the retail market and described by an XML file. This format is typical of several planogram description software available in the market. The most famous is Spacemen, distributed by Nielsen. . . 29
3.13 Representation of the implemented image processing algorithm. 29 3.14 Comparing two planogram images: (a) planogram image (base planogram) (b) acquired image (actual image) (c) visualization of the difference image. . . 30
3.15 The Sensor Cloud Architecture. . . 31
3.16 Representation of the experimental set-up. . . 33
3.17 Comparison between the base planogram and current Out Of Facing (OOF) of products for different Stocking Keeping Units (SKUs) in the shelf. Differences (Diff) can be useful for planogram optimization based on optimal space allocation. . . 34
3.18 Capacitive sensors on polymeric support installed between solid
wood and wooden part of a floating floor. . . 37
3.19 Capacitive sensors and driver board connected and placed inside the tiles of floating floor. . . 38
3.20 On the top, the movement of the foot. On the bottom, the forces exerted by different states of support. . . 39
3.21 Prototype for the testing on the floor. . . 40
3.22 Long life test scenario. . . 41
3.23 DWM1000 decaWave module. . . 42
3.24 System architecture. . . 43
3.25 Sewio UWB kit. . . 43
3.26 Showroom test. . . 44
3.27 Retail test . . . 46
3.28 3D printed enclosure . . . 47
3.29 Heat map realized with the data collected during SiConTe test. 48 4.1 A detail of the german store. . . 49
4.2 Data collection and processing schema. . . 51
4.3 A detail of an anchor placed inside the countertop. . . 51
4.4 Data workflow implemented with Amazon AWS services. . . 52
4.5 An example of RGB-D camera installation on ceiling. . . 52
4.6 A detail of spirits category. . . 53
4.7 Configuration hardware of Shopper Analytics mounted on ceiling. 53 4.8 The dashboard implemented to analyze data. . . 56
4.9 Dashboard: cockpit section. . . 57
4.10 Dashboard: store visits section. . . 58
4.11 Single cell aggregation data of heat map. . . 59
4.12 Dashboard: heat map section. . . 59
4.13 Dashboard: funnel section. . . 60
4.14 Dashboard: vertical heat map section. . . 60
List of Tables
2.1 Main differences between different indoor tracking technologies 15
3.1 Description of each module of the smart camera . . . 28
3.2 Battery based life time vs image resolution . . . 33
3.3 Showroom test . . . 45
Chapter 1
Introduction
Collect data to know your customer and study its behavior: this has always been a crucial aspect for the retail industry and in recent years this need has become increasingly important. The increase in marketing tools and platforms of selling has forced retailers to transform the purchase into a marketing ex-perience. And in this scenario the spaces play an essential role. There is the need to design stores, products and methods of presentation so that to engage and capture the attention of a customer, by now all too overstimulated. Know your customer, his behavior and his reactions is decisive to optimize space, maximize profits and increase recognition of brand and products.
The technology in this sense plays an essential role. The audit, interviews in the stores and the analysis of sales are not sufficient to learn about trends and behaviors. The use of real-time analytics tools offers the opportunity to study quickly and effectively the customer. In this work will be presented different technological solutions that allow to monitor the behavior of customers in front of the showcases, the interactions with the shelves and know its movements inside the store together with dwell times and most visited areas.
The use of machine vision techniques, image processing, indoor tracking systems and proximity detection are currently the most interesting solutions to analyze the human behavior within the space and in front of points of interest. In particular will be presented a video analysis software, referred to as Shopper Analytics, based on the use of RGB-D camera able to process the types of interactions that customers have with the products, dwell times in front of the shelves and the number of visitors. Will be also presented an embedded vision sensor IoT network for planogram maintenance in retail environments able to analyze the correct placement of products on the shelf.
About the analysis of the use of space will be presented two solutions, the first which makes use of distributed capacitive sensors immersed within the floor capable of locating persons and objects and the second that makes use of a UWB realtime indoor tracking system useful for the study of people’s flows, most visited areas and dwell time spent in a store.
ap-proach. After collecting data from the real context analysis each system sends the information to a cloud platform that stores and process the data. Finally will be discussed, although in not exhaustive way, about the data elabora-tion and presentaelabora-tion in terms of meaningful key performance indicators (KPI) useful to extract descriptive information about the store’s performance, prod-ucts, planograms used, marketing campaigns, positioning of products within the store and points of interest.
This last aspect certainly opens up new research areas to continue in the handling and optimization of data. The Ph.D program and then the work presented in this thesis has been possible thanks to the collaboration with the company Grottini Lab tha has co-financed the scholarship. The company de-velops high-tech solutions to measure the customer behaviour and improve the stores performance. This collaboration made it possible to carry out several demo installations at first in the showroom then in real stores with the coop-eration with some partners, which have allowed to validate in a real context the developed solutions and especially test the reliability of the hardware ap-paratus and software used. The collected results, as we shall see in this work, are very interesting, confirming the validity of technological solutions analyzed and the potential that these can have in real use cases.
In summary, main contributions and results are about:
• RGBD not invasive technological solutions useful to acquire the customer behavior in front of the shelf;
• innovative IoT solutions able to study the planogram integrity and im-plement an indoor tracking system using the UWB technology;
• a smart floor implementation able to locate persons and objects in retail environments;
• the techniques to collect, process and present data and results in terms of meaningful key performance indicators and dashboards.
Chapter 2
State of the art
In the last years, the analysis of the human behavior has been of high interest to researchers because its important and different applications, such as: video surveillance, ambient assisted living, analysis of consumer’s behavior, group interactions, indoor tracking and many others. In particular, in the field of intelligent retail environments, several studies to investigate how shoppers be-have inside a store and how businesses can change strategies to improve sales are emerging.
The technological solutions currently used to analyze the human behavior within spaces in particular in retail environment are based on the use of com-puter vision and image processing, RF indoor tracking systems (WiFi, BLE and RFID), proximity solutions such as beacons BLE, distributed and intercon-nected sensor networks to monitor environmental parameters. In this context the solutions adopted to implement a retail store’s life analysis and which are the main topics of this work can be grouped in three different technological ap-plication fields: machine vision, capacitive distributed sensors for localization of objects and people and RF indoor tracking systems.
All these solutions have in common the use of the IoT paradigm. The devices measure several environment parameters and are able to collect and send data to the same cloud platform. The data are stored and subsequently elaborated with a big data approach to study and analyze in detail the information col-lected. In the next few paragraphs will be presented the state of art about IoT, the technological solutions developed to monitoring the human behavior in retail environments and also will be presented a short explanation of the importance of customer behaviour analysis to study the retail environments performances.
2.1 Customer behavior and retail environments
The necessity to associate marketing retail and consumer behavior is born from the need to develop theories, strategies and management models compatible with customer behavior. The concept of shop is changed during years becoming
not only the place where customers go to buy a specific product, but also the place where the customers go to spend part of their time. Therefore, it is very important to study the consumer behavior so as to investigate the elements of the decision-making process of purchase that determines a particular choice of consumers and how the marketing strategies can influence the customer.
Empirical researches on consumer behavior are primarily based on the cog-nitive approach, which allows to predict and define possible actions that lead to the conclusion and to suggest implications for communication strategies and marketing. The basic principle of this approach is that individual actions are the result of information processing. The person collects the information, interprets, processes and uses them to take action. Cognitive approaches can-not completely explain the complexity of consumer behavior, which lives in a changing social and cultural context.
According to this approach, the choice of purchasing comes from the ability of the products to generate specific sensations, images and emotions. According Perreau [3], five are the steps of consumer buying decision process:
1. Perception of the problem: the shopper recognizes a gap between the current situation and desirable situation, therefore perceives a need. The need can be described as a genuine request that comes from the inside and the satisfaction of which is necessary for the survival or to maintain a good level of psychophysical balance.
2. Research of information: in order to identify the satisfying solution for the perceived need, the consumer searches for knowledge in the memory, or if the information possessed by the individual is not sufficient, will seek additional data from external sources.
3. Evaluation of options: consists of selecting one of the available alterna-tives based on the criteria defined in the previous step.
4. Buying decision: after having identified the place and time.
5. Post purchase behavior: is the adequacy of the product purchased and thus the level of consumer satisfaction.
Therefore, the marketing retail discipline defines the set of marketing strate-gies to point of sale oriented so as to attract the customer and to increase the activities of businesses. To achieve its objectives, the retail marketing uses many techniques through several stages of planning by developing a market-ing model for the shop-customer usmarket-ing the most important techniques, in the following described:
• Visual merchandising is the activity of developing floor plans in order to maximize sales. The purpose is to attract, engage and motivate the
2.1 Customer behavior and retail environments
shopper towards making a purchase. As means of visual merchandising is often widely used a planogram [4].
• Pricing is the activity of establishing the best price that is competitive for shoppers and at the same time with a good profit margin for the store. • Sensory marketing, to make the shopping experience more pleasant and
exciting for the client.
• Loyalty tools, to encourage the consumer to return to the store and to make new purchases.
• Non-conventional marketing concerns original ideas to push the customer to come into the store and trigger a word of mouth process. The best way to know the behavior of the customer is to create an automatic system that, on the base of acquired knowledge, can predict the purchase of many products and also choices.
Literature and real cases demonstrate how pervasive computing enhance ben-efits for retail; this is true for consumer as well as for retailers [5]. In the last decade we observed a turnaround in the concept of shop. One time it was only the place for searching and buying products, nowadays it has become the place where consumers spend time, test products in real time or just inquire about the recent technological products or trends. New stores make are places where many people still prefer to visit and spend time stores. People’s shopping is guided not only by the prices, but also by the ambiance of shopping, profes-sional consultation, seeing, touching and trying the products [6]. Because of this, researches over consumers behaviour are strictly related with in-store fea-tures for the retailers. The study of consumers behaviour is needful for many aspects. First of all to investigate over the decision-making process which drive consumer towards choices, different from one another; furthermore, it is the only, a not empirical way to evaluate the success of marketing strategies.
Technology provides analytics taken from consumer interaction with spaces; it can give many information about customers, allowing the retailer to cus-tomize the shop to their needs and adapting product arrangements, expositions, design according to their behaviours. Data extracted in this way are objective; indeed, this kind of decision-making process is lead to an objective and reliable data collection. Intellectual approaches are not able to explain the complexity of consumer behaviours, because they arise from many aspects such as cultural context, habits and so on. Several aspects of these problems are currently solved using artificial intelligence and, in particular, vision [7]. Previous works demonstrate as the growing complexity of retail surroundings makes essential the presence of ambient intelligence to augment the environment intelligent, aimed to the awareness of human presence.
2.2 The IoT approach
The term Internet of Things was introduced by Ashton [8] in the supply chain management field. Successively, mainly in the last years this term is related to several applications transportation and logistics, healthcare, smart environ-ments, personal and social domains [9].
Taking into account the work of [10], IoT can be realized thorough three paradigms: internet-oriented (middleware), things-oriented (sensors) and semantic-oriented (knowledge). Taking into account the work of [11], eight are the key components that IoT have to support:
1. Devices heterogeneity: smart objects are different from the computational and communication viewpoint, so the management of these different de-vices occurs at architectural and protocol level.
2. Scalability: different objects are connected to a global infrastructure, so problem of scalability happen on different levels (name and address, data communication and network, information and knowledge management and service provisioning and management).
3. Ubiquitous data exchange through proximity wireless technologies [12]. 4. Energy optimized solutions so that the need to have solutions directed
to reduce the energy used for communication and computing purposes is recently more attractive.
5. Localization and tracking abilities so that smart objects are localized and tracked in their movement in physical environments. This occurs in applications that widely adopt RFID technologies.
6. Self-organizing abilities for which in order to reduce the human interven-tion in a dynamic scenario where smart objects must autonomously react and organize themselves [13], [14].
7. Semantic interoperability and data management for which IoT will ex-change and analyse a huge amounts of data and so from the point of view of interoperability among several applications have to provide data with adequate and standardized formats.
8. Embedded security and privacy-preserving mechanisms, so IoT technol-ogy has to be secure and privacy-preserving by design. So that security must be considered a key system-level feature, and considered in the de-sign of architectures and methods for IoT solutions.
Moreover, there are three components required for IoT [15]: hardware (sensors, actuators and embedded communication hardware), middleware (on demand
2.2 The IoT approach
storage and computing tools) and presentation (novel visualization and inter-pretation tools useful for different platforms and applications).
IoT shares many characteristic with Ambient Intelligence [16]. The concepts of Ambient Intelligence (AmI) [17], [18] provide a vision of the information society in which the emphasis is on a greater attention to the user, more effi-cient support services, enrichment opportunities for the user, and an increased support for human interactions.
People are surrounded by intelligent and intuitive interfaces, integrated in every kind of object and an environment that is capable of recognizing and responding to the presence of different individuals in a fluid, most intrusive and often invisible scenario [19]. The characteristics of a smart environment,in accordance with the users that use it, should be in general those listed below: not intrusive, personalized, adaptive and predictive.
As previously said, many and different are the applications domain of IoT models. They can be categorized into four applications domains: transporta-tion and logistics, healthcare, smart environments, personal and social [10] [20]. Vehicles such bicycle, cars, buses, and trains are equipped with sensors, actu-ators, and processing power, in order to optimize their performances but also are able to provide important information concerning, for example the traffic control, the monitoring of the status of the transportation, the knowledge of the better navigation and route. Other examples involve collision avoidance systems and also monitoring of transportation of dangerous materials. More-over, augmented maps can be another service that provides useful information about the area of interests for users [21].
Several are IoT technologies used for healthcare applications: they can be grouped basing on their use and their application fields. For example: tracking and monitoring people to evaluate their state of health, detection and authen-tication of people for their security and safety, automatic data collection and enabling function centred on patients, that provide in real-time information on the health of patients [22].
Smart environments domain is particularly important for IoT scenario, as it represents the link between the individual (citizen, consumer) and the overlying layers of adoption of IoT paradigm (Smart City, Smart Grid). Small dimen-sions sensors and actuators distributed in office, home, industrial plants are able to make life more comfortable considering different aspects: room lighting can change according to our preferences and weather conditions, energy can be automatically preserved, room heating can adapt to match the individual preferences.
In personal and social domain, IoT applications aim to make easy the com-munication between people ensuring a continuous interaction and automatic sending of messages to friends to maintain and build social relationships [23].
There are futuristic applications that are based on technologies that are still to come and the implementation is too complex. However, an important open problem and actually object of study is the standardization activity on different IoT technologies, in fact there are several contributions towards this direction.
2.3 Fields of application
In order to satisfy the need to measure the customer behavior and the store performance have been developed four different solutions. The first uses an RGB-D camera for monitoring the customers behaviour in front of shelves and showcases. The second solution implements an analysis of the planogram to continuously verify the correct location of products on shelf. The third solution uses an innovative intelligent smart floor equipped with capacitive distribuited sensors and self powered with energy harvesting techniques for localization of objects and people. The fourth and last solution makes use of an indoor UWB tracking system for tracking customer movement within the retail space. In the next paragraphs will be presented in detail the state of art of the technological fields where this new solutions are collocated: machine vision, smart floor and indoor tracking system.
2.3.1 Machine vision
In recent years, the visual analysis of dynamic scenes is one of the most impor-tant research activities in computer vision and image understanding. When the visual analysis concerns moving scenes, the general method includes following steps: modelling of environments, motion detection, human identification, clas-sification of moving objects, tracking, behavior understanding and data fusion from multiple cameras [24–26].
In this work, we focus the attention on:
• the analysis of the planogram mantainance and the correcto location of products on shelf;
• the study of the consumer behavior in a real retail store, in order to rec-ognize human actions [27–30], such as interacting with the shelf, picking or releasing a product, moving in a group, and knowing most visited areas in the store.
Consumers are main actors in the project because the goal is to increase their satisfaction and, therefore, enhance their purchases. Currently, the iden-tification of the shoppers behavior implements systems of human observation or video recording with traditional cameras. Some tools, such as virtual stores or eye tracking provide incomplete and unrepresentative data because they are
2.3 Fields of application
based on a small sample of buyers. As a result, by univocally identifying shop-pers and automatically analysing their interactions with the products on the shelves and their activities in different zones, our design considerably increases the value of the current marketing research methodologies.
Moreover, the main innovation concerns the original use of tracking system, and the other interesting point concerns the real experimental platform de-scribed in the results section combined with a vision based statistical approach. Therefore, the solution developed aims to propose an intelligent low-cost em-bedded system able to univocally identify customers, to analyse behaviors and interactions of shoppers and to provide a large amount of data on which to perform statistics.
The automatic extraction of features that univocally recognize each subject in the scene and their movements, provides an important tool to identify impor-tant operations concerning marketing strategies. The application implements techniques of image processing such as: background subtraction, low-level seg-mentation, tracking and finding contours, in order to map a single shopper and/or a group of people within the store that interact with the products on the shelves, defining an ID unique to each visitor filmed by the camera, and classifying these interactions.
The customer behavior in front of shelf have also a crucial correlation with the location of products on shelf and the planogram manteinance. The planogram is a detailed visual map of the products in the store indicating the position of the products in order to supply their best location for suppliers. Planogram at-tempts to capture the absolute physical positions of an assortment, the relative locations of products in an assortment, the amount of space allocated to each category and each type of stocking keeping unit (SKU) within the category. In other words, the planogram is designed for reasons such as increasing sales and profits, introducing a new item, supporting a new merchandising approach, etc. Deviating from the planogram defeats the purpose of any of these goals.
A study of the National Association for Retailing Merchandising Services (NARMS) found that a 100% planogram compliance after an initial reset, within two weeks yields a sale lift of 7,8% and a profit improvement of 8,1% [31,32]. A fundamental aspect is the development of a shelf planogram to reflect the real need of the product in that particular location and in that time-frame. Compliance with planogram is crucial to avoid stock-outs and to maintain the expected level of sell-out; an estimate indicates that a 10% of planogram errors leads to an increase of the 1% in stock-outs and consequently decreases the sell-out of the 0.5%.
In the literature there are many studies working on the analysis of planograms, e.g., [7, 31, 33]. In particular they demonstrate that planogram maintenance is a key aspect to increase shelf value and improve sell out. A series of patents
for determination of inventory conditions, determination of product display parameters, planogram extraction and detection of stock out conditions based on image processing can also be found in [34–37]. At the base of these prod-ucts there are algorithms able to detect and extract several features such as logo [38] or books [39]. In [40] and [41], it is possible to retrieve examples of software that use images for automatic planograms compliance and generation. Both are commercial products that are based on images manually collected in front of the shelf and analyzed on a web based platform or in a local desktop application. Differently from our system they are not real time and also they are always managed by a man using a camera, and for this reason they are not monitoring the planogram continuously. This aspect is important not only to continuously verify the planogram maintenance, but it is also essential for the Shelf-Out-Of-Stock (SOOS) management system based on real time sensor based measures and for costumer’s activity recognition on the shelf interaction. In fact, the same system architecture has been extensively used to monitor both the behaviour of the costumers in front of the shelf [42–46] and the absence of products on the shelves [47].
In this work, to protect the integrity of the planogram, we propose an embed-ded system, mainly based on a WiFi smart camera installed in points consid-ered strategic for the stores taken into consideration. Each embedded system produces an amount of information useful not only to assess the integrity of planogram, but also concerning out-of-stock.
2.3.2 Smart floor for user localization
The development of a floor that enables user localization and also allow to analize movement of users in space applications is an interesting topic. In the literature there are different solutions to implement a smart floor; most of them are based on a pressure sensing system.
The MIT Magic Carpet [48–50] created by MIT Media Lab and the Uni-versity of Limerick Ireland uses piezoelectric wires and optical proximity sen-sors. This system is characterized by a large sensing area and frame rate but presents poor sensor densities. This interactive environment uses a pair of Doppler radars to measure upper-body kinematics, i.e. speed, direction of motion, amount of motion and a grid of a PVDF piezoelectric wires hidden under a foot carpet to monitor dynamic foot position and pressure. The aim of this system is an audio application: the user modifies and transforms complex musical sounds and sequences while they are moving on the carpet.
The ORL Active Floor [51] designed by Oracle Research Lab uses load cells that provide little detail and cannot be used for high sensor densities. An array of sensors provides information on the distribution of a vertical ground
2.3 Fields of application
Figure 2.1: The structure of the sensor floor unit [1].
reaction force over the area of the floor. When only one object is in contact with the floor, its center of pressure is known. There is a problem when two or more objects are in contact with the floor since, it is not possible to determine without ambiguity the centers of pressure for the objects, departing from the sensor array readings. This aspect was a subject of research at ORL.
The University of Tokyo, Japan, created a high resolution pressure sensor distributed floor [1] that can simultaneously detect both human and robots. This distinction is possible thanks to the high resolution of the floor, and its modular structure allowed an easy application to a real room. The authors retain that the sensor floor system can be used to understand the behaviour of humans in a room, and that it will also play an essential role in the future human-robot symbiosis environment by detecting the position and direction of humans and robots in the room. Figure 2.1 represents the sensor floor unit consisting of three parts. The sensor floor has a number of sensor units: for example 16 sensor floor units arranged in 4x4 array.
Another sensor system is the Z-Tiles [52, 53] designed by the University of Limerick Ireland and MIT Media Lab. It uses a force sensitive resistor tech-nology. This system has the advantage of having a modular design, a series of prototype Z-tiles nodes join together to form a flexible, pixellated, pressure sensing surface, a high frame rate, but a low sensor density. This surface pro-vides full time-varying, force-distribution information, since the Z-tile nodes form a self-organising network to allow for easy data extraction from the floor,
Figure 2.2: The prototype sensor mat with 4 grids and 2 layers [2].
without restricting the size or shape of the floorspace. The applications of this structure concern generating music from the movements of dancers, as an input device for the control of computer games, and so for virtual reality applications. The Floor Sensor System [2], a solution of the University of Southampton in UK, uses a binary switch technology, with the advantage of a low cost de-sign, but providing poor data useful for tracking and localizing users. In this work a prototype system for acquisition of footfall data has presented, designed to study the gait by applying an alternate modality. The system consists of three main components: a large sensor mat, showed in figure 2.2, a hardware interface, and software. The sensor system is a promising prototype.
The projects AME floor I, AME floor II and AME floor III [54] developed by the Arizona State University are based on force sensitive resistor technology. They have a temporal domain, but not spatial domain. The pressure sensing floor system has a higher frame rate, less latency, high sensor resolution, large sensing area useful with real time data to know the location and amount of pressure exerted on the floor. The floor has been integrated and synchronized with the marker based motion capture system to create a smart environment for movement based human computer interaction. The sensing system has been used to drive a gesture recognition system that uses both kinematics and
2.3 Fields of application
pressure distribution to recognize gestures. These gestures could have similar body shapes but different weight distribution, so pressure sensing is fundamen-tal to distinguish between such gestures. The ability to read and analyze both body kinematics and pressure distributions suggests users to communicate with computers. A problem of AME Floor-III is that now is not portable, and so interfacing is one of the problem that must be solved.
2.3.3 Indoor tracking system
In a localization system, several are the performance criteria that can be clas-sified in different areas [55]. One is accuracy, determined as the mean error distance between the estimated location and the real location, and for a posi-tioning system is the most important requirement. A high value of accuracy corresponds to better performances for a localization system. Responsiveness is another requirement that indicates how quickly the position of a moving ob-ject is updated. The updating must be fast for a quickly moving target. The problem of coverage (local, scalable and global) is strictly related to the accu-racy and represents the network coverage for a specific area. This parameter is important to evaluate the performances of a positioning system and establish the size of the affected region. Other important parameter is the adaptiveness that indicates the ability of the localization system to adapt to environmen-tal changes. This system appears efficient if it is able to provide a correct positioning without a calibration even if some differences in the environment occurs. Scalability is another important parameter when a system is designed since it means that the system can operate with a larger requests of location and a larger coverage. A scalable system must be able to easily manage a high number of variables. Also cost and complexity influence the performances of positioning systems since the complexity of algorithms and signal processing used to estimate the position represents another problem that must be con-sidered. The complexity and accuracy are requirements that can significantly influence the overall cost of the system.
Taking into account the study conducted in 2008 by the National Institute of Standards and Technology (NIST)1, the most important characteristics that
a positioning system must have can be synthesized as follows: positioning pre-cision near 1 meter; functioning on all buildings; no training required on site; stability against structural changes; and limited costs.
In the work of [56], the authors summarize the main general problems and requirements for indoor tracking systems taking into account several environ-ments and locations. Basing on this study they classify the positioning systems technique according to their use. In the last recent years, many technologies to
detect indoor localization have been proposed: they include Global positioning system (GPS), Radio-Frequency IDentification (RFID), cellular based, WLAN based, Bluetooth, Ultra Wide Band (UWB) and many more [57].
GPS is one of the most successful positioning system in outdoor environ-ments. However, one of the main problems of this technology is that it can not be used in many indoor environments due to the lack of GPS signal and also the hardware is quite expensive [58]. GPS is not efficient also in urban canyons, where the calculation of position is not univocally determined and the signal can be absent.
Radio-Frequency IDentification (RFID) is a technology used to store and retrieve data using an electromagnetic transmission to an RF compatible in-tegrated circuit and actually is considered as a tool to increase processes of data handling. This kind of system has many basic components and it can be passive or active [57].
Also cellular-based systems are mainly used to estimate user location for outdoor applications. The accuracy of the method is generally very low and depends on the cell size. Moreover, for indoor positioning systems this tech-nology is possible if the building has several base stations or one base station with strong RSS signal received by indoor mobile clients.
Wireless Local Area Network (WLAN) become a very popular technology in public hotspots and corporate locations mainly in the last years. In local-ization applications where the accuracy is a very important requirement this technology is not adapted since typical WLAN positioning systems using RSS is about 3 to 30 m, with an updating rate in the range of few seconds.
Bluetooth technology compared to WLAN has a gross bit rate lower and also the range is shorter. However, Bluetooth is in most phones and personal digital assistants (PDAs) and supports many different networking services. Each de-vice has a unique ID. To use Bluetooth technology is necessary that all dede-vices have Bluetooth actives, and not always this occurs.
The last technology is UWB used in this work. UWB is a radio technology for shortrange (< 1 ns), high-bandwidth communication with a low duty cycle and has the properties of multipath resistance. In [59] have been presented the advantages of this technology. Compared to RFID systems, which use on single bands of radio spectrum, UWB simultaneously transmit signals on multiple bands of frequencies (from 3.1 to 10.6 GHz). Unlike RFID, UWB signals are transmitted with a shorter duration, consuming less power and can operate in a wider area of the radio spectrum. UWB and RFID can operate in the same area without interference thanks to the differences in signal types and radio spectrum. Moreover, UWB signal is able to pass through walls, devices and clothes with no interferences.
2.3 Fields of application
WiFi BLE RFID UWB
Precision 5-20mt 1-5mt 50cm-1mt 15-30cm
Costs Medium Low High Medium
Battery life Low High High High
Installation complexity High High Low Medium Table 2.1: Main differences between different indoor tracking technologies
cm not achievable using conventional wireless applications (RFID, WLAN and others), and so it is very useful for applications that require a high levels of precision in real time for 2-D and 3-D localization. UWB radio signals are employed for indoor location and tracking [60]. Positioning systems can be divided in three main categories: time-of-arrival, direction-of-arrival and signal-strength based systems. Identifying the position of a target in a wireless system involves the set of location information from radio signals that travel between the target and a number of reference nodes. In table 2.3.3 have been synthesized the main differences between the different indoor tracking technologies in terms of cost, battery life, installation complexity and precision. For this purpose, time-based positioning technique measure travel times of signals among nodes and UWB technology represents a very useful means for wireless positioning for its high resolution in the time domain.
Chapter 3
Technical solutions
In this chapter will be presented the technological solutions developed in this work, figure 3.1. Initially will be described Shopper Analytics a software for the analysis of customer behavior in front of the shelf together with a description of the tests carried out in Grottini Lab showroom and in real stores. Subsequently will be presented an IoT smart camera to analyze the planogram maintenance and the location of products on shelf. Afterwards will be shown a smart floor implementation and the tests made for the validation of the technological choice with an analysis of possible applications in the retail environment. Finally, will be presented the UWB system for tracking of trolleys and baskets in stores. In this last section after a short description of the technology will be analyzed in detail the tests and system performance in real environments in particular in the retail environment. The next chapter will present the first case of simultaneous application in a real store of Shopper Analytics and UWB tracking system, explaining in detail the techniques used to merge data collected by the two systems and the initial results obtained in terms of reliability.
Figure 3.1: Technological solutions developed for the customer behavior analysis.
3.1 Shopper Analytics
The software Shopper Analytics, as already anticipated, using a RGB-D camera is able to analyze and process interactions and number of visitors in front of areas of interest as exhibition areas, shelves and showcases. The camera placed above from these areas can extract relevant data as dwell times, types of interaction sending in real time the data to a server cloud for the collection and storage. The software has been developed in collaboration with PhD student Daniele Liciotti, the VRAI university research team and the company Grottini Lab.
3.1.1 System architecture and method
In order to satisfy both functional and non-functional requirements of the sys-tem, a Single Board Computer (for example an Asus Vivo mini pc) has been used, since it is sufficiently small and suited to manage all functions. Functional requirements are: counting and classification of people, their interaction with the shelf, sending data to web server and data analysis; while non-functional requirements are: place of installation and connection modes. As RGB-D sen-sor, Asus Xtion Pro live has been chosen due to its smaller dimensions than Microsoft Kinect, and the power supply is provided only by USB port. It does not need an additional power. Figure 3.2 shows the general scheme of the im-plemented system and the interactions between the components. The system consists of three devices, listed below:
Figure 3.2: General scheme of the implemented system.
• Single Board Computer: is a complete computer built on a single circuit board, with microprocessor(s), memory, input/output (I/O) and other features required of a functional computer. Single-board computers were made as demonstration or development systems, for educational systems, or for use as embedded computer controllers.
• Asus Xtion Pro live: is composed by an infrared sensor, a RGB sensor and 2 microphones. It is able to provide in output a RGB representation of the scene and also allows to reconstruct a depth map of the same.
3.1 Shopper Analytics
In the depth map the value of each pixel codifies the distance of each element from 3D scene.
• Router 3G/4G Wireless. Debian operating system is installed allowing an easy configuration of RGB-D sensor of Asus Xtion Pro Live compiling following modules: OpenNI Library and PrimeSense Sensor Driver. The RGB-D sensor, figure 3.3 is installed in a top view configuration at three meters of height from the floor. It visualizes a maximum area (shopper tracking area) of 1.8m x 3.2m, but the shelf area (shelf tracking area), that has a height of two meters, results smaller than this. The system implements the algorithm that calculates the interactions map between the people in the store and the shelf, sending successively data to a database. Trough a PC, it is possible to connect a smartphone to the database and to visualize the state of system and other interesting information.
Figure 3.4 represents the block diagram that identifies the main steps of the algorithm. The input is the image detected by the camera and the output is the typology of interaction between the user and the products on the shelf.
Figure 3.4: Logical steps of the implemented algorithm.
In the first step, the system acquired the streaming video from the RGB-D sensor. After this, the background subtraction method is implemented, that is one of the most commonly used algorithms for detection of moving objects within a sequence of images. This approach is reliable since each pixel also maintains the depth information, that is not available with a RGB image and so it allows to detect the distance of each blob. Moreover, in order to avoid false detection of objects (false positives), the background image is dynamically updated. After the background subtraction, a threshold value is defined that allows to discriminate positive signals that indicate moving objects, by false positives due to background noise, this method is called segmentation. Another important step consists of the object detection where, for each significant blob, the boundary and the maxima points are found, corresponding to the head of the person. If these points are surrounded by a region of the lowest points comparable to jump head-shoulder of a human then is a valid blob. The next phase is the object tracking that recognizes the pathways of different blobs
3.1 Shopper Analytics
along the frames. In other words, in this phase, each blob is recognized and tracked within the streaming video. For each person, the height is determined verifying that this is in the neighborhood of the height of the person in the previous frame.
This method is easy but very effective since it is based on the depth image; moreover it is not subject to rapid changes in the forms, allowing a good and reliable tracking. Figure 3.5 shows how the people are tracked between two successive frames (frame i-1 and frame i). In both frames, the same identifier (ID1) detects the same blob, tracked between frames, so each identifier univo-cally identifies a person. In this phase of the work, users are not tracked across the sensors, but we retain that this approach must be investigated in future, so that to each visitors maintains a ID unique during the entire visit to the store implementing a re-identification algoritm.
Figure 3.5: Object tracking implementation.
The last step of the algorithm provides the find interactions procedure. When a person has a contact with the shelf, the associate blob is inside the shelf zone. Then, it is possible to detect the exact point of contact by means the definition of common 3-dimensional (XYZ) system coordinates. The shelf zone, that is defined by user in a configuration file, is formed by three parameters (x shelf dist sx, x shelf dist dx and y shelf dist) as also showed in the following figure 3.6. When the people interact with the shelf can be presented three different situations, classified as follows:
1. Positive: when the product is picked up from the shelf.
2. Negative: when the product is taken and then repositioned on the shelf. 3. Neutral : if the hand exceeds the threshold without taking anything.
Figure 3.6: Setting parameters of the shelf zone.
The template matching method has been used to identify and to classify the interactions between the people and the shelf. So, when there is the first contact, the position of the hand in the RGB image is saved, and the same operation occurs when the interaction ends, in order to compare the first image and the final image. If there is a significant correspondence, the interaction is neutral, since there is not an important difference between the first and final image. Otherwise, the interaction can be positive or negative. To identify the type of interaction, the area of the blobs, that is present in the contours, between the two images has been considered.
3.1.2 Retail test
The tests were conducted in two phases. During the first phase the development of the procedure to verify the performances of the system has been realized thanks to the collaboration of Grottini Lab that provided the material and, moreover, allowed to test the system in their laboratory and successively in a real store, partner of Grottini Lab. The collaboration with the partner has been very useful to decide the arrangement of the system, according to functional strategic locations for sales and for the input monitoring.
All the system has been installed on a panel in the suspended ceiling of the store. Each system gives in output a significant amount of data that are stored in a database, so that they can be successively analyzed to extract indicators. The final test in the real store has been realized installing four RGB-D cameras for a time period of three months, in order to obtain significant and real data. The cameras monitored the entrance, the bleach zone, the perfumes zone and the shampoo zone . The choice to put a camera near the entrance allowed to exactly count the number of people who entered the store. The indicators that are useful to evaluate the shopper behavior and that can help the store staff to understand their preferences and finally, to increase the sales, are:
3.1 Shopper Analytics
• Total number of visitors; • Total number of shoppers;
• Number of visitors in a particular zone; • Number of visitors interacting with the shelf; • Number of interactions for each person;
• Number of visitors becoming shoppers (sales conversion); • Average visit time.
Some indicators that consider the interactions can be: • Number of products picked up;
• Number of products relocated on the shelf; • Number of products touched;
• Duration of interactions; • Average interaction time;
• Number of interactions for product and for category.
Figure 3.7: Details of Shopper Analytics roll out phase. (a) Camera installed above shelves of Ferrero’s products. (b) Camera installed on An-gelini’s pharmacy showcases.
During the second phase has been realized a roll out of six months duration. The system has been installed above eleven shelves to analyze the interactions with the Ferrero’s products and at the same time the camera has been also installed on four showcases of Angelini’s pharmacy, figure 3.7.
Figure 3.8: Statistics per day of data collected.
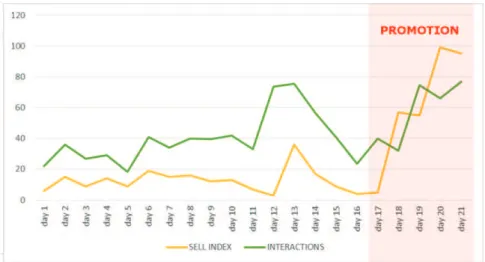
During the observation period the system have collected a lot of data. In figure 3.8 is possible see the daily statistics of data collected. During the 6 months of analysis have been added to the database an average of 10,000 rows per day. In front of the shopping windows of Angelini’s stores in Milan and Rome Termini have been collected an average of 900 passages of which a 15% with a dwell time greater than 5 seconds and 25% with a dwell time between 3 to 5 seconds . From the cameras situated above the shelves, the analysis of data flows has showed a rate of data collection approximately 80-100 interactions per day per shelf and 500 average steps per day per shelf.
Regarding the cameras positioned on Ferrero’s shelves to verify the reliability of the system the data collected has been compared with with sell index. As shown in figure 3.9 the number of interactions, even more consistently, follows the trend of sales in particular in the promotion period where the interactions confirm the increased attention that has been reserved for that selected product.
3.2 Planogram Integrity
Figure 3.9: Interaction and sell intex trends of a selected product during test period.
3.2 Planogram Integrity
The Planogram Integrity solution here proposed is a system, mainly based on a smart camera, able to acquire and to analyse significant parameters of a retail store in order to detect differences from an accepted situation, i.e., an approved planogram. This is a complex task, so it is essential to propose an innovative solution that allows concentrating all the surveys and the necessary measures on a limited number of devices. Moreover, these devices must be of simple and immediate installation and in communication between them. The main idea is to easily and quickly install these smart cameras by using the lower possible amount of connecting cables and by building the camera as a modular structure. These features allow optimizing both the cost of the camera and time and costs for installing the system. The main three novel aspects are:
• The embedded sensor: the battery based camera is a new design very specialised for the purpose here described and it is a quite unique solution on the market with a really strong emphasis on power consumption; image processing procedures, data transmission and representation are totally focused on the general design of having a low cost, high scalable, high resolution, battery based smart vision system.
• The cloud based data infrastructure: retail industry is intrinsically dis-tributed and scalable (store chains have hundreds of stores displaced all over the world with tens of shelves each); at our knowledge this is the first cloud-based system that considers the shelf and its planogram as a part of the IoT world in order to: extract data from a smart sensor, share it, inform end users and perform deep learning on collected data to train the
system to learn new information and to autonomously provide solutions to problems.
• The application: automatic planogram inspection is a really novel appli-cation in the scenario of IoT; it will ensure strong impact on the grocery and retail market by bringing to sell-out improvements and advancing store management state of the art. The proposed architecture automat-ically verifies the compliance of the planogram by simply taking a snap-shot of the shelf. Then, the system provides information of incorrect dis-placements by means of a software GUI (see results section). A periodic intervention of the staff is necessary, usually at opening and/or closing time, since the project is not focused on automatic replenishment, rather on automatic detection using low cost, battery based sensors. Therefore, the adjective "automatic" mainly refers to the change detection approach, performed using only a minimum amount of apriori knowledge (the cor-rect planogram or "first" snapshot). Besides, the system provides a fully automated measure of the correct product displacement in terms of per-centage of planogram compliance.
The embedded system proposed integrates both the camera and the software for image processing and computation of differences all in a low cost architec-ture (of about 200 dollars). With respect to the state of the art, the system is battery based and very easy to install and use as a tool to provide a diagnostic measure over a finite time period (e.g., 2 weeks) and then to define a policy according with store staff. By collecting data from multiple shelves and from different stores receiving only synthetic data (i.e., percentage of planogram compliance), the cloud based architecture of the system is a crucial aspect to make planogram analysis in geographically distributed retail environments. At our knowledge, the proposed solution is the only affordable and scalable solution available on this field: it provides an easy to install, low cost, scal-able and affordscal-able solution to the problem of planogram maintenance, both from the hardware and software point of view. Moreover, the system gives, over an Internet of Things (IoT) cloud based architecture, a lot of additional data not concerning the planogram, e.g., out-of-shelf events promptly notified through SMS and/or mail, thus opening to future works and improvements of the system on the more general aspect of shelf knowledge and understanding.
3.2.1 System architecture and method
According to the main specifications, the aim is to realize a smart camera with the following characteristics:
3.2 Planogram Integrity
(a) Illustrative smart camera scheme.
(b) Two views of the real camera
Figure 3.10: The smart camera
• battery supply;
• low battery consumption (> 6 months of operations) • high resolution images;
• ability to capture images in the infrared frequency (not essential for the purpose of this work);
• transmission via Wi-Fi of information acquired; • interface to connect other additional sensors; • modularity.
Figure 3.10 shows an illustrative scheme, figure 3.10a, which highlights the five different components, and two different views (figure 3.10b) of the smart camera.
Modularity is necessary to allow configuring the smart camera according to the real needs of each specific environment to be monitored. In this way we will be able to optimize the costs of the whole system.
Figure 3.11 makes explicit the communication among the smart camera mod-ules. Components are strictly connected together. Modules are separated mainly for design and revision simplification. An important characteristic of
Figure 3.11: Diagram of the five components with their input/output connections.
NAME DESCRIPTION & TECHNICAL SPECIFI-CATIONS
COM Wi-Fi data transmission module.
MASTER Master module managing the feeding of each module and the IIC interface for external devices, as well as connections to battery, to external power and to another smart camera to achieve stereoscopic vision.
FPGA Image processing module (Field Programmable Gate Array, FPGA).
SENSOR Management module of the optical sensor that ac-quires and processes images detected by the sensor.
OPTICAL Optical module with focal lens.
Table 3.1: Description of each module of the smart camera
the proposed architecture is to be able to easily remove or upgrade a single module without the need of a complete redesign (i.e. a new vision sensor, a communication protocol different from Wi-Fi, a new FPGA and so on). Each of the five modules is described in detail in Table 3.2.1, considering also its technical specifications.
The smart camera described provides images to capture the physical location of products on the shelves. Figure 3.12 shows an example of a frontal image of product positioning. The system knows the planogram, i.e., the better position of the products on the shelves. So to detect planogram integrity, the system automatically matches the approved planogram, stocked in the server, and the pictures from stores. Departing from the image acquired from the acquisition module of the smart camera, the implemented system matches the planogram image (base) with the acquired image and provides a comparison image, cal-culating the differences between the two images. The algorithm compares the images detecting areas with "big" differences in dimension, by subtracting the corresponding pixel of each image and providing an alert when the difference is greater than a fixed threshold. The interest is not in change detection that involves areas smaller than the dimension of a single product, these "small" differences are considered as noise and deleted.
In Figure 3.13 the architecture of the implemented software is presented. As an example of the system we show how it acts when an image is acquired and matched with the accepted planogram. Observing figure 3.14, there are two
3.2 Planogram Integrity
Figure 3.12: Example of planogram used in the retail market and described by an XML file. This format is typical of several planogram de-scription software available in the market. The most famous is Spacemen, distributed by Nielsen.
Figure 3.13: Representation of the implemented image processing algorithm.
images of example: image (a) represents the planogram, while image (b) is the acquired image, clearly referring to the same scene/shelf in different moments. Analysing figure 3.13, the algorithm processes two input images: the image representing the accepted planogram (base planogram) and the image acquired by the smart camera at a later time. It has to establish how the actual image is different from the planogram accepted as correct. Image subtraction is the
Figure 3.14: Comparing two planogram images: (a) planogram image (base planogram) (b) acquired image (actual image) (c) visualization of the difference image.
result of this comparison. Each pixel value of the first image is compared to its corresponding pixel value in the second image. If the difference between the two values exceeds the fixed threshold, the pixel is represented as color difference between the planogram pixel and the reference pixel, while if the difference is less than the threshold, the pixel in the difference image is black, as figure 3.14c shows.
Before saving the difference image, the output of the image subtraction mod-ule is processed by the Filter-by-dimensions modmod-ule, which eliminates, that is puts to black, pixels associated to noise. Then the Show-"Big"-differences mod-ule represents the difference image. Observing the images in figure 3.14 we can see that, in the second image, the planogram has not been completely respected, since there are items in wrong positions.
The algorithm detects the problem and signals the differences by reporting the vertex coordinates of the bounding box of the detected area (showed in figure 3.14c by red lines). Only these geometric information are stored in the sensor-cloud infrastructure described in the next section and used for the statistic layer. A local threshold, implemented in the smart camera, is used to exclude small areas and can be manually configured according to the dimension of the smallest product on the shelf.
3.2 Planogram Integrity
Figure 3.15: The Sensor Cloud Architecture.
The non-black pixels in figure 3.14c represent products that in the acquired image are not in a correct position with respect to the planogram image. As we said, this situation will be promptly notified through an alert. If the difference image is completely black, there is a situation of planogram integrity.
In a real configuration the arrangement of products in the shelf could not be so ordered as in figure 3.14. On the contrary, the recognition of multiple instances could be interfered with many reasons: bad illumination, bad po-sitioning, rotation, translation and, in particular, objects partially occluded. Obviously, in these situations with many differences signalled, the system re-sults less useful than in cases with only few differences, because it requires a robust, supervised intervention of the staff.
The web based architecture can be described as a Sensor-Cloud infrastruc-ture.
Figure 3.15 shows a representation of the Sensor-Cloud infrastructure. Basi-cally every camera is a sensor node that transmits synthetic raw textual data to the cloud over the Wi-Fi connection. So, each camera communicates with the cloud architecture by means of a Wi-Fi transmission data. Data can be processed through different devices (smartphone, tablet, or notebook).
In the proposed application every node (smart camera) is a sensor able to send synthetic data to the cloud. The cloud based web application allows to:
in the first configuration phase;
• define users at different levels to access statistics and to receive alert (via mail or SMS);
• store data from every node into a database to allow detailed analytic reports;
• define alert threshold as a maximum level of planogram errors;
• send alerts via mail or SMS when the alert level of planogram errors is reached;
• compare data coming from different categories / different stores.
All the software is provided as a service and is fully developed in Php lan-guage, using a MySQL DBMS. The reporting system is based on Spago BI. An example of analytic report interface is reported in the next section.
3.2.2 Description of experiments
In the experimental phase, the camera was fixed at 2 meters above the floor at a distance of 3.5m with respect to the centre of the shelf. The maximum visualization area was of 1.8m x 3.2m, wider than the height of the shelf (1.5m). This experimental set-up is showed in figure 3.16. The camera is in a fixed central position and in the experimental phase have not tested the performances of the system by rotating or translating the camera.
Tests were performed in two real stores in Italy both in the diaper shelves. The computational time to elaborate differences between 1280x960 images is of about 760 msec.
We measured the power consumption of each board in idle state (Pidle) and at full load (Pmax), i.e., with the radio transmitting, the camera acquisition and the algorithm running. For the shelf monitoring application here described, it is reasonable to assume that, with a monitoring period of one minute every day, the smart camera powered by 2 C batteries (Long-Life Alkaline, Size C, 1.5 Volts, 7000 mAh), will last for about one year. Indeed, the camera and the algorithm can run just once a day, usually just before the store opening time, therefore the board will be on for less than 2 minutes every day (considering a frame rate of 1 frame per day, the start-up time, the elaboration time and the data transmission via Wi-Fi).
Table 3.2 reports different consumption tests to prove the efficiency of the actual choice. The duration of the battery results inversely proportional to the resolution of the image. We took into account only image resolution for two main reasons: i) time parameters are not very important because our system
![Figure 2.2: The prototype sensor mat with 4 grids and 2 layers [2].](https://thumb-eu.123doks.com/thumbv2/123dokorg/2972226.27413/30.892.253.609.106.569/figure-prototype-sensor-mat-grids-layers.webp)