A Metabolomics Signature Linked
To Liver Fibrosis In The Serum Of
Transplanted Hepatitis C Patients
Ainara Cano
1, Zoe Mariño
2, Oscar Millet
3,4, Ibon Martínez-Arranz
1, Miquel Navasa
2,
Juan Manuel Falcón-Pérez
3,4, Miriam Pérez-Cormenzana
1, Joan Caballería
2, Nieves Embade
3,
Xavier Forns
2, Jaume Bosch
2, Azucena Castro
1& José María Mato
3Liver fibrosis must be evaluated in patients with hepatitis C virus (HCV) after liver transplantation because its severity affects their prognosis and the recurrence of HCV. Since invasive biopsy is still the gold standard to identify patients at risk of graft loss from rapid fibrosis progression, it becomes crucial the development of new accurate, non-invasive methods that allow repetitive examination of the patients. Therefore, we have developed a non-invasive, accurate model to distinguish those patients with different liver fibrosis stages. Two hundred and three patients with HCV were histologically classified (METAVIR) into five categories of fibrosis one year after liver transplantation. In this cross-sectional study, patients at fibrosis stages F0-F1 (n = 134) were categorised as “slow fibrosers” and F2-F4 (n = 69) as “rapid fibrosers”. Chloroform/methanol serum extracts were analysed by reverse ultra-high performance liquid chromatography coupled to mass spectrometry. A diagnostic model was built through linear discriminant analyses. An algorithm consisting of two sphingomyelins and two phosphatidylcholines accurately classifies rapid and slow fibrosers after transplantation. The proposed model yielded an AUROC of 0.92, 71% sensitivity, 85% specificity, and 84% accuracy. Moreover, specific bile acids and sphingomyelins increased notably along with liver fibrosis severity, differentiating between rapid and slow fibrosers.
Liver cirrhosis is the 14th most common cause of death all over the world and the 4th in central Europe. It leads to
1.03 million deaths per year in the world1, and 170,000 deaths per year in Europe2. Hepatitis C virus (HCV) is the
leading cause of cirrhosis and liver transplantation (LT)3. Besides, graft infection in viremic patients is universal
after liver LT and the most frequent reason for graft loss and reduced patient survival after LT4. Nevertheless, the
rate of fibrosis progression in transplant recipients is variable and, although approximately 70% present slowly progressive disease, some evolve rapidly to significant fibrosis5.
Historically, liver biopsy has been considered to be the gold standard to evaluate most cases of liver disease. Yet, it is well known that this procedure has several limitations, including intraobserver and interobserver var-iation, the morbidity associated to this invasive technique, and its elevated cost. Besides, sampling variability of liver biopsy may be a problem in individuals with rapid fibrosis progression6. All these evidences make crucial the
development of new accurate, non-invasive methods that allow repetitive examination of the patients to detect fibrosis in earlier stages in order to adopt therapeutic decisions7.
Non-invasive methods rely on two different approaches; those that are either based on the quantification of biomarkers in serum or on the measurement of liver stiffness7, 8. Serum markers are becoming increasingly useful
in the diagnosis of liver fibrosis. Some of them include AST to Platelet Ratio (APRI), Forns index, MP3, Fibrosis Probability Index (FPI), Lok index, Gotebörg University Cirrhosis Index (GUCI), Virahep-C model Fibroindex, FIB-4, HALT-C, Enhanced Liver Fibrosis score
®
(ELF), Fibrotest®
, Hepascore®
, Fibrometer®
, and FIBROSpect II®
. All these tests are valuable in the exclusion of advanced fibrosis but, together with liver biopsy, do not distin-guish well early and intermediate stages of fibrosis9, 10. As revised11, 12, classical imaging proceduresultrasonogra-phy (U/S), computed tomograultrasonogra-phy (CT), and magnetic resonance imaging (MRI) are used in clinical practice for
1OWL, Parque Tecnológico de Bizkaia, Derio, 48160, Bizkaia, Spain. 2Liver Unit, Hospital Clínic, Centro de
Investigación Biomédica en Red de Enfermedades Hepáticas y Digestivas (CIBERehd); Institut d’Investigacions Biomediques August Pi Sunyer (IDIBAPS), Barcelona, Spain. 3Metabolomic Unit, CIC bioGUNE, CIBERehd, Parque
Tecnológico de Bizkaia, Derio, 48160, Spain. 4Ikerbasque, Basque Foundation for Science, Bilbao, Bizkaia, Spain.
Correspondence and requests for materials should be addressed to A.C. (email: [email protected]) Received: 27 March 2017
Accepted: 11 August 2017 Published: xx xx xxxx
www.nature.com/scientificreports/
the detection of advanced liver disease. Transient elastography (TE), Fibroscan
®
, is probably the most widely used non-invasive method in Europe, however, it has limited applicability in case of obesity or under limited operator experience. Recent techniques such as 3-D magnetic resonance (MR) elastography are currently used only for research purposes since they are too costly and time-consuming13–15.HCV infection induces liver fibrosis by complex and not well-understood molecular mechanisms16. When
HCV infects the liver, it increases lipogenesis and decreases lipid degradation by stimulating lipid droplet syn-thesis and diminishing very low density lipoprotein (VLDL) assembly and secretion into the blood stream at an advanced stage of infection17. The synthesis of lipoproteins is one of the key functions of the liver, therefore,
sev-eral liver alterations are mirrored in the serum metabolome and constitute potential drug targets and diagnostic clues for liver fibrosis. An elegant study from Kotronen et al. demonstrated that the composition of most plasma lipids and the activity of a number of enzymes are correlated in the liver18. Serum metabolic profiling strategies
are being carried out to learn more about the biochemical pathways involved in disease19–22. Moreover, they are
aimed to diagnose any pathological state or, even detect its presence before it appears23. In fact, plasma lipid
profiling has already been applied to understand liver pathophysiology, and to identify biomarkers for fibrosis in mice24, hepatotoxicity25, hepatocellular carcinoma (HCC)26–28, non-alcoholic fatty liver disease (NAFLD)21, 29–31,
and idiopathic non-cirrhotic portal hypertension32, 33. Even to predict survival in patients with decompensated
cirrhosis34 and to disclose donor liver biomarkers associated with early allograft dysfunction35. Lately, some
stud-ies have suggested the potential applicability of metabolomics to investigate organ transplantation35–37, although
applying metabolomics in LT is still in its beginnings38–40.
In this study, a predictive metabolomics signature linked to liver fibrosis severity has been found in patients with HCV after transplantation. Rapid (F2-F4) and slow fibrosers (F0-F1) are accurately classified with an algorithm consisting of four lipid metabolites, two sphingomyelins (SM): SM(d18:2/16:0) and SM(38:1); SM(d18:1/20:0) + SM(16:1/22:0) and two phosphatidylcholines (PC): PC(16:0/16:0), and PC(16:0/18:0). The levels of glycocholic acid (GCA), taurochenodeoxycholic acid (TCDCA), SM(d18:0/18:0), and SM(d18:0/14:0) increased very significantly along with the severity of liver fibrosis and differentiate between rapid and slow fibro-sers in the univariate and in the multivariate analyses applied. In contrast, the ratio of branched-chain amino acids (BCAA) to aromatic amino acids (ArAA) decreased in rapid fibrosers. The proposed lipid signature will aid to learn about the molecular mechanisms leading to fibrosis after LT and to generate novel, precise, non-invasive clinical tools.
Results
Characteristics of the cohorts.
Two hundred and three HCV-infected patients were biopsied and clas-sified into five categories of fibrosis one year after transplantation by the validated semi-quantitative METAVIR fibrosis score: F0 (n = 81), F1 (n = 53), F2 (n = 41), F3 (n = 22), and F4 or cirrhosis (n = 6). Clinical, biochem-ical, and liver histology data obtained from the study participants are summarized in Table 1. All patients were Caucasian and the average recipient age was higher than donor age (66 and 47, respectively). In general, there were more men recipients and donors, except for cirrhotic patients, which were 33.3%. As expected in the studiedF0 (n = 81) F1 (n = 53) F2 (n = 41) F3 (n = 22) F4 (n = 6) Age (years) 64.8 ± 8.5 65.6 ± 7.5 64.2 ± 9.1 68.4 ± 7.3 67.5 ± 8.9 Donor age 42.7 ± 16.7 46.9 ± 18.2 50.3 ± 18.5 45.9 ± 17.5 48.8 ± 15.5 Male (%) 67.9 60 68.3 54.5 33.3 Donor: male (%) 58.8 72 68.3 81.8 83.3 Aetiology (cases HCV + alcohol) 20 13 10 5 1 Hepatocellular carcinoma (No.) 47 27 22 15 4
Ischemia time (min.) 385 342 399 285 259 Genotype HCV 1a:1b:2:3:4 (%) 9:84:1:4:1 10:81:0:8:0 8:79:3:8:3 5:90:0:5:0 0:100:0:0 Allograft rejection (No.) 18 18 11 4 0 ALT 12 M (U/l) 113 ± 120 144 ± 194 148 ± 111 173 ± 132 183 ± 68 GGT 12 M (U/l) 234 ± 400 313 ± 518 365 ± 404 651 ± 1013 970 ± 863 Alkaline phosphatase 12 M (mg/dl) 391 ± 407 370 ± 271 466 ± 611 683 ± 590 784 ± 234 Bilirubin 12 M 1.2 ± 1.1 1.1 ± 0.7 1.5 ± 1.1 2.0 ± 1.8 3.2 ± 3.3 Viral load (Log) 12 M 6.2 ± 0.7 6.1 ± 0.7 6.3 ± 0.6 6.0 ± 1.4 6.5 ± 0.3 Diabetes type II 12 M
(% cases) 50.6 47.2 73.2 68.2 83.3
Arterial hypertension
12 M (% cases) 39.5 35.8 46.3 50.0 83.3
Table 1. Patient and donor clinical data. Data is expressed as mean ± standard deviation or in percentage. HCV: hepatitis C virus. 12 M: 12 months after liver transplantation. Alanine aminotransferase (ALT), gamma-glutamyl transpeptidase (GGT).
geographic area, the most frequent virus genotype was 1b. Overall, 57% patients of the cohort (n = 118) had diabetes and received appropriate treatment at one year after LT. Indeed, this percentage was significantly higher in patients classified as rapid fibrosers (72.5%) when compared with slow fibrosers (50.4%), p = 0.002. Serum from HCV liver recipients was obtained at one year after LT for metabolite measurement and histopathology concordance. The study was approved by the Barcelona Clínic Hospital ethics committee and all patients signed informed written consent.
Four lipids accurately distinguish between rapid and slow fibrosers.
A total of 444 metabolites were identified and semi-quantified in the serum of the studied patients. These compounds included 22 amino acids (AA), 45 non-esterified fatty acids (NEFA), 19 oxidised fatty acids, 11 acylcarnitines, 12 diacylglycer-ols, 69 triacylglycerols (TAG), 14 cholesteryl esters (ChoE), 12 bile acids (BA), 203 glycerophospholipids, and 37 sphingolipids. Among them, four lipid species were combined in an algorithm that differentiates between rapid and slow fibrosers. Based on this model, rapid and slow fibrosers were accurately classified with two SM: SM(d18:2/16:0), and SM(38:1): SM(d18:1/20:0) + SM(16:1/22:0), and two PC: PC(16:0/16:0), and PC(16:0/18:0). This classification model yielded an AUROC of 0.92, 71% sensitivity, 85% specificity, 84% accuracy, 67% negative predictive value, 84% positive predictive value, 4.73 positive likelihood ratio, and 0.34 negative likelihood ratio (Fig. 1). Individual fold-changes and t-test p-values of these four lipid species are shown in Table 2.Orthogonal partial least squares discriminant analysis performance.
A supervised orthogonal partial least squares discriminant analysis (OPLS-DA) was created in order to identify possible biomarkers dis-criminating between rapid and slow fibrosers. Two clusters are well differentiated, as patients developing rapid fibrosis lie down on the right hand side of the principal component t1 while slow fibrosers are positioned on the left hand side (Fig. 2). The performance of the OPLS-DA model was evaluated using the predictive R2X andR2Y (goodness of fit) and Q2Y (goodness of prediction) parameters. This model showed (1 + 2 + 0) components,
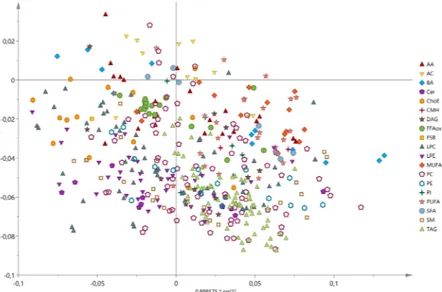
R2X = 0.32, R2Y = 0.502, and Q2 = 0.27. The loadings plot (Fig. 3) displays the variables responsible for the
pat-terns seen among the samples. Metabolites lying further away from the plot origin have stronger impact on the model; furthermore, variables positively correlated are grouped together, while variables negatively correlated are positioned on opposite sides of the plot origin, in diagonally opposed quadrants.
The metabolites that most discriminate between rapid and slow fibrosers in the multivariate analysis (with the highest loadings absolute values) were mainly BA, PC, lysophosphatidylcholines (LPC), and SM (Supplementary Table S1, sheet “Supp. Table A. OPLS”).
Metabolomics fingerprint of liver fibrosis.
As well as multivariate analyses, univariate studies were per-formed. The advantages of using both univariate and multivariate approaches in data mining have been recently reviewed41. Both approaches are complementary and their results do not necessarily coincide.Analysis of variance (ANOVA) heatmap displays the fold-changes and p-values for all the fibrosis stages as compared to their immediate lower fibrosis degree (Fig. 4 and Supplementary Table S1, sheet “Supp. Table B. Figure 1. Prediction performance by the area under receiver operating characteristic (AUROC) curve analysis. Metabolic discrimination between rapid (F2-F4) and slow (F0-F1) fibrosers one year after liver transplantation has yielded an AUROC of 0.92, sensitivity 71%, specificity 85%, accuracy 84%, negative predictive value 67%, positive predictive value 84%, positive likelihood ratio 4.73, and negative likelihood ratio 0.34. Linear discriminant analysis has been carried out through LOOCV. Associated ROC curves for the estimation (solid line), and validation (dotted line) data sets. The optimum cut-off point for the estimation group (0.54) was defined as that at which average diagnostic accuracy was a maximum.
www.nature.com/scientificreports/
ANOVA”). Despite the reduced number of significant metabolites, this figure underscores a metabolomics sig-nature for each fibrosis degree defined by the fold-changes of the relative metabolite levels in each comparison.
When comparing the levels of metabolites between each fibrosis degree and its immediate previous one by Tukey post-hoc analysis, the metabolic profiles of F2 and F1 patients presented the highest number of signifi-cant metabolites of all the fibrosis cohorts. The highest significances (p < 10−3) were found for LPC(20:0/0:0),
ChoE(20:5), and ChoE(22:5), whose levels decreased in F2 patients when compared with F1. Next, TCDCA, taurocholic acid (TCA), and PC(16:0/16:0) were the most significant metabolites in F3 patients when compared with F2. Decanoylcarnitine (10:0) and taurodeoxycholic (TDCA), increased in F4 vs. F3 patients. Finally, there were no significant metabolites found in the comparison F1 vs. F0 patient groups.
Pearson correlation coefficients (PCC) were calculated to detect the metabolites whose levels changed in line with the stage of liver fibrosis (Supplementary Table S1., sheet “Supp. Table B. ANOVA”). Tyrosine, glutamic acid, threonine, TCDCA, GCA, SM(d18:0/14:0), SM(d18:0/15:0), and SM(d18:0/18:0), nervonic acid, 24:1n-9, 22:3n-x, and LPC(0:0/16:1) increased in parallel with fibrosis stage. In contrast, ceramide (Cer) Cer(d18:1/21:0)
Fast Slow Fold-change log2(fold-change) Student’s t-test (p)
SM(38:1) 0.6 ± 0.2 0.7 ± 0.2 0.9 -0.2 3.89E-03 SM(d18:2/16:0) 0.8 ± 0.2 0.9 ± 0.2 0.9 -0.1 5.07E-02 PC(16:0/18:0) 0.8 ± 0.2 0.8 ± 0.1 1.0 0.0 7.64E-01 PC(16:0/16:0) 1.3 ± 0.3 1.0 ± 0.2 1.2 0.3 2.92E-08 TCDCA 2.7 ± 1.3 1.3 ± 0.9 2.1 1.1 2.92E-12 TCA 3.0 ± 1.8 1.3 ± 1.2 2.4 1.3 3.71E-11 ChoE(18:1) 0.5 ± 0.2 0.6 ± 0.2 0.8 -0.4 2.88E-08 PC(16:0/16:0) 1.3 ± 0.3 1.0 ± 0.2 1.2 0.3 2.92E-08 Tyrosine 0.7 ± 0.1 0.6 ± 0.1 1.2 0.2 4.94E-07 GCA 1.6 ± 0.8 1.0 ± 0.7 1.6 0.6 6.39E-07 SM(d18:0/18:0) 1.1 ± 0.4 0.9 ± 0.3 1.3 0.3 3.96E-05 PC(32:1) 1.4 ± 0.8 1.0 ± 0.4 1.5 0.6 3.97E-05 PC(O-20:0/0:0) 0.3 ± 0.1 0.3 ± 0.1 0.8 -0.3 4.54E-05 PC(20:0/0:0) 0.4 ± 0.1 0.5 ± 0.1 0.9 -0.2 4.67E-05 SM(d18:0/14:0) 1.1 ± 0.5 0.9 ± 0.3 1.2 0.3 6.05E-04
Table 2. Fold-changes and p-values of the lipid species combined in an algorithm that differentiates between rapid and slow fibrosers (first four compounds); and of the most significant metabolites discriminating between rapid and slow fibrosers by unpaired Student’s t-test (or by Welch’s t test where unequal variances). Data is expressed as mean ± standard deviation. Sphingomyelin (SM), phosphatidylcholine (PC),
taurochenodeoxycholic acid (TCDCA), taurocholic acid (TCA), cholesteryl ester (ChoE), glycocholic acid (GCA).
Figure 2. OPLS scores plot of the serum metabolic profiles in patients with hepatitis C virus (HCV). Supervised OPLS scores plot of transplanted patients with rapid (black triangles) and slow (circles) fibrosis progression. Model diagnostics (1 + 2 + 0), R2X = 0.32, R2Y = 0.502, Q2 = 0.27.
Figure 3. OPLS loadings plot of the serum metabolic profiles in patients with hepatitis C virus (HCV). Supervised OPLS loadings plot of the metabolite species discriminating between rapid (F2-F4; n = 69) and slow (F0-F1; n = 134) fibrosers. Data related to these metabolites is detailed in Supplementary Table S1, sheet “Supp. Table A. OPLS”.
Figure 4. Metabolomics signature in the serum of transplanted patients with HCV. Heatmaps represent fold-changes and p-values derived from the comparison of the relative metabolite levels in serum samples among all fibrosis stage (ANOVA) and between a specific fibrosis degree and its immediate lower fibrosis degree (Tukey’s post hoc test) (i.e., F4/F3, F3/F2, F2/F1, and F1/F0). Rapid (F2-F4; n = 69) were compared with slow (F0-F1; n = 134) fibrosers with unpaired Student’s t test (or Welch’s t test where unequal variances were found). For each comparison, log transformed ion abundance ratios are depicted, as represented by the scale. Darker green and red colours indicate higher drops or elevations of the metabolite levels, respectively. Grey lines correspond to significant fold-changes of individual metabolite levels, darker grey colours have been used to stress higher significances (p < 0.05, p < 0.01 or p < 0.001). It is relevant to highlight that lipid metabolites present in this picture have been ordered according to the carbon number and unsaturation degree of their acyl chains. Data represented in the figure is detailed in Supplementary Table S1.
www.nature.com/scientificreports/
and Cer(d18:2/23:0), ursodeoxycholic acid (UDCA), and the ratios BCAA to ArAA, and BCAA to tyrosine (BTR) decreased along with the fibrosis stages of the studied patients (absolute PCC > 0.98).
When comparing the metabolome of rapid and slow fibrosers by unpaired Student’s t-test (or by Welch’s t test where unequal variances were found) metabolites belonging to each chemical group did not display the same fold-change trend (Fig. 4) (i.e., the levels of some PC increased in rapid fibrosers vs. slow fibrosers while some others, decreased). The most noteworthy metabolites in this comparison were TCDCA, p = 2.92 10–12;
TCA, p = 3.71 10–11; CGA, p = 6.39 10–7; ChoE(18:1), p = 2.88 10–8; PC(16:0/16:0), p = 2.92 10–8, and amino acid
tyrosine, p = 4.94 10–7 (Supplementary Table S1, sheet “Supp. Table C. t test”, and volcano; Supp. Figure S1). The
levels of these compounds were increased in rapid fibrosers when compared to slow fibrosers except ChoE(18:1), which decreased. A number of metabolites, such as TCA, TCDCA, GCA, ChoE(18:1), PC(16:0/16:0), PC(32:1), PC(20:0/0:0), PC(O-20:0/0:0), SM(d18:0/14:0), and SM(d18:0/18:0) were found also significant in the OPLS-DA. Fold-changes and p-values of these metabolites are summarized in Table 2.
In summary, TCDCA, GCA, and SM(d18:0/18:0), which rose very significantly along with the severity of liver fibrosis, were the metabolites that better discriminate between rapid and slow fibrosers in both, univariate and multivariate analyses (Fig. 5, box plots).
Discussion
We have found a serum metabolomics signature linked to liver fibrosis one year after liver transplantation. In this cross-sectional study, a total of 444 metabolites were semi-quantified in HCV patients with different stages of fibrosis. Among them, only four lipid species, two sphingomyelins and two phosphatidylcholines, were combined in an algorithm that differentiates between rapid and slow fibrosers. This classification model yielded an AUROC of 0.92, 71% sensitivity, 85% specificity, and 84% accuracy.
At present, there is an elevated number of valuable techniques to detect liver fibrosis, but only a few are focused on HCV recurrence after liver transplantation8, 10. The diagnostic accuracy of the current model is
excel-lent as compared to several tests aimed to predict development of severe recurrence after liver transplantation: ELF 0.827, IP-10 0.687, Fibroscan 0.760, APRI 0.833, and FIB-4 0.808 in 72 patients with HCV7. Additionally,
the AUROC for the ELF test performed in 65 patients of the studied cohort (33 patients rapid fibrosers and 32 slow fibrosers) was 0.687, with an accuracy of 0.69 and a cut-off of 10.83. In addition, some imaging techniques have limited applicability in case of obesity and limited operator experience, such as transient elastography, Figure 5. Boxplots of the relative concentrations for the significantly altered metabolites and ratios in serum of patients considering t test, Pearson correlation coefficient and multivariate analyses. Data is shown in the Supplementary Table S1. X axes represent the fibrosis degree (METAVIR Score), Y axes represent relative units of the semiquantified metabolites or ratios. The bar plots show the normalized values. The boxes range from the 25% and the 75% percentiles; the 5% and 95% percentiles are indicated as error bars; single data points are indicated by dots. Medians are indicated by horizontal lines within each box.
Fibroscan
®
, which is considered when stratifying patients for antiviral treatment7. This technique made itpossi-ble to find two different patterns of fibrosis progression in patients with HCV one year after liver transplantation, with AUROCs of 0.92 and 0.80 in the estimation and in the validation groups, respectively42. Though, the number
of patients included in the study was small (84 in total). In any case, each method targets different aspects of the same disease and then, the combination of some of these markers, occasionally, would improve the quality of the diagnosis.
Our metabolomics test was developed with serum from 203 patients from the Clínic Hospital in Barcelona (Spain). This approach is very powerful due to the strict follow-up of the volunteers of the study. All the patients were histologically diagnosed; and therefore, the study comprises the inherent limitations of liver biopsy. We have used the leave-one-out cross-validation (LOOCV) because it is an exhaustive method, i.e. it learns and tests on all possible ways to divide the original sample into a training and a validation set. LOOCV is a particular case of leave-p-out cross-validation with p = 1. Therefore, as it trains and tests on every point, LOOCV is as accurate to obtain approximations of generalization as splitting the original dataset into two-parts (training and testing), and using the testing score as a generalization measure43, 44. On the other hand, our test could be enhanced by
including more patients from many other hospitals. Therefore, the accuracy of the method would allow for the more homogenous use of the discovered biomarkers and then, simplify their introduction into clinical practice.
We have observed a characteristic profile of the circulating levels of amino acid and lipid metabolites in all the METAVIR fibrosis stages in patients with HCV. The most relevant chemical groups distinguishing between rapid and slow fibrosers after liver transplantation were bile acids and sphingomyelins. Bile acids accumulate during cholestasis and may induce hepatocyte apoptosis45. However, each bile acid species may involve different
biolog-ical effects. For example, taurochenodeoxycholic acid, which increased in the serum of rapid fibrosers, has been described as potential biomarker for liver cirrhosis in hepatitis B virus (HBV) patients46. This bile acid has been
shown to activate PI3K-dependent survival pathways, which prevent their otherwise inherent toxicity and had antagonistic actions on pulmonary fibrosis in mice47. Some specific sphingomyelins rose very significantly along
with liver fibrosis severity in the studied patients after liver transplantation. This result may support the proposed involvement of acidic sphingomyelinase, a known regulator of death receptor and stress-induced hepatocyte apoptosis, in liver fibrogenesis48. Indeed, sphingolipids are associated with liver fibrosis progression and poor
treatment outcome in HCV49.
Lysophosphatidylcholines have been found dysregulated in association with increased mortality and severity of disease reflecting hepatocyte cell death in decompensated cirrhosis34. In our case, the levels of PC(20:4/0:0),
PC(22:6/0:0), were increased in the serum of rapid fibrosers when compared with slow fibrosers; in contrast, the levels of PC(18:2/20:4), and PC(40:8) decreased. Also, these compounds were altered in the plasma of rats with induced fibrosis50. However, their levels decreased by chronic exposure to carbon tetrachloride and increased
when exposed to lomustine. This difference may be due to many factors, such as the inherent lipid composition of each animal species and the fact that, depending on the insult, fibrosis may occur in different areas of the hepatic lobule shifting dissimilar metabolic pathways51–54.
In 2006, Zhang and colleagues described an algorithm to discriminate HCV patients with advanced liver fibrosis consisting on eight amino acids that reached an AUC of 0.92 ± 0.0455. This study only included 53 patients
with fibrosis stages F3 and F4 vs. F0/F1-F2. In contrast, in our study, we differentiate between F0, F1 and F2-F4. On the other hand, the so-called Fischer-ratio56, BCAA/ArAA ratio and BTR ratio decreased in line with fibrosis
severity in transplanted patients. It is well known that during hepatic failure, plasma levels of BCAA decrease and those of ArAA increase56. The BTR ratio has been described to be both a prognostic factor for early HCC and a
predictive factor for recurrence57. According to this study, survival rates were significantly higher in patients with
high baseline BTR. This affirmation is coherent with our results since the patients with advanced fibrosis after liver transplantation have smaller survival expectations and may develop HCC58.
Wondering if the signature found for the different fibrosis stages in patients with HCV after transplant could have some similarities to that of non-transplanted patients, we compared the presented results with those obtained in a similar study with 311 non-transplanted HCV patients (manuscript under preparation). Concretely, the levels of taurochenodeoxycholate, taurocholate, glycocholate, tyrosine and PC(16:0/16:0) phosphatidylcho-line were found very significantly increased in F2-F4 patients when compared to F0 and F1 in the serum of both, transplanted and non-transplanted patients. From this study we can conclude that, although there are a number of similarities in the metabolic profiles of the different fibrosis stages, the multivariate biomarker present in the model for transplanted patients is so specific that it is not suitable for other pathologic states. All this new data on fibrosis and metabolomics will help to increase our understanding of the molecular events arisen and to develop novel non-invasive tests for other pathologies which involve fibrosis in their progression steps, such as HBV or NAFLD20, 29.
The current approach does not accomplish absolute quantification of the analytes due to causes inherent to the UHPLC-MS technique. As in our previous publications29 we did monitor the reproducibility of our assays, while
taking steps to ensure that all data points included in the analysis were within the linear detection range of the platforms. Moreover, we previously confirmed that proton nuclear magnetic resonance (1H-NMR) is appropriate
for depicting the metabolism of liver cirrhosis induced by HCV19. Yet, both techniques are complementary, i.e.,
UHPLC-MS is more sensitive and best suited for lipidomics analysis, while NMR is quantitative and focuses in central metabolism. It is our belief that the synergy of both strategies would improve the detection and absolute quantification of the found biomarkers.
Conclusion
A distinctive metabolic fingerprint has been found in patients with different stages of fibrosis after liver transplan-tation. The diagnostic accuracy of this non-invasive technique is excellent compared with the most widely used
www.nature.com/scientificreports/
and validated tests and open new possibilities to avoid invasive procedures. We are getting closer to a time when liver biopsy will be history.
Study design.
Patients. A total of 203 patients with HCV recurrence after LT were considered for the study in the Clínic Hospital, Barcelona, Spain. Exclusion criteria were: graft or patient survival shorter than 12 months after LT, combined kidney and LT, HBV or human immunodeficiency virus coinfection, presence of ascites, body mass index (BMI) over 33, chronic graft rejection, biliary tract complications, veno-occlusive disease, de novo autoimmune hepatitis, and recurrence of HCC during the first year after LT42. Patients were managed accordingto previously published protocols42. Liver biopsies and sera were collected; routine clinical analyses were
per-formed. No patient received antiviral therapy at the moment of blood extraction. Most of patients with absent fibrosis did not receive relevant medication. The most common therapies in cirrhotic patients were diuretics, beta-blockers, or pain-killers.
One year after, LT patients were classified into five study groups using the METAVIR fibrosis staging system, which classifies liver fibrosis as absent (F0), restricted to the portal tract (F1), periportal or portal-portal septa with intact architecture (F2), bridging fibrosis with architectural distortion but no obvious cirrhosis (F3), and cirrhosis (F4)59. The minimal acceptable size of liver biopsy was considered 5 mm.
Patients were classified as “slow fibrosers” if they presented absent or minor fibrosis (fibrosis stages F0-F1) and as “rapid fibrosers” whether they presented fibrosis extending beyond the portal tracts (F2-F4). The study protocol was approved by the Investigation and Ethics Committee of the Hospital Clínic of Barcelona according to the ethical guidelines of the revised 1975 Declaration of Helsinki. Informed consent from all patients included in the study was obtained.
Metabolomics analysis.
Extraction of lipids and UHPLC-MS analysis. Serum samples were ana-lysed following the procedure described by Barr et al.29, 60. Briefly, AA analysis was combined with twosepa-rate UHPLC-MS based platforms analysing methanol and chloroform/methanol serum extracts. Lipid and AA nomenclature follows the LIPID MAPS convention, http://www.lipidmaps.org/, and the Human Metabolome Database (HMDB), http://www.hmdb.ca, respectively.
For fatty acyls, BA, steroids and lysoglycerophospholipids profiling proteins were precipitated from 75 μl of defrosted serum samples by adding 300 μl of methanol in 1.5 ml microtubes at room temperature. The metha-nol used for extraction was spiked with metabolites not detected in unspiked human serum extracts (internal standards). After brief vortex mixing samples were incubated overnight at -20 °C. Supernatants were collected after centrifugation at 16,000 × g for 15 minutes, dried and reconstituted in methanol before being transferred to vials for UHPLC-MS analysis. Aliquots of 10 μl from the methanol extract were transferred to microtubes and derivatised for amino acid analysis61.
For glycerolipids, cholesteryl esters, sphingolipids and glycerophospholipids profiling, 10 μl of serum extracts were mixed with 10 μl of sodium chloride (50 mM) and 110 μl of chloroform / methanol (2:1) in 1.5 ml microtubes at room temperature. The extraction solvent was spiked with metabolites not detected in unspiked human serum extracts. After brief vortex mixing, samples were incubated for 1 hour at -20 °C. After centrifugation at 16,000 × g for 15 minutes, the organic phase was collected and the solvent removed. The dried extracts were then reconsti-tuted in 100 μl of acetronitrile/isopropanol (1:1), centrifuged (16,000 × g for 5 minutes), and transferred to vials for UHPLC-MS analysis.
Randomized duplicate sample injections were performed, and, additionally, two different types of quality con-trol (QC) samples were used to assess data quality62. QC are reference serum samples, which were evenly
distrib-uted over the batches and extracted and analysed at the same time as individual samples. QC calibration samples were used to correct the different response factors between and within batches and QC validation samples were used to assess how well data pre-processing procedure improved data quality63.
Data pre-processing.
In order to avoid systematic bias in the analysis, all samples were randomized prior to the metabolite extraction procedure and analysed blinded to the clinical data. Data pre-processing was performed following the procedure described before60. In brief, data obtained were pre-processed with the TargetLynxappli-cation manager for MassLynx (Waters Corp., Milford, MA). LC-MS features were identified prior to the analysis, either by comparison of their accurate mass spectra and chromatographic retention time (Rt) with those of avail-able reference standards or, where these were not availavail-able, by accurate mass MS/MS fragment ion analysis. Intra and inter-batch normalization was based on multiple internal standards and pool calibration samples approach63.
Data pre-processing generated a list of chromatographic peak areas for the metabolites detected in each sam-ple injection. An approximated linear detection range was defined for each identified metabolite, assuming simi-lar detector response levels for all metabolites belonging to a given chemical class represented by a single standard compound.
Statistical Analyses.
Metabolite relative concentration values were balanced and trend corrected following the procedure described by Martínez-Arranz et al.63. Principal Components Analysis (PCA) (data not shown)and orthogonal projection to latent structures (OPLS) multivariate analyses were applied by exporting the nor-malised data to the SIMCA-P+ software package (version 14.1 Umetrics, Sweden).
To find a statistical model to differentiate between rapid (F2-F4) and slow fibrosers (F0-F1) a linear discri-minant analysis (LDA) MASS library from R Software (R version 3.2.0; R Development Core Team, 2010; http:// cran.r-project.org) was used and LOOCV was performed to confirm the model. Box-Cox transformations were applied to the biomarker metabolite levels for correcting non-normally distributed data and used to calculate the classification algorithm. The diagnostic accuracy of the model to identify patients with rapid or slow fibrosis progression one year after liver transplantation was assessed using the AUROC curve. The optimal score cut-off
values were selected on the basis of sensitivity, specificity, positive predictive value, negative predictive value, and positive, and negative likelihood ratios to identify significant fibrosis. The optimum cut-off point for the estima-tion group (0.54) was defined as that at which average diagnostic accuracy was a maximum.
To define specific patterns associated with disease progression, patients histologically diagnosed with F0, F1, F2, F3, and F4 fibrosis stages were compared with one-way ANOVA and with Tukey post-hoc analysis. Univariate statistical analyses were also performed calculating group percentage changes and unpaired Student’s t-test p-value (or Welch’s t-test where unequal variances were found) for the comparison of rapid and slow fibrosers. In addition, Pearson correlation coefficient was calculated to detect the metabolites whose levels change in line with fibrosis progression. These analyses were performed using R with MASS, xlsx, robustbase and pwr packages.
Data are represented as mean ± SD unpaired Student’s t-test p-value (or Welch’s t-test where unequal variances were found). Significance was considered from a p-value < 0.05.
References
1. Lozano, R. et al. Global and regional mortality from 235 causes of death for 20 age groups in 1990 and 2010: a systematic analysis for the Global Burden of Disease Study 2010. Lancet CN 380, 2095–2128 (2012).
2. Blachier, M., Leleu, H., Peck-Radosavljevic, M., Valla, D.-C. & Roudot-Thoraval, F. The burden of liver disease in Europe: A review of available epidemiological data. J. Hepatol. 58, 593–608 (2013).
3. Cross, T. J. S. et al. A simple, noninvasive test for the diagnosis of liver fibrosis in patients with hepatitis C recurrence after liver transplantation. J. Viral Hepat. 17, 640–649 (2010).
4. Garcia-Retortillo, M. et al. Hepatitis C virus kinetics during and immediately after liver transplantation. Hepatology 35, 680–687 (2002).
5. Forman, L. M., Lewis, J. D., Berlin, J. A., Feldman, H. I. & Lucey, M. R. The association between hepatitis C infection and survival after orthotopic liver transplantation. Gastroenterology 122, 889–896 (2002).
6. Bedossa, P., Dargere, D. & Paradis, V. Sampling variability of liver fibrosis in chronic hepatitis C. Hepatology 38, 1449–57 (2003). 7. Crespo, G. et al. Early non-invasive selection of patients at high risk of severe hepatitis C recurrence after liver transplantation.
Transpl. Infect. Dis. 18, 471–479 (2016).
8. European Association for the Study of the Liver & Asociación Latinoamericana para el Estudio del Hígado. EASL-ALEH Clinical Practice Guidelines: Non-invasive tests for evaluation of liver disease severity and prognosis. J. Hepatol. 63, 237–264 (2015). 9. Lurie, Y., Webb, M., Cytter-Kuint, R., Shteingart, S. & Lederkremer, G. Z. Non-invasive diagnosis of liver fibrosis and cirrhosis.
World J. Gastroenterol. 21, 11567–11583 (2015).
10. Martínez, S. M. et al. Noninvasive assessment of liver fibrosis. Hepatology 53, 325–335 (2011).
11. Papastergiou, V., Tsochatzis, E. & Burroughs, A. K. Non-invasive assessment of liver fibrosis. Ann. Gastroenterol. 25, 218–231 (2012). 12. Castera, L. Non-invasive tests for liver fibrosis: EASL Clinical Practice Guidelines and future directions. Hepatol. Int. 10, S501–S502
(2016).
13. Adams, L. A. et al. Hepascore: An accurate validated predictor of liver fibrosis in chronic hepatitis C infection. Clin. Chem. 51, 1867–1873 (2005).
14. Calès, P. et al. A novel panel of blood markers to assess the degree of liver fibrosis. Hepatology 42, 1373–1381 (2005).
15. Fontana, R. J. et al. Relationship of serum fibrosis markers with liver fibrosis stage and collagen content in patients with advanced chronic hepatitis C. Hepatology 47, 789–798 (2008).
16. Syed, G. H., Amako, Y. & NIH, S. A. Public Access. Trends Endocrinol Metab 21, 33–40 (2010).
17. Mirandola, S., Bowman, D., Hussain, M. M. & Alberti, A. Hepatic steatosis in hepatitis C is a storage disease due to HCV interaction with microsomal triglyceride transfer protein (MTP). Nutr. Metab. (Lond). 7, 13 (2010).
18. Kotronen, A. et al. Comparison of lipid and fatty acid composition of the liver, subcutaneous and intra-abdominal adipose tissue, and serum. Obesity (Silver Spring). 18, 937–944 (2010).
19. Embade, N. et al. Metabolic characterization of advanced liver fibrosis in HCV patients as studied by serum 1H-NMR spectroscopy.
PLoS One 11, (2016).
20. Cano, A. & Alonso, C. Deciphering non-alcoholic fatty liver disease through metabolomics. Biochem. Soc. Trans. 42, 1447–1452 (2014).
21. Martínez-Uña, M. et al. Excess S-adenosylmethionine reroutes phosphatidylethanolamine towards phosphatidylcholine and triglyceride synthesis. Hepatology 58, 1296–1305 (2013).
22. Nicholson, J. K., Lindon, J. C. & Holmes, E. ‘Metabonomics’: understanding the metabolic responses of living systems to pathophysiological stimuli via multivariate statistical analysis of biological NMR spectroscopic data. Xenobiotica 29, 1181–1189 (1999).
23. Uto, Y. Recent progress in the discovery and development of stearoyl CoA desaturase inhibitors. Chem. Phys. Lipids 197, 3–12 (2016).
24. Saito, K. et al. Characterization of hepatic lipid profiles in a mouse model with nonalcoholic steatohepatitis and subsequent fibrosis.
Sci. Rep. 5, 12466 (2015).
25. Gonzalez, E. et al. Serum UPLC-MS/MS metabolic profiling in an experimental model for acute-liver injury reveals potential biomarkers for hepatotoxicity. Metabolomics 8, 997–1011 (2012).
26. Barbier-Torres, L. et al. Stabilization of LKB1 and Akt by neddylation regulates energy metabolism in liver cancer. Oncotarget 6, 2509–23 (2015).
27. Nguyen, A., Rudge, S. A., Zhang, Q. & Wakelam, M. J. Using lipidomics analysis to determine signalling and metabolic changes in cells. Curr. Opin. Biotechnol. 43, 96–103 (2017).
28. Gao, R. et al. Serum Metabolomics to Identify the Liver Disease-Specific Biomarkers for the Progression of Hepatitis to Hepatocellular Carcinoma. Nat. Publ. Gr. 1–10 (2015). doi:10.1038/srep18175
29. Barr, J. et al. Obesity-dependent metabolic signatures associated with nonalcoholic fatty liver disease progression. J. Proteome Res.
11, 2521–2532 (2012).
30. Chiappini, F., Desterke, C., Bertrand-Michel, J., Guettier, C. & Le Naour, F. Hepatic and serum lipid signatures specific to nonalcoholic steatohepatitis in murine models. Sci. Rep. 6, 31587 (2016).
31. Alonso, C. et al. Metabolomic Identification of Subtypes of Nonalcoholic Steatohepatitis. Gastroenterology (2017). doi:10.1053/j. gastro.2017.01.015
32. Seijo, S. et al. Metabolomics as a diagnostic tool for idiopathic non-cirrhotic portal hypertension. Liver Int. 36, 1051–1058 (2016). 33. Seijo, S. et al. Metabolomics Discloses Potential Biomarkers for the Noninvasive Diagnosis of Idiopathic Portal Hypertension. Am J
Gastroenterol 108, 926–32 (2013).
34. McPhail, M. J. W. et al. Multivariate metabotyping of plasma predicts survival in patients with decompensated cirrhosis. J. Hepatol.
64, 1058–1067 (2016).
35. Cortes, M. et al. Metabolomics discloses donor liver biomarkers associated with early allograft dysfunction. J. Hepatol. 61, 564–574 (2014).
www.nature.com/scientificreports/
37. Wishart, D. S. Metabolomics: the principles and potential applications to transplantation. Am J Transpl. 5, 2814–2820 (2005). 38. Hrydziuszko, O. et al. Application of metabolomics to investigate the process of human orthotopic liver transplantation: a
proof-of-principle study. OMICS 14, 143–150 (2010).
39. Serkova, N. J. et al. Early Detection of Graft Failure Using the Blood Metabolic Profile of a Liver Recipient. Transplantation 83, 517–521 (2009).
40. Legido-Quigley, C. et al. Bile UPLC-MS fingerprinting and bile acid fluxes during human liver transplantation. Electrophoresis 32, 2063–2070 (2011).
41. Saccenti, E., Hoefsloot, H. J. C. J., Smilde, A. K., Westerhuis, J. A. & Hendriks, M. W. B. M. W. B. Reflections on univariate and multivariate analysis of metabolomics data. Metabolomics 10, 361–374 (2014).
42. Carrion, J. A. et al. Liver stiffness identifies two different patterns of fibrosis progression in patients with hepatitis C virus recurrence after liver transplantation. Hepatology 51, 23–34 (2010).
43. Hand, D. et al. Principles of data mining. Drug safety: an international journal of medical toxicology and drug experience 30, (2001). 44. Witten, I. H. & Frank, E. Data Mining: Practical machine learning tools and techniques. Machine Learning (2005).
45. Patel, T., Roberts, L. R., Jones, B. A. & Gores, G. J. Dysregulation of apoptosis as a mechanism of liver disease: an overview. Semin.
Liver Dis. 18, 105–114 (1998).
46. Yin, P. et al. A metabonomic study of hepatitis B induced liver cirrhosis and hepatocellular carcinoma by using RP-LC and HILIC coupled with mass spectrometry. Mol. Biosyst. 5, 868–876 (2009).
47. Zhou, C. et al. The effects of taurochenodeoxycholic acid in preventing pulmonary fibrosis in mice. Pak. J. Pharm. Sci. 26, 761–765 (2013).
48. Moles, A. et al. Acidic sphingomyelinase controls hepatic stellate cell activation and in vivo liver fibrogenesis. Am J Pathol 177, 1214–1224 (2010).
49. Grammatikos, G. et al. Variations in serum sphingolipid levels associate with liver fibrosis progression and poor treatment outcome in hepatitis C virus but not hepatitis B virus infection. Hepatology 61, 812–822 (2015).
50. Ishikawa, M. et al. Plasma lipid profiling of different types of hepatic fibrosis induced by carbon tetrachloride and lomustine in rats.
Lipids Health Dis. 15, 74 (2016).
51. Chen, S. & Morgan, T. The Natural History of Hepatitis C Virus. Infection. 284, 47–52 (2006).
52. Tsukamoto, H., Towner, S. J., Ciofalo, L. M. & French, S. W. Ethanol-induced liver fibrosis in rats fed high fat diet. Hepatology 6, 814–822 (1986).
53. Pérez Tamayo, R. Is cirrhosis of the liver experimentally produced by CCl4 and adequate model of human cirrhosis? Hepatology 3, 112–20 (1983).
54. Ducastelle, T. et al. The hepatotoxicity of 1-(2-chloroethyl)-3-cyclohexyl-1-nitrosourea (CCNU) in rats - Ultrastructural evidence of a delayed microtubular toxicity. Cancer Chemother. Pharmacol. 22, 153–162 (1988).
55. Zhang, Q. et al. Plasma amino acid profiles applied for diagnosis of advanced liver fibrosis in patients with chronic hepatitis C infection. Hepatol. Res. 34, 170–7 (2006).
56. James, J. H., Jeppsson, B., Ziparo, V. & Fischer, J. E. Hyperammonaemia, plasma aminoacid imbalance, and blood-brain aminoacid transport: a unified theory of portal-systemic encephalopathy. Lancet 314, 772–775 (1979).
57. Ishikawa, T. et al. Branched-chain amino acids to tyrosine ratio (BTR) predicts intrahepatic distant recurrence and survival for early hepatocellular carcinoma. Hepatogastroenterology. 60, 2055–2059 (2013).
58. Mitchell, O. & Gurakar, A. Management of Hepatitis C Post-liver Transplantation: a Comprehensive Review. J. Clin. Transl. Hepatol.
3, 140–8 (2015).
59. Bedossa, P. & An, T. P. algorithm for the grading of activity in chronic hepatitis C. Hepatology 24, 289–293 (1996).
60. Barr, J. et al. Liquid chromatography-mass spectrometry-based parallel metabolic profiling of human and mouse model serum reveals putative biomarkers associated with the progression of nonalcoholic fatty liver disease. J Proteome Res 9, 4501–4512 (2010). 61. Grumbach, E. S., Diehl, D. M. & Neue, U. D. The application of novel 1.7 microm ethylene bridged hybrid particles for hydrophilic
interaction chromatography. J Sep Sci 31, 1511–1518 (2008).
62. V D Kloet, F. M., Bobeldijk, I., Verheij, E. R. & Jellema, R. H. Analytical error reduction using single point calibration for accurate and precise metabolomic phenotyping. J. Proteome Res. 8, 5132–5141 (2009).
63. Martínez-Arranz, I. et al. Enhancing metabolomics research through data mining. J. Proteomics 127, 275–288 (2015).
Acknowledgements
This work was supported by the Spanish Ministerio de Economía y Competitividad (Ministry of Economy and Competitiveness) Grant no. IPT-010000-2010-013 and European Union funding. We thank Rebeca Mayo for her skilled technical support and helpful comments on the paper.
Author Contributions
Study concept and design: A.C., Z.M., M.N., J.F., J.C., O.M., X.F., J.B., A.z.C., J.M. Recruited patients and provided serum samples: Z.M., M.N., J.C., X.F., J.B. Analysed data: A.C., I.M. Drafting of the manuscript: A.C. Scientific discussion and critical revision of the manuscript: A.C., Z.M., N.E., I.M., M.N., J.F., M.P., J.C., O.M., X.F., J.B., A.z.C., J.M.
Additional Information
Supplementary information accompanies this paper at doi:10.1038/s41598-017-10807-y Competing Interests: The authors declare that they have no competing interests.
Publisher's note: Springer Nature remains neutral with regard to jurisdictional claims in published maps and institutional affiliations.
Open Access This article is licensed under a Creative Commons Attribution 4.0 International License, which permits use, sharing, adaptation, distribution and reproduction in any medium or format, as long as you give appropriate credit to the original author(s) and the source, provide a link to the Cre-ative Commons license, and indicate if changes were made. The images or other third party material in this article are included in the article’s Creative Commons license, unless indicated otherwise in a credit line to the material. If material is not included in the article’s Creative Commons license and your intended use is not per-mitted by statutory regulation or exceeds the perper-mitted use, you will need to obtain permission directly from the copyright holder. To view a copy of this license, visit http://creativecommons.org/licenses/by/4.0/.