UNIVERSITY
OF TRENTO
DIPARTIMENTO DI INGEGNERIA E SCIENZA DELL’INFORMAZIONE
38123 Povo – Trento (Italy), Via Sommarive 14
http://www.disi.unitn.it
ENHANCEMENT OF THE CONTRAST SOURCE INVERSION
METHOD USING FUZZY LOGIC
A. Casagranda, A. Massa, A. Abubakar, and P. M. van den Berg
January 2011
Enhancement of the Contrast Source Inversion Method using Fuzzy Logic
A. Casagranda*1
, A. Massa1
, P.M. van den Berg2
, and A. Abubakar3
1
Department of Information and Communication Technologies University of Trento, I-38050 Trento, Italy
2
Faculty of Applied Sciences, Delft University of Technology, 2628 CJ Delft, The Netherlands
3
Schlumberger-Doll Research 36, Old Quarry Road, Rigdefield, CT-06877, USA
Introduction
The problem of determining the proprieties of an unknown object by means of electromagnetic waves probing the object is intrinsically instable with respect to the presence of noise and measurement errors on scattering data. In several practical condition in the framework of medical imaging, non-destructive testing, and sub-surface inspection, these errors are unavoidable and the ill-posedness of the system leads to inaccurate reconstructions of the scenario under test. In [1], an innovative fuzzy-logic-based strategy has been proposed for properly taking into account the presence of the noise and errors on the data. Such a system provides, in an unsupervised way, two series of coefficients that can be used as weighting parameters of the arising cost function to be minimized. In that paper, the mathematical formulation was presented considering the contrast and the fields equations. In this work, a further assessment of the proposed fuzzy-logic approach is carried out operating with data and state equations expressed in terms of the contrast and the contrast sources as suggested in [2]. Selected results from the numerical simulations are reported to assess the performances of the system with single and multi-frequency data with and without total-variation-based regularization.
Mathematical Formulation
For the sake of simplicity, let us consider the single-frequency case for the two-dimensional inverse scattering problem, where the scattering objects of arbitrary cylindrical cross-section belong to a homogenous, possibly lossy, bounded domain D of free space. Such a problem is described by the domain integral equation, see e.g. Colton and Kress [3]
uk(p) = uinck (p) + k 2 b Z D G(p, q)χ(q)uk(q)dv(q), (1) where uinc
k (p) = uinc(p, qk), k = 1, . . . , K, are the incident waves that successively illuminate the
scatterers from a circular domain S surrounding the D domain and G(p, q) denotes the Green’s
function of the background medium characterized by a wavenumber kb. The scattered field on the
surface S is given by fk(p) = k 2 b Z D G(p, q)χ(q)uk(q)dv(q), p∈ S. (2)
Unlike [1], let us now introduce the contrast source formulation of the problem (see [2]) observing that Equa. (2)-(3) contain the product of the field inside the object and the contrast. Such a product
an equivalent source that produces the field uk in the S domain. By using the symbolic notation
and the contrast source, the scattering equations can be rewritten as
fk = GSwk, p∈ S, and χuinck = wk− χGDwk, p∈ D. (3)
The inverse problem of retrieving the value of the contrast function χ from the knowledge of the incident field in S ∪ D and from the measurement of the scattered field in the data domain S is a nonlinear and ill-posed one. The equations in (3) do not hold exactly when noise and errors are present on the measured data. Therefore, the problem is recast as the minimization of a cost function, which is a linear combination of the residuals of the data and object equations
Fn= P k k α 1 2 k(fk− GSwk,n) k2S P kk fkk2S + P k k β 1 2 k(χnPuinck − wk,n+ χGDwk,n) k2D k k χnuinck,n k2D , (4)
The minimization of such a cost functional is carried out minimizing alternatively the contrast source w and the contrast function χ. The scheme adopted is the same as the conventional contrast source inversion method unless the cost functional has been modified with the introduction of the
weighting parameters {αk, βk, k= 1, . . . , K} provided by the fuzzy system. The reader is referred
to [1] for more details about the way such coefficients are obtained. What is worth mentioning here is that such coefficients allow one to take into consideration the presence of the noise on data and consequently rely, with a certain degree, to the data and state equations. An iterative conjugate-gradient-based technique is employed and the update directions are chosen to be the Polak-Ribi´ere conjugate gradient directions. When a multiplicative constraint based on the Total Variation (TV) content of the scenario is used, the iterative solution scheme is the same as that in [4] to which the reader is referred for details. As far as the initialization is concerned, the algorithm uses as initial estimate the contrast source obtained by back-projection.
Numerical Results
In this section we report a selection of results from numerical simulations that have been carried out in order to assess the effectiveness of the fuzzy system. For the sake of comparison, the simulations have been carried out using the same set of parameters for the fuzzy system whatever the considered test case.
From now on, let us consider a square investigation domain of size d = 3λ discretized in 29×29 equal subcells, and a frequency of operation of 300 MHz. The measurement domain S is composed by 18 points equally spaced around the investigation domain on a circle of radius 3 m. As a first example,
consider two concentric cylinders. The complex contrast of the inner cylinder is χin = 0.6 + 0.2i
while the second one is characterized by χout= 0.3+0.4i. The size of the inner cylinder is equal to λ
while the outer one is 2λ. The data generated by the direct solver are corrupted with random noise whose maximum value is 10% of the maximum value of the field. In Figure 1, the reconstructions are reported together with the original profile. Adding the fuzzy system to CSI, less artifacts are presents and the background is more homogenously reconstructed.
Let us now consider the multiplicative-regularization CSI method (MR-CSI), in which the total variation regularization as a multiplicative constraint [4] is used to enhance the performance of the CSI method. The profile reported in Figure 2 is constituted by two cylinders having different
Re{χ} 0 0.5 1 1.5 2 2.5 0 0.5 1 1.5 2 2.5 −0.1 0 0.1 0.2 0.3 0.4 0.5 0.6 0.7 0 0.5 1 1.5 2 2.5 0 0.5 1 1.5 2 2.5 0 0.5 1 1.5 2 2.5 0 0.5 1 1.5 2 2.5
Figure 1: Real part of the actual profile (left ). Reconstruction obtained using standard CSI method (middle) and the fuzzy-logic-enhanced CSI (right ).
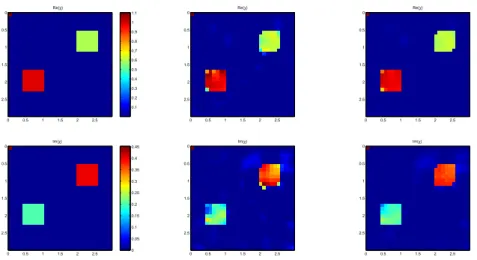
Re{χ} 0 0.5 1 1.5 2 2.5 0 0.5 1 1.5 2 2.5 0.1 0.2 0.3 0.4 0.5 0.6 0.7 0.8 0.9 1 1.1 Re{χ} 0 0.5 1 1.5 2 2.5 0 0.5 1 1.5 2 2.5 Re{χ} 0 0.5 1 1.5 2 2.5 0 0.5 1 1.5 2 2.5 Im{χ} 0 0.5 1 1.5 2 2.5 0 0.5 1 1.5 2 2.5 0 0.05 0.1 0.15 0.2 0.25 0.3 0.35 0.4 0.45 Im{χ} 0 0.5 1 1.5 2 2.5 0 0.5 1 1.5 2 2.5 Im{χ} 0 0.5 1 1.5 2 2.5 0 0.5 1 1.5 2 2.5
Figure 2: Real (top) and imaginary (bottom) part of the contrast. Actual profile (left ). Reconstruction using MR-CSI (middle) and fuzzy-logic enhanced MR-CSI (right ).
between the centers of the two objects is approximately 1.90 m. In Figure 2, we show the pictorial plots of the reconstructions obtained after 256 iterations, when the data are corrupted with 20% of noise. The reconstructions positively benefit from the use of the fuzzy system. In particular, the imaginary part of the contrast improves significantly.
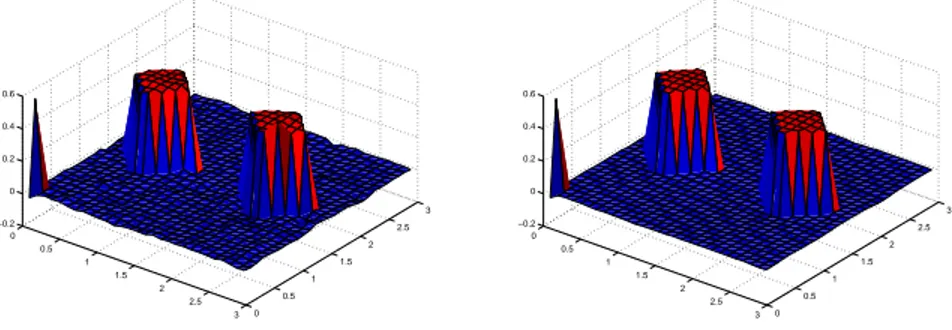
For the multi-frequency case, two cylinders of rhomboidal cross-section and side 0.6 m placed at a distance between their barycenters of 1.5 m in the investigation domain D are considered. The cylinders have a real contrast function χ = 0.5. In Figure 3, the results obtained are reported when data collected at 300 and 400 MHz have been simultaneously processed (i.e., the cost functional is defined as a summation over the frequencies of single-frequency data). Although the reference reconstruction is quite accurate, the fuzzy-logic-enhanced CSI further improves the reconstruction yielding a more homogeneous and almost perfect reconstruction. Numerically, the quantitative error is equal to 0.00519 and 0.00251 without and with fuzzy, respectively.
Conclusion
In this paper, a validation of the fuzzy-logic-based system preliminary proposed in [1] for reducing the reconstruction inaccuracies due to the presence of noise on scattering data, has been carried out. In particular, the performances of the system have been evaluated when the formulation of
0 0.5 1 1.5 2 2.5 3 0 0.5 1 1.5 2 2.5 3 −0.2 0 0.2 0.4 0.6 Re{χ} 0 0.5 1 1.5 2 2.5 3 0 0.5 1 1.5 2 2.5 3 −0.2 0 0.2 0.4 0.6 Re{χ}
Figure 3: Reconstruction using MR-CSI (left ) and fuzzy-logic enhanced MR-CSI (right ). Multi-frequency case. Note the normalization in the left corner of each figure.
the problem is based on the contrast source inversion. Both single-frequency and multi-frequency examples have been reported. Using the fuzzy logic a significant improvement in the reconstruction has been observed.
References
[1] A. Casagranda, D. Franceschini and A. Massa, Assessment of the Reliability and Exploitation of the Information Content of Inverse Scattering Data Through a Fuzzy-Logic-Based Strategy-Preliminary Results, IEEE Geoscience and Remote Sensing Letters, vol. 2, pp. 36-39, January 2005
[2] P.M. van den Berg and R.E. Kleinman, A contrast source inversion method, Inverse Problems, vol. 13, pp. 1607-1620, December 1997
[3] D. Colton and R. Kress. Inverse Acoustic and Electromagnetic Scattering Theory, Springer, Berlin, 1992.
[4] P.M. van den Berg and A. Abubakar, Contrast source inversion method: state of the art, Progress in Electromagnetics Research, PIER 34, pp. 189-218, 2001.