Overlapping camera clustering through
dominant sets for scalable 3D
reconstruction
Massimo Mauro1http://www.ing.unibs.it/~massimo.mauro
Hayko Riemenschneider2
http://www.vision.ee.ethz.ch/~rhayko/
Luc Van Gool2
http://www.vision.ee.ethz.ch/~vangool//
Riccardo Leonardi1 http://www.ing.unibs.it/~leon/
1Department of Information Engineering
University of Brescia Brescia, Italia
2Computer Vision Lab (CVL),
Swiss Federal Institute of Technology (ETH)
Zurich, Switzerland
Abstract
In this work we present a method for clustering large unordered sets of cameras. Our method uses camera view information available from Structure-from-Motion (SfM) for computing a set of overlapping clusters suited for Multi-View Stereo (MVS) reconstruc-tion. Our formulation of the problem uses the game theoretic model of dominant sets to find competing clustering solutions with computational simplicity. The overlapping solu-tions ensure more robust partial reconstrucsolu-tions. Experimental evaluasolu-tions show that our method produces more regular cluster and overlap configurations with respect to the state of the art. This allows more scalable and higher quality reconstructions, while speeding up 6 times with respect to a MVS which uses all images at once.
1
Introduction
The millions of images available on the Internet and community websites such as Flickr, Panoramia, etc. created the opportunity to build models of any known place or object in the world. Advanced computer vision techniques have been developed for this purpose and the state-of-the-art made great progresses in the last years: local features [11] can be accu-rately matched among images. Structure-from-Motion (SfM) algorithms [16,18] can jointly estimate camera parameters and 3D point positions of a sparse reconstruction. Multi-View Stereo (MVS) produces dense and accurate 3D clouds [13, 14] from which sophisticated algorithms can reconstruct high-detailed surfaces [8]. Given an unordered image collection downloaded with a keyword search (e.g. "Notre Dame"), these techniques succeed to create impressive 3D reconstructions [1,3].
With an incredibly large available dataset as is the Internet, scalability is a great issue. Many of the modern SfM and MVS algorithms work by using the whole set of available image at once, which renders the reconstruction prohibitive when the number of images
c
2013. The copyright of this document resides with its authors. It may be distributed unchanged freely in print or electronic forms.
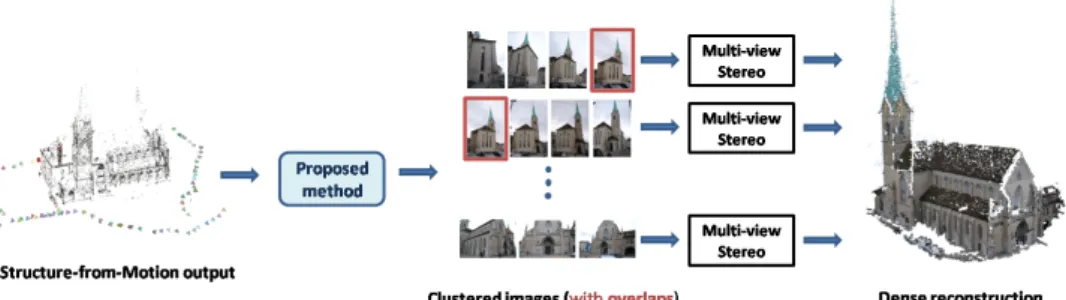
Figure 1: The overall scheme of a reconstruction using camera clustering.
grows. In large-scale reconstructions it is thus important to partition the images in clusters, covering different parts of the scene. This results in two benefits - reduced runtime on a single machine due to the smaller dimensions of the clusters and the possibility to split the processing across multiple machines for even further speedup.
In this work, we focus on the scalability of MVS and we propose a novel view clustering method (see Fig.1). Our method uses the information of camera geometry available from a previous SfM step and produces overlapping clusters of cameras with a desired maximum size and level of overlap. Overlap is important for reaching a well-covered reconstruction near cluster boundaries. We formulate our problem using the game theoretic model of dom-inant sets [12] which allows us to exploit well-founded results from game theory to find clustering solutions with great computational simplicity. Our algorithm produces more reg-ular cluster and overlap configurations with respect to the state-of-the-art method [6] and allows scalable and high-quality reconstruction.
The paper is structured as follows: we present related works in Section2. We introduce the proposed method in Section3. Qualitative and quantitative evaluations are shown in Section4, while in Section5we discuss the future work and conclude the paper.
2
Related work
The problem of scalability for large-scale 3D reconstruction has already been addressed in other works. Methods have been developed for scaling both Structure-from-Motion (SfM) and Multi-View Stereo (MVS) algorithms.
Scalability in SfM. Snavely et al. [17] find skeletal sets of images from a given un-ordered collection which provides a good approximation of the SfM reconstruction using all the images. Their method relies on the estimation of the reconstruction accuracy be-tween pairs of overlapping images, from which a graph is constructed and the skeletal is found by a maximum-leaf t-spanner algorithm. Li et al. [10] find a small subset of iconic imagesthat capture all the important aspects of the scene. Their method proceeds in an incre-mental fashion, initially applying 2D appearance-based constraints to loosely group images, and progressively refining these groups with geometric constraints to select iconic images for a sparse visual summary of the scene. Their system is also suited for summarization, browsing and recognition. Crandall et al. [2] propose an MRF formulation for SfM which finds a coarse initial solution and then improve that solution using bundle adjustment. Their formulation naturally incorporates various sources of information such as noisy geotags or
vanishing point estimates. Conversely to these works, our work deals with the scalability for MVS and takes advantage of camera and 3D points SfM information for dividing the cameras in groups suited for reconstruction. Hence, it could be integrated with any of the methods presented above.
Scalability in MVS. Clustering and selection techniques have been proposed for address-ing MVS scalability. In their selection method, Hornung et al. [7] rely on coverage and vis-ibility cues to guarantee a minimum reconstruction quality and then refine the most difficult regions using photo-consistency. Tingdahl et al. [18] reduce the set of initial views relying on depth maps data. Ladikos et al. [9] propose a spectral clustering approach which incor-porates scene and camera geometry to build a similarity matrix and then uses mean shift to automatically select the number of clusters. Furukawa et al. [6] first remove redundant images and then build a graph representation of remaining cameras, dividing them into clus-ters through normalized-cut while respecting a constraint on the maximum size of a cluster. As a final step, they run an image addition process that creates overlaps between clusters to respect a coverage constraint.
Our work deals with camera clustering before MVS to ensure well-separated parts. In addition, any image selection strategy could be incorporated in our algorithm and performed separately within each cluster. We explicitly developed our method with an easy integration of selection in mind. Differently from [9], our work produces overlapping clusters and al-lows the setting of a maximum cluster size. As in [6], we model the camera set as a graph, but in contrast we solve for clusters using dominant sets. Dominant sets [12] are a gener-alization of the notion of a maximal clique (defined for unweighted graphs) in the context of edge-weighted graphs. The main property of a dominant set is that the overall similarity among internal nodes is higher than that between external and internal nodes. That is the reason why they turn out to be good and compact clusters. One great advantage of using dominant sets is the computational simplicity: dominant sets can be found using straight-forward optimization techniques such as replicator equations developed by the game theory community [20], which can be implemented with few lines of code and executed efficiently. An additional advantage of using dominant sets clustering over other methods like [4,15] is that overlaps can be quite naturally integrated [19]. In our method we define a specified number of overlapping cameras for every cluster and we force them to be on cluster bound-aries. Being careful not to remove overlapping cameras, this feature allows any selection to be computed independently on every cluster without worrying about inter-cluster coverage, thus avoiding the need for the final image addition step as in [6].
3
Camera clustering
The goal of our camera clustering is to produce an appropriate number of overlapping clus-ters. Each cluster can then be processed independently by the consequent MVS or selection methods for speed up. These benefits can be exploited on a single machine or across multiple machines. Hence, each cluster size is limited by the memory capabilities of the machine.
In this section we will discuss the four parts of our method: clustering constraints, the similarity definition between cameras, our solution using dominant set clustering, and the enforcing of overlapping cameras.
3.1
Clustering constraints
Generally in clustering, each cluster should satisfy two criteria: 1) All objects inside a cluster should be highly similar to each other. 2) All objects outside a cluster should be highly dissimilar to the ones inside.
In our work we define that two cameras should be in the same cluster if they see similar parts of the scene. Further, the clustering should satisfy three additional constraints:
• minimum size constraint: every cluster must contain at least three cameras, for a robust dense stereo.
• maximum size constraint: every cluster must be smaller than a specified value Nsize.
This constraints allows to run memory expensive dense reconstructions on machines with limited memory capabilities.
• overlap constraint: every cluster must define a number Noverlap of overlapping
cam-eras with other clusters. This procedure improves the density of the reconstruction at the "borders" of a cluster. It also allows to run a selection method independently on each cluster without creating holes between different sets. By setting the overlapping cameras as "non removable", the connectivity between clusters is guaranteed. We model our problem as a graph, where the nodes represents the cameras and the edges represent the similarity between views. This allows us to adopt the well-studied dominant sets formulation from graph theory to find a solution to the clustering. Dominant sets also offer the possibility to extend the clustering algorithm quite naturally in order to manage all the constraints jointly.
3.2
Similarity matrix
We are given a set C of N cameras and a 3D sparse point cloud P resulting from Structure-from-Motion (SfM). Here we define a N × N symmetric matrix W of pairwise similarities between cameras. Considering a pair of cameras (Ci,Cj), we note as Viand Vj the sets of
visible points from camera i and j respectively. Then the similarity is then defined as
wi j=
∑p∈(Vi∩Vj)wαi j p
| Vi∩Vj|
(1) where p ∈ P and wαi j p is dependent on the angle α between the viewing directions
−−−→ Ci− p
andC−−−→i− p and is defined as
wαi j p= exp(− αi j p2 σ2 ) (2) αi j p= arccos (Ci− p)T(C j− p) k Ci− p kk Cj− p k (3) There is an angle limit between 30◦and 40◦beyond which the same point is difficult to match among different images [11]. We thus set σ = 30◦in our experiments. The denomina-tor in Eq.1normalizes the score with respect to the number of common visible points. Since the SfM point cloud might be non-uniformly dense, by normalizing the similarity measure we avoid any bias towards denser regions of the structure.
(a) High ε (= 0.1) (b) Low ε (= 0.00001) (c) Selected ε (= 0.001)
Figure 2: Clustering cameras on the Hall dataset with different stopping values ε. Too high values (ε = 0.1) generate imprecise clusters, while too conservative values (ε = 0.00001) produce over-segmentation and single-camera clusters.
3.3
Dominant set clustering
Dominant set clustering partitions the graph G = (V, E) into each dominant set. A dominant set is the most coherent subset of the graph nodes. The clustering works by iteratively evalu-ating the coherency of the graph nodes based on the similarity matrix W0, where W0is equal
to the W matrix without any self-loops, i.e. with zeros along the main diagonal.
The assignment of each camera is then determined by the participation vector x, which is of length N as the number of cameras. This participation vector expresses the level of par-ticipation of the corresponding camera in the cluster. Since we are interested in overlapping clusters, the probabilistic nature of the level of participation is beneficial. Each participation value is greater than zero for all nodes relevant to the dominant set. The algorithm for finding a dominant set (a cluster) is the following:
1. Initialize all elements of x to 1/N;
2. Evolve the system with the replicator equation xi(t + 1) = xi(t) (W0x(t))i x(t)TW 0x(t) (4) 3. Stop when x(t + 1)TW0x(t + 1) − x(t)TW0x(t) < ε (5)
When the algorithm terminates, the participation vector x has zero values for non-relevant nodes and values above zero for nodes in the dominant set. A single run of clustering sep-arates the graphs in two groups: a dominant set and the rest of the graph. We obtain a multi-cluster division by iteratively running the method on the remaining set of cameras, until no further separation is possible.
Different choices of the stopping criterion ε affect the performance of clustering: too high values generate imprecise under-segmented clusters, too low values lead to over-seg-mentation. An example is shown in Fig.2. In all our experiments we set ε = 0.001 as this resulted in a good tradeoff between the two conflicting issues for all datasets.
3.4
Satisfying the constraints
Satisfying the two size constraints is straightforward: for the minimum size constraint, if a cluster contains only 1 or 2 cameras, we add them to the clusters containing the most similar cameras according to W0. As regards the maximum size constraint, if the generated
dominant set is bigger than Nsize, only the camera corresponding to the Nsizehighest values
(a) Non-diverse overlaps (Noverlap= 2) (b) Diverse overlaps (Noverlap= 2)
Figure 3: Comparison of overlap configurations on the Church dataset with and without diverse selection, where the overlapping cameras in the highlighted region are missing.
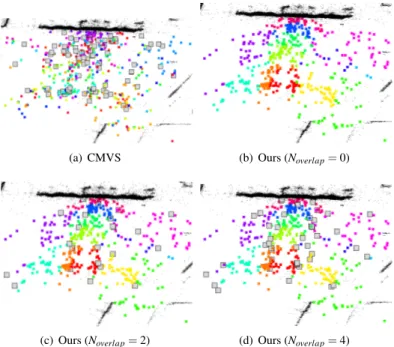
(a) CMVS (b) Ours (Noverlap= 0)
(c) Ours (Noverlap= 2) (d) Ours (Noverlap= 4)
Figure 4: Camera clusters on the Hall dataset. Overlapping cameras in gray.
The overlap constraints requires a more detailed explanation. A first idea could be to define as overlapping cameras of a cluster the Noverlapimages corresponding to the lowest
participation values, which usually correspond to cameras at the borders of a cluster. How-ever, this strategy could lead to a drawback: as you can see from Fig.3, in some cases - e.g. with semi-structured cameras as in Hall or Church dataset - each cluster has two borders. If one selects two cameras with such a simple approach, it could happen to select both cameras lying on one border, and leaving the other one uncovered. We thus need to select a set of diverse overlapping cameras. Given a participation vector x resulting from an iteration of dominant sets, we select Noverlapoverlapping images as follows:
1. If we are selecting the first overlapping camera, we choose the one corresponding to the lowest participation value.
2. Otherwise, we choose among the remaining cameras in the dominant set the least similar image to the previous selected one (according to the similarity matrix W ). This procedure is continued until the desired number of overlapping cameras is reached. The proposed modification leads the overlapping cameras to be chosen with an alternation from one border to another on subsequent selections, producing a set of diverse border cam-eras. At the end of the procedure, there will exist two borders for semi-structured data, and may exist multiple overlapping borders for unstructured data. When selecting an overlap-ping image, we always choose among cameras which were not already chosen in previous
Algorithm # Clusters # Overlap cameras # Dense points # Dense points (full) Coverage (%) PMVS Runtime PMVS Runtime (full) Hall CMVS 5 5 543579 98.9 3420 Ours (Noverlap= 0) 5 0 502219 437074 98.0 2863 4404 Ours (Noverlap= 2) 5 10 560945 99.8 3520 (1.54) Ours (Noverlap= 4) 5 20 636895 99.9 3995 Chur ch CMVS 6 10 447966 97.1 2974 Ours (Noverlap= 0) 7 0 373196 315320 97.0 2664 5102 Ours (Noverlap= 2) 7 14 444228 97.2 3188 (1.92) Ours (Noverlap= 4) 7 28 508864 97.8 3656 Notr eDame CMVS 28 85 888587 98.8 16934 Ours (Noverlap= 0) 13 0 829673 807200 98.6 9874 63615 Ours (Noverlap= 2) 13 26 879347 98.8 10660 (6.44) Ours (Noverlap= 4) 13 52 921302 98.9 11375
Table 1: Evaluation of the proposed clustering method with Noverlap= 0, 2, 4. Runtimes are
in seconds. The numbers between brackets are the speed up factor obtained when running the PMVS reconstruction on clusters without overlap compared to the full set at once.
dominant sets iterations. As a result, the size of the overlapping camera set at the end of the Nclustersclustering iterations is always equal to Nclusters× Noverlap.
4
Results
The goal of camera clustering is to separate a given set of images in different groups which are suitable for partial reconstructions. We want to find good clusters to speedup the dense reconstruction and determine regular overlaps to maximize the quality at every border, while respecting the hard constraints on cluster size. For this we show both quantitative (mea-suring the reconstruction quality and the runtimes) and qualitative results (illustrating the compactness of the clusters and the overlaps configuration).
4.1
Quantitative evaluation
For precise quantitative results, we require a ground truth, which is not readily available as there is no "optimal clustering" for a given camera set. In this work, for every dataset we reconstruct a dense 3D reconstruction with the Patch-based Multi-View Stereo (PMVS) method [5] using the full set of images at once. This dense point cloud is defined as ground truth and our measurements are relative to it. We then test different clustering strategies by comparing the results of PMVS on different cluster configurations. The goal is to compare the reconstruction quality and the runtime of the dense reconstructions on the clustered cam-eras with respect to the reconstruction using the full set of images. We also compare our method with the image clustering method in CMVS proposed by Furukawa et al. [6], for which the code is available. As CMVS does also image selection as initial step before clus-tering, we modified the source code to turn the selection off. This is the fairest comparison for clustering, as our clustering method does not include image selection.
We use the number of PMVS points and the coverage as metrics for comparison. Given a ground truth point cloud G, and a point cloud P, coverage is computed as follows: for every point gi in G, we evaluate the distance dGPto the nearest point in P. The point gi
(a) CMVS (b) Ours (Noverlap= 0)
(c) Ours (Noverlap= 2) (d) Ours (Noverlap= 4)
Figure 5: Camera clusters on the Church dataset. Overlapping cameras in gray.
by the percentage of covered points in G. We set dGP= 4R as threshold, where R is the
average distance between points and their nearest neighbors in G. We test our method on three datasets: Hall (60 images), Church (98 images, collected by us) and Notre Dame (685 images). In Table1we show the results of our evaluations.
Reconstruction quality. We obtain similar or better reconstruction qualities w.r.t. CMVS when using overlaps of size 2 or 4 on all clusters. Compared to the PMVS computed on the full set, there is no quality loss: we obtain higher densities and coverage is almost perfect. Coverage increases with the level of overlap, as expected, reaching ≈ 100% on all datasets.
Runtimes. Conversely, we achieve significant speed-up factor on all the datasets using clusters, up to 6.44 achieved on the Notre Dame set. We run our tests and estimated runtimes on a single machine with a 2.67 GHz processor and 4 GB of RAM. We highlight, as a further advantage of using clusters, that running the dense reconstruction on the large Notre Dame dataset on the same machine using the full set of images together would have been infeasible due to memory requirements. Runtime on the full set in Table1is in fact estimated recon-structing Notre Dame on a different machine with more memory capabilities and a similar processor. Further, despite making large reconstructions possible on a single machine, one can perform the reconstructions in parallel on multiple machines for additional speedup.
4.2
Qualitative evaluation
For qualitative evaluation, we visually analyze the clusters obtained with our algorithm on the three datasets and compare them to the CMVS clustered sets. For our method we consider three different overlap configurations Noverlap= 0, 2, 4.
Cluster configuration. We show the clustering on the Hall, Church and Notre Dame dataset in Fig.4,5,6respectively. Generally, due to the definition of coherent clusters in dominant sets, our clusters are more compact compared to CMVS. See, for example, in Fig.6 the clustering for the Notre Dame dataset, where the camera configuration is completely
(a) CMVS (b) Ours (Noverlap= 0)
(c) Ours (Noverlap= 2) (d) Ours (Noverlap= 4)
Figure 6: Camera clusters on the Notre Dame dataset. Overlapping cameras in gray.
unstructured. Our clusters are better separated in small groups with respect to the CMVS configuration. This is beneficial when integrating the method with a selection algorithm: every cluster has low influence on the others and thus selection can be run independently (in parallel) on each cluster.
Overlaps. Overlapping cameras are drawn with bigger gray squares. From Fig.4(Hall) and Fig.5(Church) we can highlight the effect of overlapping when the camera set is more structured around the scene. Contrary to the overlaps defined by CMVS, our overlapping cameras are always positioned precisely at the borders of every cluster, demonstrating the effectiveness of our diverse overlapping approach. In Fig.7we show the reconstruction on the five different clusters of the Hall set with and without overlaps: overlaps lead to point clouds that are denser and more complete on the border of the clusters.
5
Conclusions
In this work we presented a method for organizing a set of viewpoints in overlapping clus-ters in order to improve the scalability of MVS reconstructions. Our formulation directly encodes limits on cluster size and cluster overlaps using the theory of dominant sets for clus-tering. Our method leads to significant speedup factors (up to 6) for the dense multi-view reconstruction with respect to considering all images at once, while maintaining high recon-struction performances. When compared with another state-of-the-art clustering method [6], we show our clusters to have a cleaner separation and better overlaps. The diverse overlaps allow an easy integration with an image selection method which can be run for each cluster independently and in parallel. Merging the view clustering and image selection is a natural extension of this paper and will be part of future work.
(a) Cluster 1 (b) Cluster 2 (c) Cluster 3 (d) Cluster 4 (e) Cluster 5
(f) Cluster 1 (g) Cluster 2 (h) Cluster 3 (i) Cluster 4 (j) Cluster 5
Figure 7: Reconstruction using different zero (top) and four overlapping cameras (bottom).
Acknowledgments. This work was supported by the European Research Council (ERC) under the project VarCity (#273940).
References
[1] S. Agarwala, Y. Furukawaa, N. Snavely, I. Simon, B. Curless, S. Seitz, and R. Szeliski. Building rome in a day. Commmunications of ACM, 54(10), 2011.
[2] D. Crandall, A. Owens, N. Snavely, and D. Huttenlocher. Discrete-continuous opti-mization for large-scale structure from motion. In Proceedings of IEEE Conference on Computer Vision and Pattern Recognition (CVPR), 2011.
[3] J-M. Frahm, P. Georgel, D. Gallup, T. Johnson, R. Raguram, C. Wu, Y-H. Jen, E. Dunn, B. Clipp, S. Lazebnik, and M. Pollefeys. Building rome on a cloudless day. In Pro-ceedings of European Conference on Computer Vision (ECCV), 2010.
[4] B. Frey and D. Dueck. Clustering by passing messages between data points. Science, 315:972–976, 2007.
[5] Y. Furukawa and J. Ponce. Accurate, dense, and robust multi-view stereopsis. In Proceedings of IEEE Conference on Computer Vision and Pattern Recognition (CVPR), 2007.
[6] Y. Furukawa, B. Curless, S. Seitz, and R. Szeliski. Towards internet-scale multi-view stereo. In Proceedings of IEEE Conference on Computer Vision and Pattern Recogni-tion (CVPR), 2010.
[7] A. Hornung, B. Zeng, and L. Kobbelt. Image selection for improved multi-view stereo. In Proceedings of IEEE Conference on Computer Vision and Pattern Recog-nition (CVPR), 2008.
[8] M. Kazhdan, M. Bolitho, and H. Hoppe. Poisson surface reconstruction. In Proceed-ings of the Eurographics symposium on Geometry processing, 2006.
[9] A. Ladikos, S. Ilic, and N. Navab. Spectral camera clustering. In Computer Vision Workshops (ICCV), 2009.
[10] X. Li, C. Wu, C. Zach, S. Lazebnik, and J-M. Frahm. Modeling and recognition of landmark image collections using iconic scene graphs. In Proceedings of European Conference on Computer Vision (ECCV), 2008.
[11] K. Mikolajczyk, T. Tuytelaars, C. Schmid, A. Zisserman, J. Matas, F. Schaffalitzky, T. Kadir, and L. Van Gool. A comparison of affine region detectors. International Journal of Computer Vision (IJCV), 65(1-2):43–72, 2005.
[12] M. Pavan and M. Pelillo. Dominant sets and pairwise clustering. IEEE Transactions on Pattern Analysis and Machine Intelligence (PAMI), 29(1):167–172, 2007.
[13] J-P. Pons, R. Keriven, and O. Faugeras. Multi-view stereo reconstruction and scene flow estimation with a global image-based matching score. International Journal of Computer Vision (IJCV), 72(2):179–193, 2007.
[14] S. Seitz, B. Curless, J. Diebel, D. Scharstein, and R. Szeliski. A comparison and evaluation of multi-view stereo reconstruction algorithms. In Proceedings of IEEE Conference on Computer Vision and Pattern Recognition (CVPR), 2006.
[15] J. Shi and J. Malik. Normalized cuts and image segmentation. IEEE Transactions on Pattern Analysis and Machine Intelligence (PAMI), 22(8):888–905, 2000.
[16] N. Snavely, S. Seitz, and R. Szeliski. Modeling the World from Internet Photo Collec-tions. International Journal of Computer Vision (IJCV), 80(2):189–210, 2007. [17] N. Snavely, S. Seitz, and R. Szeliski. Skeletal graphs for efficient structure from
mo-tion. In Proceedings of IEEE Conference on Computer Vision and Pattern Recognition (CVPR), 2008.
[18] D. Tingdahl and L. Van Gool. A public system for image based 3d model genera-tion. In Computer Vision/Computer Graphics Collaboration Techniques, pages 262– 273. Springer, 2011.
[19] A. Torsello, S. Rota Bulo, and M. Pelillo. Beyond partitions: Allowing overlapping groups in pairwise clustering. In Proceedings of International Conference on Pattern Recognition (ICPR), 2008.