1
Università degli studi di Salerno
DIPARTIMENTO DI SCIENZE ECONOMICHE E STATISTICHE
DOTTORATO DI RICERCA IN ECONOMIA DEL SETTORE PUBBLICO
XIII CICLO
Tesi di dottorato in
The youth employment rate and the role of minimum wage, labor market policies and institutions: theory and estimates.
Relatore Candidato:
Ch.mo Prof Shane Niall O’Higgins Valentino Moscariello
Coordinatore: Matr: 8880100063
Ch.mo Prof Sergio Pietro Destefanis
2
Contents
Chapter 1 :Youth Employment: general outlook.
...61.1 Defining youth. ...6 1.1.1 OECD Countries. ...6 1.1.2 Middle East. ...7 1.1.3 North Africa. ...7 1.1.4 Sub-Sahara Africa. ...8 1.1.5 Asia ...8 1.1.6 South Asia ...9
1.1.7 Latin America and Caribbean. ...9
1.2 A labor market for youth? ... 10
1.2.1 The “real” estimation of youth employment. ... 11
1.2.2 Youth labor market in developing and developed countries. ... 11
1.2.3 The incidence of job part-time. ... 14
1.3 Youth employment and skills mismatch in advanced economies. ... 15
1.3.1 Skill mismatch between labor supply and demand. ... 15
1.3.2 Skill mismatch by occupation. ... 17
1.4 NEET young people. ... 17
1.4.1 Policies for youth employment ... 19
1.4.2 Policies for training and education. ... 19
1.4.2.1 Dual apprenticeship system. ... 20
1.5 Youth targeted labor market policies. ... 21
1.5.1 Youth guarantee as response to the youth employment crisis. ... 22
1.6 Conclusion. ... 23
Chapter 2 : Minimum wage, labor market institutions and policies: a cross
sectional analysis on their impact on youth employment from OECD
countries.
... 242.1 Labor market institutions: definition... 24
3
2.1.2 Economic theory on EPL: the neutrality case ... 25
2.1.3 Unions and collective agreements: impact and role. ... 26
2.2 History of trade unions. ... 26
2.2.1 Economic analysis of the union: the utility function. ... 26
2.2.2 The assumption of monopolist union: interpretation of the graph. ... 27
2.2.3 The unions and the efficiency of the labor market. ... 28
2.3 What happens to the market equilibrium without unions? ... 28
2.3.1 Efficient contract and contract curve: Why both do firms and unions move of their initial point of equilibrium? ... 30
2.3.2 The relationship between labor Market Institutions and minimum wages. ... 31
2.4 Minimum wage: A brief history-Which is its role in the global economy? ... 31
2.4.1 The aim of the minimum wage and its system across the world. ... 33
2.4.2 The successful of minimum wage policy. ... 34
2.4.3 The compliance of the minimum wage. ... 35
2.4.4 Minimum wage and employment: competitive labor market theory. ... 36
2.4.5 How to interpret the graph... 37
2.4.6 Higher minimum wage: Which are the effects? ... 37
2.4.7 Monopsony in the labor market. ... 38
2.4.8 The introduction of minimum wage in monopsony labor market. ... 40
2.5 Is it possible to increase employment introducing a minimum wage in a monopsony labor market? .. 41
2.5.1 Minimum wage in dual economy. ... 42
2.6 The efficiency wage model: the effort curve. ... 43
2.6.1 The introduction of minimum wage in efficiency wage model: diagram and interpretation. ... 45
2.6.2 Heterogeneous labor model. ... 46
2.6.3 Effort model. ... 46
2.6.4 Should minimum wage be increased or decreased? ... 46
2.7 Economic literature about minimum wage. ... 47
2.7.1 Setting minimum wage. ... 49
2.7.2 The Macroeconomic impact of the minimum wage. ... 49
2.7.3 The increasing of minimum wage and its impact on employment. ... 50
2.8 The empirical evidence about minimum wage: previous research. ... 50
4
2.9. Active labor market polices. (ALMP’S) ... 54
2.9.1 ALMP’S in the history... 54
2.9.2 ALMP’S economic theory. ... 55
2.9.3 Policies and institutions: Does a link exist? ... 58
2.10 Theoretical model and econometric specification. ... 60
2.10.1 Main results ... 61
2.11 Interactions between policies and institutions... 65
2.12 Estimates for young male and female. ... 68
2.13 Conclusion ... 75
Chapter 3 : Estimating the impact of minimum wage on youth employment
elasticity: a meta-analysis of data including publication bias.
... 763.1 Meta-Analysis ... 76
3.1.1 Systematic vs. narrative review approach. ... 77
3.2 Aim of Meta-Analysis. ... 78
3.2.1 Meta-analysis as part of research process. ... 78
3.3 Meta-analysis use: theory and practice. ... 79
3.3.1 Debate on its use. ... 79
3.4 Meta-analysis: procedures and methods in previous analyses. ... 80
3.5 Present meta-analysis: procedures and methods. ... 82
3.5.1 Data collection. ... 82
3.6 Publication bias. ... 83
3.6.1 Asymmetry as explanation of publication bias. ... 85
3.6.2 Reasons of funnel plot asymmetry. ... 86
3.7 Contour- enhanced funnel plot. ... 86
3.7.1 Analyzing missing studies on one sided significance test. ... 90
3.8 Measuring Asymmetry Publication Bias: The Egger’s Test. ... 91
3.9 The Empirical model/s. ... 94
3.9.1 The Ordered probit model. ... 94
3.9.2 Results and interpretation. ... 96
3.9.3 Institutional variables. ... 98
3.10 Meta regression model. ... 99
5
3.10.2 Fixed vs. Random effect ... 100
3.10. 3 Random or fixed effect model? ... 101
3.10.4. Meta regression fixed effect regression: results and interpretations. ... 101
3.10.5 Random effect meta regression ... 104
3.11 Conclusion ... 107
References. ... 108
6
Chapter 1 :Youth Employment: general outlook.
1.1 Defining youth.
Considering Standard Definition of United Nations, young people are that one aged from 15 to 24 inclusive. However, there is a need to underline as practically this definition changes from country to country, considering also cultural, institutional and political factors. In developed countries and in the Central and in The Eastern European economies, the lower age limit is equal to the statutory minimum during school living age, however, the higher limit vary significantly between countries. For example, if we consider United Kingdom’s New Deal, for young it considers people from 18 to 24 years old( with a special treatment from 16 to 17), while in Italy it dramatically changes, considering people from 14-29(in the north), and 14-32( in the south). Developing countries often don’t have minimum school-leaving age; this is one the most important cause which determines early labor market experience for young people1 . In Germany, for example, the rate of those aged (16-24) is approximately the same as the adults; which meaning that dual apprenticeship system is working in good way2.
1.1.1 OECD Countries.
In the countries of the Organization for the Economics Co-operation and Development (OECD) the unemployment rate of young people was 20.5 points percentage in 2013, while for adults this has been estimated to be 7.2 per cent (so more than double of youth are unemployed).
If it possible, for developing countries data show a worse situation, above all if we consider women.
1
In this study we are not going to study child laborissue.
2 In Chapter 2, this topic will be discussed in very detailed way; its effect on youth employment rate is going to be
7
1.1.2 Middle East.
The Middle East has the highest youth unemployment rate of all regions. More than one in four economically active young people are unemployed. The youth unemployment rate is estimated at 28.6 per cent, and is projected to increase gradually to 30.00 per cent in 2018. Together with North Africa, The Middle East is one of the two regions in which the total unemployment rate (across all age groups) exceed 10.2 in 2014; however given the high youth-to adults ratio of unemployment rate (4.0), as well as the youthful population in this region, youth bear the brunt of the unemployment problem, constituting the 45 per cent of unemployed.
1.1.3 North Africa.
As in the Middle East, the youth unemployment rate in North Africa is very high, at 25.00 per cent in 2014. The unemployment rate for young women is even higher, at 38.0 per cent, compared with 18.5 per cent for young men in 2014.
Despite the disadvantages position of young people, their share of total unemployment has been (slowly) decreasing due to demographic changes; in particular the share of youth in the population has been falling. In 2000, one in three persons of working age population were aged between 15 and 24, but this proportion dropped to 28 per cent, and it is projected to fall to one in four persons in 2015.
However, there is a need to underline that there is a great heterogeneity between countries by sex. In Morocco, in 2011 unemployment rate for male and female were fairly close (18.1 for male and 17.4 for female) while in Algeria, young women were more affected by unemployment rate than young men. The female youth unemployment rate in this country was 37.5 per cent in 2010, while the male youth unemployment rate stood at 18.7 per cent. 3
8
1.1.4 Sub-Sahara Africa.
In this region there has been, (and it is still in act) a strong economic growth which has influenced a positive way labor market indicators. For example, in Ghana the average growth rate is estimated of 6.5 per cent in the last ten years, and the unemployment rate decrease more than fifty per cent; additionally Ghana Labor Force Survey shows a contemporary decrease of a vulnerable employment too. It clearly shows how in the last twenty years there was a decrease from 80 to 75 per cent of vulnerable employment, and considering youth issue, the average regional unemployment rate decrease by almost 1 percentage point from 13.4 per cent to 12.3 per cent. All other developing countries show a higher decrease of vulnerable employment, but in more cases with a lower increase of economic growth. However, a common trend that is needed to underline is that the manufacture sector in several cases is a fulcrum of paid job creation, but with a lot of differences over countries.
1.1.5 Asia.
Employment in Asia and in the Pacific is estimated to increase by 1.7 point percent in 2015. Looking forward, employment growth is projected to out-space working age population growth, resulting in a slight increase in the employment to population ratio between 2009 and 2017(from 66.6 to 67.0 per cent). The labor force participation is expected to remain steady at around 70 per cent.
The unemployment rate in this region is decreasing during the last years, from an average of 6 per cent between 2000 and 2008 to around 4.3 per cent projected over the next years.
In Indonesia, the unemployment rate is at 5.8 compared with an average of 9.1 between 2000 and 2008.
Women are more likely to be unemployed than men, (6.3compared with 5.5 per cent); on the other hand in Philippines the women unemployment rate is at 7.2 per cent, almost the same also for men. In addition, there is a need to underline how in this region youth unemployment rate remains the most important challenge: is it estimated to be 14 per cent, three times greater than adult one.
9
1.1.6 South Asia.
Labor market in South Asia, as in the past, is dominated by informal and agricultural employment, where job are generally poor and unprotected. Some labor force indicator are able to explain very well the situation is this region: labor force participation is one of the lowest in the word; for youth the situation is always worse; reaching 39.6 per cent in 2014, which an increase of education
enrollment, especially in secondary schooling.
However, employment growth is stronger in the last years (1.1 in 2013 and 1.2 in 2014); above all for women. However, the official indicator are not able to clearly explain the situation, simple because, as explained before, employment is informal and under poverty conditions.
1.1.7 Latin America and Caribbean.
The youth unemployment rate in Latin America and the Caribbean decreased from 17.6 cent in 2003 to 13.5 per cent in 2008. The crisis has increased the rate to 15.4 per cent 2009, but from 2010 the regional unemployment rate reached 12.9 in 2012. The ratio of youth to adult unemployment rate, which was 2.5 in 2000, gradually increased and now the common value is 2.8. In Argentina, for example, the ratio was 3.0 in the early years of past decades, but it reached 3.3 in 2007 and increased to 3.6 in 2011.
The youth unemployment rate in these regions has always been characterized by the level of education; however these differences are not always in favor of those with highest education. This was what exactly happened in 2012, where the youth unemployment rate for people with intermediate level of education was 7.1 points percentage, while for people with basic education level was 6.6 points percentage. In Chile, workers with a secondary level of education also have the highest unemployment rate, (7.3 per cent in October 2012, compared with 4.5 per cent for primary education workers and 3.1 per cent for workers with and advanced education4.
10
1.2 A labor market for youth?
Young people have a lot of difficulties to get a job, and there are several reasons to explain this issue: -First, young workers that are new entrants in the labor market cannot compete with old ones for skills and experiences, so they can have probability to get only unskilled job.
However, the belief that one age group of worker can be replaced with another is not likely to be widespread; in several cases employees don’t consider young and old workers in the same way. Some works indeed requires skills which are, or should be very common among young people, as for example adaptability, while other jobs can require more adults characteristic, such as experiences and
responsibility.
There were programs explicitly designed to encourage the substitution of young work with old ones, as for example in France with the “Allocation de replacement pour l’emploi (ARPE). Under this measure, early retirement was subsidized by the Government on condition that the employee hires a replacement under the same contractual agreement as the person retiring. Also if it was not clearly specified, applicants under 26 years of age were give special attention; this procedure was not usual but the aim was to encourage a turn-over of workforce through voluntary replacement of older workers with young ones. However, the results were not achieved: in fact the primary aim was to be able to employ 80.000 young people by the end of 1996, but the programs approached only 60.000 ones (Gineste, 1997). Then, the replacement rate was lower than expected, despite the explicit aim of
the measure.
Different measures are which ones with the aim to encourage the recruitment of young people instead of existing older employers by reducing the relative cost of hiring young workers. Furthermore, Begg et all (1991) found that 80 per cent of the jobs “created” were works already existing, or which would have been created also without YTS; additionally only nine per cent of those jobs were for workers aged 19 and above, the replacement rate was between young aged 16 and 24 years old, to additionally underline as the young have also been, and continue to be a “false threat” to old workers.
11
1.2.1 The “real” estimation of youth employment.
The “real” estimation of the unemployed in general, and in this case of youth unemployment in particular, has to be done taking into account the discouraged workers. It is very important because basically it includes to the standard definition of unemployed youth those who are not technically unemployed because they do not meet the active job search criteria but who would like to work. There are a lot advantages to use it: -firstly, it is able to capture information on discouraged people that are not “usefully occupied”, and
would like to work if job market improve;
-secondly, in this sense we are going to have a sense of the size of the youth labor market problem in
relation to the youth labor market as whole;
-thirdly, it helps in the interpretation of the employment adjustment process. For sure, if we don’t include these ones, we don’t have a real estimation of unemployment, above all for the dimension of the active labor policy that the policymakers have to do. Instead if we consider the labor market for young people in developing countries, it is very different from the developed ones.
1.2.2 Youth labor market in developing and developed countries.
Youth labor market in developing economies is characterized by an increasing demand for workers, a scarcity of capital and a persistent conflict between “old way” to do economies and the modern one (it can been considered as geographical conflict, between rural and urban part of countries; this is also because the cost of workers is lower than buying or renting machinery.
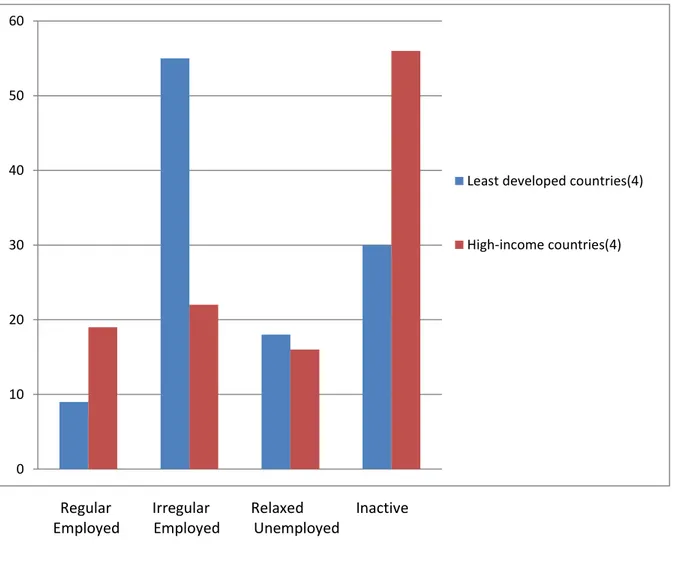
Figure 1 5 suggests how labor market experiences and the quality of jobs for young people differ significantly between developed and developing countries. There are several reasons for these differences: there are economical, juridical and social issue to take into consideration.
12
Its aim is to compare aggregate data on youth labor market situation from least developed countries (LDCs)-Cambodia, Liberia, Malawi and Togo, with aggregate data from four high-income European countries(Belgium, France, the Netherlands and Portugal). In this figure youth are divided in four categories:
-A) regular employment, defined as wage and salaried workers holding a contract of unlimited duration (in the case of high-income countries), or a contract of a duration greater than 12 months (in the case of LDCs);
-B) irregular employment, defined as wage and salaried workers holding a contract of limited duration(less than 12 months in the case of LDCs and undefined in the case of the high-income countries);
-C) unemployed (relaxed definition), defined as a person currently without work and available to take up work in the week prior to the reference period;
-D) the residual inactive youth.
13
Figure 1. Distribution of youth population by regular and irregular employment, unemployment (relaxed definition and inactivity for four LDCs and four high-income countries (%).
Regular Irregular Relaxed Inactive Employed Employed Unemployed
Figure 1 suggests two conclusions: first, the main differences between youth in developing economies and in developed ones are in the shares of irregular employment and inactivity. It is very important to underline because, as explained before, the size of unemployment dramatically changes. Second, when we use the relaxed definitions of unemployment, rates are more similar, the explanation has to be found in the level of educational attainment: in developed economies generally young people go to school and complete at least secondary level of education, while in developing ones, educational
0 10 20 30 40 50 60
Least developed countries(4)
14
enrolment remains low and educational attainment levels are still extremely low, with small proportion of youth attaining a secondary education. The mean of educational attainment among the young Population in Cambodia, Liberia, Malawi and Togo in 2013 were 6.2 per cent considering people with primary level education or lower, 33.7 for young people with secondary level of education and 4.1 per cent with higher-level degree.
The main difference between developing and developed countries is that in the last one young people are generally enrol in a school course, so they are considered as inactive, then increasing inactivity; while in developing countries young people generally are not enrolled in school, they are engaged in irregular employment. In contrast with irregular employment developed economies nine of ten are engaged in temporary wage employment.
1.2.3 The incidence of job part-time.
For OECD, the incidence of part-time work for youth increase from 20.8 per cent in 2000 to 29.3 per cent in 2011 per cent from 2000 to 22.3 per cent in 2008, but it increased to 25 per cent in the 2011. In North America youth part time employment grew from 18 per cent, so there was a widespread use of part-time job: in fact in 2000 the young part time workers were the 28.4 per cent of the full time ones and in 2009 they were the 34.3 per cent, but instead in European Countries, the percentage decrease from the 2010 to the 2011 (in the midst of the crisis). For all these reasons, youth employment policies are the highest priority, with a particular target on first job-seekers. To win this that can be defined as the crisis of the youth, there is a need to extend the youth employment policies to those countries don’t yet have actuated this type of policy. The area where is most important to intervene is area that regard macroeconomic and sector policies, social dialogue and partnership for youth employment, labor standard and social protection for young people.
15
1.3 Youth employment and skills mismatch in advanced economies.
The issue of skill mismatch has always received more attention in the advanced economies due to economic crisis; however various form of skill mismatch are always present in the labor market. Skill demand and supply are influenced by a range of factors including for example the level of economic development of a country and technological change. For this reason, the implementation/formulation of effective education and training policies are become really important
above all after the crisis.
However, in this chapter will be analyzed only two types of skills mismatch6.It are due simply because they are really common for young people and for this reason they have been included: the first one has the aim to compare the level of school education between employed and unemployed. As primary comment, there is a high risk of mismatch for those at the bottom at the educational pyramid. The second type consists in the mismatch between jobs held by young works and the qualifications they possess. The main result is that type of mismatch are that youth (meaning in this case people aged from 15-29) are more likely to be exposed to over-education than workers aged 30 and above.
1.3.1 Skill mismatch between labor supply and demand.
The skill mismatch between labor supply and demand of skill has been quantified using an index called “Duncan and Duncan index of dissimilarity7”. Its aim is to compare the structure of educational achievement of the employed and unemployed, capturing the mismatch if unemployment rates differ among workers with different level of education achievement8 . This index has a range equal from 0(no mismatch) to 100(full mismatch), with value equal zero if workers with primary, secondary and
tertiary education have the same rate of unemployment rate.
6
However, there is a need to underline that that there is no agreed definition of skills mismatch. It is a term which refers to various types’ imbalances between skills offered and skills needed in the world of the word. Additionally, each type of mismatch can be measured in several ways, with relative advantages disadvantages. Taking in consideration these issue, the choice has been to analyze the mismatches describe in the chapter.
7 It is the most widely index know to measure segregation by sex( Anker, Melkas and Korten, 2003) 8 For more detail about it use, see Johansen and Gatelli(2012)
16
Several type of this skill mismatch has been seen among countries. Considering as sample of 28 European Countries, skill mismatch was less than 10 per cent in 8 countries in 2011, exceed 20 in four Countries (Belgium, Finland, Luxembourg and Sweden). Furthermore, there is a need to underline that this skill percentage of skill mismatch is not an indication of quality of school system, because if it would have been really of high quality, it would improve the employability of workers. A high level of mismatch corresponds to wide differences between unemployment rates between youth with different level of education. Considering Sweden , for example, the youth unemployment rate with primary education or lower is equal to 38.6, is more than three times the rate for youth with tertiary education(1.2.4 per cent). However, there is a need to underline as there is also example of countries with more similar problem of unemployment rate by level of education, which is reflected in a low value of the mismatch index. In Switzerland, for example, the index was 1.6 per cent in 2011. The youth unemployment rate with primary education was 7.8 per cent in 2011 on this country, compared with 7.5 per cent for you with secondary education and 8.5 per cent for youth with tertiary education. As explained before, Belgium has a relatively high level of mismatch; it is increasing in the recent years because of deteriorating position of workers with a low level of education. The youth unemployment rate for workers with primary education in Belgium increased from 2009 to 2011(from 30.2 to 31 per cent). This trend has been confirmed by the whole 28 countries, the unemployment rate for youth with primary education increased, while the unemployment rate for youth with tertiary education decreased in 17 out if 28 countries.
17
1.3.2 Skill mismatch by occupation.
Another type of skill mismatch, very linked with labor supply and demand, is the skill match between the skills that young people have and skills required in their job. In fact some (a lot) workers can be undereducated or overeducated for their jobs. Regarding the issue of over education, this type of mismatch has been rising in many countries; it can be explained by competition for jobs, which pushes the better educated into jobs or occupations with lower remuneration usually taken by people with lower education. Furthermore, there is a need to underline that this type of skills mismatch has negative implications and they are going to increase in times of economic and labor market crisis.
1.4 NEET young people.
NEET young people are which ones that are employed, neither in education nor in training aged
15-29. Its rates have risen in 30 of 40 countries with data available to ILO. It is very important issue to take into consideration, mainly because it is a very feature of young
people that, after completing their high school, are forced to be in this “State”, without having possibilities to avoid it. NEET people have to be distinguished from the newly coined NLEET use in 2013 in Global Employment rate for youth by International labor Organization. It include young people “neither in labor force nor in education, employment and training”. It is similar to NEET but excludes the unemployed since they are still included in labor force. The figure 2 shows the latest result by IL considering their “relaxed” definition of NLEET:
18
Figure2: Young People that are neither in employment, nor education or training (NEET) as the share of population age 15-29(2007 and 2012)9, considering relaxing definition.
9 Source: ILO (2013, table 10C).
0 5 10 15 20 25 30 35 40 45 Turkey Israel Mexico Bulgaria Spain Italy Greece Ireland Hungary United States Poland United Kindgom Portugal Estonia France New Zealand Belgium Canada Czech Repubblic Finland Australia Germany Denmark Slovenia Austria Switzerland Sweden Norway Luxemburg Netherlands 2012 2007
19
1.4.1 Policies for youth employment.
Youth Employment crisis won’t have solution without strong youth employment policies which will lead to employment growth; this requires coordinated policy efforts to support aggregate demand via macroeconomic policies, and expansion of domestic economies.
Furthermore, also policies which increase productive investment and improve access to finance can have a positive impact on young’s people employment prospects; this can be done through:
-Encouraging economic diversification;
reducing macroeconomic volatility;
-helping people for access to credit for enterprises(micro-small and medium sized); -having funding for targeted youth employment interventions. Also if we have to underline that there are several sectors have been identified with a high
job-creation potential, such as green economy, health and social care, information and communication. To confirmation of this also an econometric analysis about the impact of macroeconomic
determinants on youth employment has been done by Matsumoto ET all (2012). They affirmed that higher is investment; lower is the youth unemployment rate in both industrialized and low and middle-income economies. However, investment is strongly linked to access and cost of credit: when banks don’t want to lend money, or they want to lend only with a high interest rate, firms have more difficult to hire young workers.
Furthermore, also policies that offer fiscal incentives, support development of infrastructure can offer a wide range of youth employment opportunity.
1.4.2 Policies for training and education.
Training and education are very important for youth employment outcomes. Despite significant improvements in educational attainment, there are several countries (above all developed ones), in which people have lower level of education. In order to respond to labor market requirements, training and skills via education should ensure skills which are useful for employment. The presence of work-experience components in technical vocational education and training (TVET) is very useful
20
because it increases the capacity of trainers to improve their skills. Also the employment services have a significant role to help people from school to work transition. In particular, through individual career guidance, the preparation of functional curriculum vitae and support in the development of employment plans, cab be very useful for young people for the first time(and not only in labor market). This services can be realized also in collaboration with education institutions providing their career guidance; detailed occupation information, including clear indications of main duties,
environmental factors, and salary range for the various entry point.
1.4.2.1 Dual apprenticeship system.
The “dual system” of apprenticeship combines school-based education with in-company training. It is a system of learning for work in Austria, Denmark, Germany, and Switzerland. In these countries, low youth employment rate is often attributed to the effectiveness of this system, which provides a lot of young people with high education and training recognizing qualifications demanded by enterprise. The content of the German system includes the following features:
-The content of training is determined jointly by government, representatives of employer’s
organization and trade union at federal level;
Individual firms choose their own training methods;
Training costs are shared between the government and employers; in particular governments covers the school-based component; employers finance enterprise-based training);
Qualifications are awarded upon completion of written and practical exams, set and market by
tripartite external examiners;
-After graduation, workers can apply to their current employer or another for employment10.
21
1.5 Youth targeted labor market policies.
Labor market policies and programs can be very useful to improve labor market integration of young people.
Active labor market policies (ALMP’s) focusing on employment planning and job search has been really effective to help people to find a job11. These interventions usually combine education and training with work experience programs and job search assistance ,as well as incentives for employers to hire disadvantages people, as for example wage subsides, tax cuts or social security exemptions for a limited period for employers who hire young people.’ In February 2013, the European’s (EU) Council of Employment and Social Affairs Ministers approved “Youth Guarantee”, with the aim to offer an employment, continued education, an apprenticeship or a traineeship within four months of leaving school or becoming unemployed. In addition, has been allocated 6 billion for the period 2014-2020 to regions where youth unemployment rate exceeds 25
per cent12.
Targeting of disadvantages group in the labor market is crucial for the design and implementation of ALMP’S. There are many examples of approaches that establish “profile” for young people, these approach also have the advantages to allocate resource more efficiently because they allow to providing intensive employment to disadvantages youth.
11 ALMP’S policies topic will be treated in very detailed way 12 European Commission, 2013.
22
1.5.1 Youth guarantee as response to the youth employment crisis.
The first countries to implement youth guarantees in the 1980s and 1990s were Denmark, Norway and Sweden; more recently, other countries are implementing it, as for example Austria, Germany,
The Netherlands and Poland.
Its main aims are to promote labor market integration and prevent long-term unemployment and discouragement among young people; are broadly similar across country; also if there are some differences between programs, as for example eligibility criteria, duration of intervention and
compensation.
Swedish youth guaranteed, which regarded youth unemployed aged 24 years, participating in the program in 2008 were able to find a job faster than a control group of participants in other PES
measure.
Also if other evaluation are needed, and an ILO overview confirms that youth guarantee can play a very important role in reducing long term unemployment and discouragement among young man and women13. However, the same overview underlines the need of implement funds dedicated to it; ILO’s cost estimates suggest that it can be implemented at an annual cost in mean between 0.5 and 1.5 per cent of GDP. The variation of costs is due by the availability of administrative infrastructure for the implementation of guarantee on large scale.
23
1.6 Conclusion.
The aim of this chapter is to give an overview on youth and their relative issues: firstly, as explained at the beginning, there is a need to define what “youth term”, include (and how there are several for youth in different countries). After, youth unemployment and employment rate is analyzed for all worlds: OECD Countries, Middle East, North and Sub-Sahara Africa, North and South Asia, and at the end Latin America and Caribbean. The next step is to question if really a youth labor market exist, simply because there are several obstacles (a completion with adult), that suggest that in some case youth labor market is only a utopia. And it also for this reason that the next step is to analyze youth labor market in developing and developed countries, making comparison where useful and underling differences (clearly a very important role is played by job part-time and its incidence in both markets) A part of this chapter is used to describe youth employment skills and the their mismatch between supply and demand ;but unfortunately it is not the only one: a paragraph indeed describes also skill mismatch by occupation(they are the most frequent and important mismatch in the labor, so other types have not been taken into consideration). The last part of this chapter is dedicated to analyze a most important issue that it can be considered also worse that “general” unemployment issue: in fact, it considers young people that are not in employment, but additionally, there are not in training too. In the last five years there have been a lot of policies actuated to help them to get job (via training or via occupation); and for this reason two most important programs are analyzed: Youth Guarantee and more generally, dual apprenticeship system.
24
Chapter 2 : Minimum wage, labor market institutions and policies: a cross
sectional analysis on their impact on youth employment from OECD
countries.
2.1 Labor market institutions: definition.
The laws, practices and policies which can be defined as labor market institution determining which type of legal contract is permissible, set boundaries for wages and benefits , hours and working conditions; define the roles of collective representation and bargaining, providing social protection for workers are called labor market institutions. The existence of these institutions is due to the imperfect information, not equal market power between employee and worker, discrimination and inadequacies of the market to provide insurance for employment-related risks. They were born in the second half of the 19 the century after the industrialization of Western Europe and North America
2.1.1 The aims of employment protection legislation.
Employment protection legislation (EPL) is one of the most important labor institution which provides measure job security by restricting the ability of employee to hire worker with the aim of determine work and by making dismissal cost. In particular, the EPL regards to the method of start and end of employment. EPL provide measure of job security by restricting the ability of employee to hire worker with the aim to determine work and by making dismissal costly. Governs introduce these two
25
types of rules to give an insurance in the case of job loss and to give at the employee some social responsibility in the sense of assuming some commitment to the employee. 14
2.1.2 Economic theory on EPL: the neutrality case.
Economic theory on EPL and its no effect on employment, welfare and profit for firms, taking into consideration the neutrality case explained by Lazar(1990), which occurs when we have three conditions:
-1 workers are risk neutral,
-2 Wages are flexible, not wage floor, (then not minimum wage or collective agreement),
-3 EPL consist only of the transfer component, while tax component is equal to zero.
Lazar talks about neutrality because EPL affects only the intertemporal structure of wage, leaving the net discounted value of a job unchanged. Suppose we have initially two time periods, with a wage equal to win both periods, reminding that we are under risk neutrality assumptions and not wage floor. Now we introduce an EPL cost which employee have to pay after the two periods. The aim of the employee is to pay the same wage with and without EPL policies, so it means that he offers in the first period lower wage (W-B), where B is the bond entitling to the worker TR in the second period.
26
2.1.3 Unions and collective agreements: impact and role.
Unions and Collective agreements are probably the most difficult and controversial labor market institutions to analyze, also because they influence living standard, and in our case of interest both minimum wage and employment rate for youth. Economist have recognized several roles to the unions, above all to negotiate higher wages, better condition and benefit; but often it can be done through efficiency cost.
2.2 History of trade unions.
Trade unions are voluntary organizations; their aim is to protect the interest of their enrolled. First trade unions born in the XVIII century in the United Kingdom with the aim to give insurance to the artisans in case of unemployment. With the pass of the time, they transformed itself in industrial trade unions to represent workers with intermediate-high skills.
Actually join a union depends by several factors, one of them is also the collective bargaining system. In some people we have local negotiation; on other one it is national. Generally, trade unions negotiate all aspects of a contract. In detail way, they have a very important role in the determination of wage (minimum if it is applied), benefits, security and insurance.
2.2.1 Economic analysis of the union: the utility function.
Economic analysis of union is based on the fact that it can be represented through a utility function, as well as an individual. Generic assumption is that the utility of union depends positively by the wage W and Occupation E. Then the indifference curve or union is represented in the usual form as we can say in the following diagram:
27 Diagram 1
The firm is represent by a demand of work upward which determine the optimal quantity of work, in the sense of maximization of profit, to use for any level of wage.
2.2.2 The assumption of monopolist union: interpretation of the graph.
At this point economist use a very strong hypothesis called hypothesis of monopolist union15: It chooses the level of wage compatible with their goals, in equal way of a monopolist which
determine the price of his/her product. 16 If, given a wage, firms cannot transfer form demand curve, the hypothesis of union monopolist which maximize owner utility, led to a representation of agreement between firm and union as the point M in which demand curve is tangent to the indifference curve of union U, where the competitive wage of union is w*. Without union, firm would hire E* work. Union instead wants a wage equal to We e so firm cut occupation. In that way some workers don’t work, and it is clear that union would have major utility if labor demand would be
15
See Borjas, Chapter 10 “Unions”. Italian Version by Lorenzo Cappellari
16 “Alternative hypothesis consider that also the firm can have some contractual power. In that case the equilibrium would
28
inelastic, that is the firms react less because of a variation of wage. In the figure above that situation is represent by the curve D’ (more inelastic than D), and M’ curve (higher wage), so union could reach an indifference curve with major utility.
2.2.3 The unions and the efficiency of the labor market.
In the sector where we have the presence of unions, the wage is higher despite of a competitive market, and so the occupation is lower. If the worker of the union market find job in a non-union market, where wage and occupation are determined by the market, the oversupply is absorbed by wage cuts.
2.3 What happens to the market equilibrium without unions?
Without unions, the competitive wage is w* and the sum of national income is given by ABCD and A’BCD’. Unions increase wage in the sectors one. Hired workers move to the sector 1 to the sector 2 decreasing wage never contract by the union Win. In that case the sum of area reduced national income of the area of triangle EBF, which is defined as net loss of production because union is hiring few worker and the not-union market is hiring too many worker.
29 Diagram 2
30
2.3.1 Efficient contract and contract curve: Why both do firms and unions move of their initial point of equilibrium?
The following table shows because both firms and unions have an incentive to move on the equilibrium on the labor demand curve:
-Diagram 3
The competitive point of equilibrium is P (with wage w* occupation E* and utility of unions U*). The equilibrium point of Union is M where we>w*, me<E* and Um>U*. Union accepts all contracts along the M curve and above the utility curve UM, while the firm accepts all contracts long or under the is-profit curve πm. In point R, unions is better and firm is not worse than point M. In Q point employee is better and union is not worse. Any point in line RQ is a Pareto improvement despite of equilibrium with monopolist union.
31
2.3.2 The relationship between labor Market Institutions and minimum wages.
An important part of today’s labor economics has been increasingly concerned with the issue of labor market institutions/regulations, and their interactions and impact. In particular, the interactions between minimum wage and some institutions are really evident if we consider, for example, that they cover minimum wage setting. It is the case of trade unions; they have a really and determinant impact on minimum wage (and its increase or decrease), so we cannot talk about minimum wage without consider labor market institutions and their interactions.
2.4 Minimum wage: A brief history-Which is its role in the global economy?
Minimum wage was for the first time introduced in New Zealand in the late 19th Century, and now is adopted in several counties. Minimum wage can be a most important and powerful tool to support decent work goals, but it can be also crucial to improve social protection floor, poverty alleviation effort and above all equality of work. So the increasing of the minimum wage with the pass of time has become very important because it can help to rebalance the sources of growth. In the last decades there has been an increasing interest about the role of the minimum wage; for Example In Brazil it has been consider the key role to reduce poverty, while China the increasing has been considered the most important policy to reduce inequality in the country. In the United Kingdom, where the minimum wage was introduced at the beginning of the twenty-first century, it was considered as a successful Government policy. Also in the United States, the introduction and then the increasing of it was considered a redistributive tool, in the sense of equality and poverty. The increasing of the minimum wage can stimulate also domestic aggregate demand. It was the case of United States, Japan, China and Germany, where also with two different, but interconnected
32
strategies, were able to stimulate the aggregate demand via increase of the minimum wage. So, in this context, minimum wages if set and operated effectively can play a key role to reduce inequality and support demand transferring resources to low-paid workers. Such redistribution can have positive demand effect because the marginal propensity to invest out of profit17. For sure higher minimum wage stimulate investment by the family, because higher minimum wage above all among the low and middle income groups can lead to a virtuous cycle of greater consumption due to the increasing of power of purchase and also create more employment opportunities.
33
2.4.1 The aim of the minimum wage and its system across the world.
The primary aim of minimum wage has been to increase equality, but this can happen only if we increment the number of people which are “legal covered” by the minimum wage.18 The ILO working condition Law report show us, as 151 countries and territories which are actually implementing the extension of the number of workers covered by the minimum wage. For sure there are differences about the method and also the time of implementation of working conditions which can vary by state. Figure 3 shows the minimum wage system across the world (the percentage covered by the simple national or regional minimum wage or by multiple minimum wages by industry).
34
The figure clearly shows as in the word the percentage of States which adapt simple or regional minimum wage is exactly the same of that one having multiple minimum wages. However, it is able also to show the difference between regions: excluding Asia and The Pacific Area, other parts are dominated by a net using of one of them.
2.4.2 The successful of minimum wage policy.
Another issue to consider is that the success of the policy about minimum wage depends also by the level at which it is set. If it is low, it could be not effective in the aim to ensure living standard conditions, and so, there will be no investment, consumption, then the aggregate demand would fall. But, if it increases suddenly, we could lead to inflation and hurt employment (Belser and Sobeck, 2012). The ILO minimum wage fixing convention, 1970 number 131 at article 2 states: “Minimum wages shall have the force of law and shall not be subject to abatement, and failure to apply them shall
50 35 50 35 87 42 50 65 50 65 13 58
All regions Africa Asia and The Pacific
Europe and CIS Middle East Americans and The Caribbean
Determination of Minimum wage across the
world
Figure 3
Simple national or regional minimum wage
35
make the person or persons concerned liable to appropriate penal or other sanctions.”, while articles 3 states: “The elements to be taken into consideration in determining the level of minimum wages
shall, so far as possible and appropriate in relation to national practice and conditions, include: -(a) the needs of workers and their families, taking into account the general level of wages in the
country, the cost of living, social security benefits, and the relative living standards of other social groups; -(b) economic factors, including the requirements of economic development, levels of productivity and the desirability of attaining and maintaining a high level of employment19. So in that convention the man is the centre of interest and need; the role of minimum wage should be to guarantee the satisfaction of the worker and his family. One way to fix the minimum wage is using the ratio of minimum to median wage, but however there are other instruments to do that(also if the first one is the best way to measure and then most used).
2.4.3 The compliance of the minimum wage.
First off all, the degree of compliance depends on the complexity of the system. In uniform system it is easier to ensure compliance despite of system of a multiple minimum wage rate (as for example happens in Italy). Second, if there is higher minimum wage, it could encourage the informal economy. Another thing to consider is that high rate of compliance required a coherent strategy based on labor inspections, information. There are many way to measure compliance: one could be calculating the share of workers’ earning less than the legal minimum wage. The rate of compliance also depends on the level at which the minimum wages are set. However, the most important thing to take into account is that if the minimum wages are set appropriately and operated effectively, the low paid worker will have benefits. It happens in some Latin American countries, where both the institution of a minimum wage and sudden its raising with effective social protection measures led to an improving of the economies of this countries.
19 Furthermore, actually this convention provides for the possibility of sub-minimum wage for youth, referring to training
36
2.4.4 Minimum wage and employment
: competitive labor market theory.Labor marketis the place where workers and employees meet and compare wages with supply of occupation. In the perfect and competitive Labor Market the interaction between demand of work (employees) and supply (workers) give us the equilibrium level of wages and work: the level of wages and occupation that equal the number of hours which employees offer.
37
2.4.5 How to interpret the graph.
As we can see, the labor supply is upwards orientated, so the substitution effects prevail on income effect. The demand is downwards orientated. The equilibrium level of wage and occupation is in the point where labor demand is equal to labor supply (w* and L*). So, at equilibrium point we have L number of worker at wage equal to w*. If the minimum wage is above to that of equilibrium, the employment unequivocally be reduced from L* to Ld., and labor supply exceeds labor demand. The quantity of this effect depends by how much the employee are able to substitute workers with other factors(so called substitute effect); more technically it depends by the elasticity of demand, so if demand for labor is inelastic, unemployment effect could be not so much severe.
2.4.6 Higher minimum wage: Which are the effects?
A higher minimum wage attracts other workers, and the state of this depends by how are considered “unemployed or discourage worker”, for sure the increase of the minimum wage has the effect to “invite” other workers to become active in the search of work, but also could discourage mostly the workers because there are fewer possibilities to find a job. Impolite in 2003 showed as the competitive doesn’t tolerate much impact of a binding minimum wage if, as several empirical studies have revealed worker can adjust effort level. This theory is more similar to efficiency wage effect, in that sense the disequilibrium caused by the minimum wage in traditional model cannot persist. So in this model the introduction of minimum wage create unemployed. There are a several assumptions which make the model not realistic and the most important is the idea of perfectly competitive market.
38
2.4.7 Monopsony in the labor market.
In a non-competitive labor market characterized by several imperfections, the consequences of an introduction of a minimum wage are very difficult to predict. Introducing a minimum wage we can effectively increase employment (also for youth), but only if employees have monopolistic power, and there are some externalities connected to the job searching. A non-competitive labor market is the monopsony, where we have one employee and more workers, a situation in which an introduction of minimum wage led an opposite effect, so it increases employment instead of decrease, within some relevant range of wage. So, to attract additional labour, it has to increase wage, but instead if it decreases wage not all labor force will be lost. In the monopsony minimum wage has the role to equate marginal cost to average cost rendering a part of monopolist’s supply and marginal cost of labor coincident, so eliminating the constraints posed by the rising marginal cost associated with hiring an additional worker and induces the monopolist to increase employment. However, the increasing of wage depends on the elasticity of labor supply.
39 Diagram 5
Mathematically speaking, the pure monopolist chooses the employment level that maximizes profits.
40
2.4.8 The introduction of minimum wage in monopsony labor market.
In case of introduction of minimum wage in a monopsony labor market, the labor supply became horizontal, the wage up to the point at which minimum wage intersects demand curve. This is illustrated in the diagram below (MRP)
41
In the same way, because of monopolist pay less than marginal productivity of labor, the wage will be less in case of competitive labor market. Generally, we can say that the difference between two wages can be considered as a signal of the monopolistic power of the employees; it increases when the slope of labor supply increases and, in detail way, it decreases when the elasticity of labor supply respect to the wage. In a monopsony labor market, then, a minimum wage fixed at intermediate level between monopsony and competitive equilibrium, led to an increase of both wages and employment. However, it is very important to underline as a wage higher than the one of the competitive labor market, could led to a level of employment that would be inferior to the level of competitive labor market. So, in the monopsony, we have a non-monotonic relationship between minimum wage and employment: for low levels of minimum wage, its increase led to an increase of employment, while after threshold we can observe the traditional negative relationship between minimum wage and employment. Some studies regarding the introduction of the minimum wage in a labor market have not been taken into consideration because it is not so easy to have a market where we have only an employee.
2.5 Is it possible to increase employment introducing a minimum wage in a monopsony labor market?
Several economists tried to give an answer to this debate question. The most influent part of them, affirm that it is possible only if the wage is not really high, and that the effort of the workers to finding a job is sensitive to the variation of wage.
42
2.5.1 Minimum wage in dual economy.
Minimum wage cannot have a negative effect on employment in a dual economy in which the minimum wage is not applied to the secondary o informal market.
However, in this case, we can have some negative effect that has been defined by economist as spillover effect. As affirmed by Garlic (1976), Mincer and Welch (1976), an increase of minimum wage in the covered sector, led some workers pass from the cover to uncovered sector; so as explained in the figure, if in the uncovered sector labor supply increase, it led to a decrease of wage. In this case minimum wage has the function to transfer workers from covered to uncovered sector generating a higher difference between the two wages. This is explained by diagram 6
Diagram 6
Sector Uncovered by minimum wage Ws
SS w
Ws
DS
Sector covered by minimum wage
E m
S w
43
2.6 The efficiency wage model: the effort curve.
Efficiency wage model suggests firm to pay a wage major to that of full employment so the workers will be more productive. It implies less labor force turnover, less cost training and better motivated worker. So, for the efficiency wage model wage doesn’t reduce wage because it would mean reduce productivity. All this is explained by the effort curve(diagram 5), based on idea that effort depends on the real wage that workers receive; if the wage is low, hardly the worker offers effort. So the effort increase only if the real wage increases20 the curve flattens out because there is a part of effort which doesn’t depend by the real wage. Firms will choose to pay the real wage that achieves the highest effort per dollar of wages. This is also called efficiency wage.
44 Diagram 7
45
2.6.1 The introduction of minimum wage in efficiency wage model: diagram and interpretation.
The following diagram shows what happens if we introduce a minimum wage(higher) in the efficiency wage model:
Diagram 8
As we can see workers working at WE and will not put so much effort per dollar as worker receiving W *. So if we take into account the efficiency-wage model employees pay a wage equal to w because workers will be more productive. But this model has some implications as, for example that
employment only varies when MPN* curve shifts and as we discussed before real wage is determined only by effort curve.
46
2.6.2 Heterogeneous labor model.
Heterogeneous labor model instead is recently integrated into minimum wage analysis. Usually low wage groups are formed also by relatively skilled and better paid worker, often doing the same tasks and which are not affected by the minimum wage. That one are used as substitute of that worker directly affected by the minimum wages, causing a decline in overall employment but led to a wrong conclusion that the balance of overall unemployment effect of minimum wage may be very small.
2.6.3 Effort model.
The last model is the effort one. It is a variant of the traditional model. The final conclusion of this model can be summarized in the following way: -Initially a minimum wage reduces employment however it led to a competition among workers decreasing the low-rent marginal worker out of the market. At the end all this erodes the rent conferred by the minimum wage to low-rent workers and increase the value of marginal product, so if the minimum wage led to more money income on low-skilled worker, it has little effect in rent to a worker, employment, total output and firm profits.
2.6.4 Should minimum wage be increased or decreased?
The model on minimum wage which have realistic hypothesis (as for example the monopolistic power of firms) admit that the minimum wage fixing is an issue of fine-tuning: in fact, if it is fixed at a very low level, it loses its functions, but vice versa, if it is fixed at a very high level, we can have worst results of monopsony because total surplus would be less than its amount in the absence of minimum wage. Some studies tend to confirm that a decrease of minimum wage could give the opportunity to some less productive workers(as young and not-qualified workers) to get a job; this can be considered definitively true in economies with very high unemployment rate for same categories(as can be young people). On the other way, some economists tend to be agree with an increasing of the
47
minimum wage because of some group of workers tend to be less influent than other during collective agreements, increasing inequality. In this context, minimum wage has to be understood as an instrument to reduce poverty. Obviously, this theory has found very support in the part of population potentially and positively influenced by the increasing of minimum wage.
2.7 Economic literature about minimum wage.
Economic literature on minimum wage is very vast; for example Newark and Washer (2004 and 2008) provide an in-depth review on the field, which continues to be characterized on how minimum wages affect employment in general and also for youth. Although early research on the topics consists of a mixture of a case studies and state panel estimation, recent research tends towards the latter, generally using time period fixed effect, specific linear time trends, and geography-clustered standard errors. In addition, recent empirical specification includes covariates that capture non-linear difference and difference in local climates. For example Orrenius and Zavodny (2008) use a broad of a set of business cycle controls(in addition to dummy time-series) to account for differing economic environments across states and over time; then they find no adverse effect of the minimum wage on the employment, but above all for less-educated adult. Taking this step further, Allegretto and All (2011) demonstrate substantial heterogeneity in employment patterns across regions of the U.S and control for this by allowing time period effects to vary by Census Division; they find no effect on minimum wage on teenage and youth employment. There are also recent studies which have to view state-induced variation as suitable for identifying the employment effect of minimum wage laws (e.g. Pedace and Rohn, 2011; Sabia et al, 2012), but partly to facilitate credible identification , the type of data employed in minimum wage research has shifted 21. Historically,
21 Using the within-state variation still averages change to the federal minimum wage: if the federal minimum wage floor
increases, this effectively acts as a “negative” treatment to the wage differential between states that already use a super-federal minimum wage (and leave it unchanged) and those for whom the super-federal minimum binds. In my opinion Baskaya and Rubeinstein (2011) use and interesting approach, due to the fact that they use a hybrid approach. They allow the
48
nearly every minimum wage analysis use individual-level (survey) micro data samples, but there are also recent research that use administrative data as the Quarterly Census of Employment and Wages (QCEW), provided by the Bureau Labor of Statistic. In addition, Addision at all (2009) use these data on the county-level population of retail employee and find little evidence of not employment effects. Also during county-level data in the QCEW, Dube et al 2010 compare contiguous counties across state lines and in the same way they find no effect from minimum wage differential. Then, of course, there are very recent studies which apply novel techniques to this question. For example, Sabia et al (2012) created a synthetic(in the sense of experiment) control for New York to study how the state’s recent minimum wage increases affected low-wage teenagers and young; so estimating a large and significantly negative employment elasticity on minimum wage. A very important exception is the work made by Dube ET all (2011). In fact he examined the relationship between minimum wage and employee turnover using the Quarterly Workforce Indication (QWI), focusing on youth restaurant employee, and using a short panel of contiguous across state lines; found that the minimum wage reduced both new hiring and separations despite having little effect on employment levels. As mentioned above, the difference in features characteristics of “the national minimum wage research” is characterized by a shift away from a reliance on time-series variation in minimum wages towards the use of cross-sectional or panel data to identify the employment effects of minimum wage laws. This change was motivated by the fact that the using of time-series evidence on minimum wage effects give us important limitations, also because there have been relatively few legislated minimum wage changes. Another relatively advantages is that using cross- sectional or panel data to study the minimum wage effect it may provide potentially valuable information on how the minimum wages interact with other labor market policy( as we are will see to see after) that could be directly or indirectly associated with the minimum wage.
variation of the minimum wage levels to determine the potential of each state of change to the federal minimum wage, and then instrument for these “minimum wage gap” in a structural model using a political ideology. Finally they find that minimum wage have significant not employment effect for youth and teenagers, but only when accounting for this variation across states.