Introduction
Growing interest is focusing on the exposure to stress and psycho-social factors at work. One of the most important aspects in this matter is how to define a proper methodology for the assessment of occupa-tional stress. In fact, preventive approaches are based
on risk characterization, which is the first step towards any intervention strategy. Differently from other types of risk factors represented by chemical, physical or bio-logical agents, stress-related risk factors are more dif-ficult to estimate with quantitative approaches. Various attempts are being applied and according to the most consistent literature the evaluation of health risks related to job stress involves three classes of variables: job
An Integrated Model for the Assessment of
Stress-related Risk Factors in Health Care Professionals
Elisa ALBINI
1, Silvia ZONI
1, Giovanni PARRINELLO
2,
Laura BENEDETTI
3and Roberto LUCCHINI
1*
1Department of Experimental and Applied Medicine, Section of Occupational Health, University of Brescia, P.le Spedali Civili, 1 – 25123 Brescia, Italy
2Section of Statistics and Biometry, University of Brescia, Italy 3Local Public Health Agency, ASL Brescia, Italy
Received February 21, 2008 and accepted March 11, 2010 Published online in J-STAGE September 1, 2010
Abstract: To assess the risk from exposure to occupational stress and burnout in health care workers (HCW), a cross-sectional study was planned to compare objective data that can repre-sent potential job stressors in hospital wards and subjective symptoms reported by the workers. Medical doctors, nurses and ancillary workers of the Internal Medicine Wards of a large pub-lic hospital in Northern Italy participated in the study. Three subjective questionnaires were administered: the Job Content Questionnaire (JCQ), the State-Trait Anxiety Inventory (STAI), the Maslach Burnout Inventory (MBI). In addition, seven objective parameters were col-lected as average during the 3 months period prior to the study: a) working understaffed; b) ratio number of patients/HCW on service; c) ratio number of HCW on sick leave/ HCW on service; d) number of skipped days off after night shifts; e) days of sick leave; f) number of deceased patients; g) number of accidents at work. A total group of 230 HCW were examined, employed in six different sub-units of the Medical wards. The female workers were 67.8% and the male workers 32.2%, the mean age was 37.4 yr (SD 9.3) in the total group of HCW, 35.1 yr (SD 7.9) in females and 42.3 yr (SD 10.3) in males. The average scores of subjective and objective parameters resulted significantly higher in the same sub-units. The correlation analysis showed that the subjective questionnaires were highly inter-related. The multivariate analysis showed that the days of sick leave were significantly related to the subjective questionnaires, and the subjective subscales of emotional exhaustion (from MBI), job demand and decision latitude (from JCQ) and STAIt were significantly related to some of the objective parameters. These results support the integrated use of multiple subjective and objective assessment as the most appro-priate approach for the evaluation of occupational stress.
Industrial Health 2011, 49, 15–23 ronmental conditions thought to impact on the workers’
health and well-being (work overload, excess respon-sibility, time pressure, role conflict). Strain involves the worker’s psychological and physiological reactions to such exposure (anxiety, depression, mood disorders, elevated blood pressure, increased production of stress hormones, including cortisol and catecholamine). The
health outcomes refers to adverse health outcomes such as depression or hypertension possibly resulting from the exposure to job stressors. The literature on job stress measurement is quite extended. A review by Hurrell et al.1) summarized three main approaches: the use of instruments developed for (a) self-reported measures, (b) “objective” observational measures of job stressors, (c) self-reported and physiological measures of strain. A large number of individual self-reported scales are available. They are designed to assess a wide range of job stressors, related to temporal aspects (amount of overtime, time pressure, time flexibility, shift work) work contents, work-group factors, leadership style and organizational conditions (work tasks administration, information quality). The most widely used are the Job Diagnostic Survey (JDS)2, 3), the Job Characteristics Index (JCI)4), the Occupational Stress Indicator (OSInd)5); the Work Environment Scale (WES)6), the Occupational Stress Inventory (OSInv)7), the Stress Diagnostic Survey (SDS)8), the Job Content Questionnaire (JCQ)9), the Generic Job Stress Questionnaire (GJSQ)10), the Job Stress Survey (JSS)11).
Limitations of self-reported instruments in job-stress research have been extensively reported12–15). These limitations are particularly evident in epidemiological research, where investigators have generally used self-reported measures of job stressors and strain, without objective observation.
Objective measures of job stressors are generally dif-ficult to obtain. Nevertheless, several attempts have been realized to develop observational methods. An observational approach does not rely on the job percep-tion of the working environment and therefore is con-sidered as more objective. One of the first measures of this type was developed by Elo and Vehvilaienen16) at the Finnish Institute for Occupational Safety and Health. An other observational instrument was developed at the Tecnical University of Berlin17). Studies using these instruments showed an association between job stress-ors and psychosomatic complaints and objective out-comes such as accident rates among bus drivers18–20). Nevertheless, although very appealing because of their presumed objectivity, observational approach shows also a number of drawbacks. Gathering observational data on job stressors can be most reliably performed only by trained and experienced observers, otherwise
also these “objective” assessment may be influenced by the observer’s interpretation. Moreover, the observa-tional methods require to adapt to the specific job being assessed.
Self-reported strain measures have been commonly used in the job-stress literature to assess anxiety, depres-sion, general psychological and physiological distress and burnout. Many of these indicators were not spe-cifically developed to address job-related strains. The limitations of self-reported strain measures are also doc-umented: in addition to shared response bias, the con-temporary use of self-reports of both job stressors and strains increases the potential for conceptual overlap in the measures. Such studies are subject to what Kasl13) referred to as “trivial trap”: a situation in which the independent and the dependent variable largely assess the same construct. Furthermore, stressors and strains, when measured together, can influence the person’s attribution of a particular symptom.
Physiological measures of job strain may be catego-rized into three broad groups: a) cardiovascular vari-ables, b) stress hormones, and c) measures of immune response. Cardiovascular indicators, including heart rate and blood pressure are the most studied physiological indicators.
Each of the above mentioned approaches show advan-tages and limitations. Therefore, the evaluation of job stress should result from an integration of subjective and objective measures of stressors, strain and health outcomes. An integrated assessment of job-stress was applied in this study to a group of hospital workers, and compared to similar experiences on health care work-ers21–23) and workers from other sectors19, 24–27).
Subjects and Methods
Target population
Medical doctors, nurses and ancillary staff from the three wards of General Medicine in a large public hospital in Northern Italy were recruited. Each of the three wards was subdivided in a male and a female section, yielding a total number of 6 sub-units, named A, B, C, D, E, F. The enrolment procedure took place within the health surveillance program of the hospital’s Occupational Health Service. The survey is currently being extended to the other hospital wards of the hos-pital, with the objective of an overall evaluation of job stress in the entire employees population.
Study design
The study was a cross sectional observation with no exclusion criteria. The assessment procedure included meetings where workers were informed about the
study’s objectives and methodology and invited to sign an informed consent upon acceptance. Personal data were treated with confidentiality by assigning an ID code to each participants and eliminating the names from the dataset. Participants were administered self reported questionnaires in groups of 20 individuals. A general questionnaire assessed socio-demographical and work-related variables: age, gender, school title, marital status, number of children, professional job title, work seniority, type of work shift. Three scales were admin-istered to for the subjective assessment of work stress-ors and strain.
Self-reported subjective assessment
Standardized questionnaires were used for subjective assessment of perceived job stressors (a) and strain (b, c): a. The JCQ is a well established and standard-ized instrument for the measurement of perceived stress in the workplace. The Italian version by Baldasseroni et al.28) was used in this study: it includes 47 items for the assessment of the three dimensions of decision latitude (DL), job demand (JD) and social support (SS). Higher scores of JD and lower scores in the subscales of DL and SS indicate higher job stress.
b. The Maslach Burnout Inventory (MBI) was used to measure the perceived strain29). This scale has been designed to assess the “burnout” syndrome in human service professionals. The MBI evaluates Emotional Exhaustion (EE), De-Personalization (DP) and Personal Accomplishment (PA) through three differ-ent subscales. A burnout condition is given by high scores in EE and DP and by a reduced sense of PA. c. The State-Trait Anxiety Inventory (STAI)30) mea-sures both state and trait anxiety with two subscales (STAIs and STAIt) and is one of the most widely used instruments in social sciences and medical research. The state anxiety subscale is particularly suitable for multiple administration in longitudinal studies. Higher scores in both subscales indicate higher anxiety level.
Objective assessment of stressors
The identification of suitable objective indicators was based on a literature search focused on job-related stress in health care workers, and was discussed with the other occupational health professional of the hospital service. Seven parameters potentially related to job stress were identified:
1. the difference between the number of Health Care Workers (HCW) expected to be hired according to
understaffed);
2. the ratio between the number of hospitalized patients and the number of HCW (patients/HCW) in each sub-unit. The number of patients was weighted according to three levels of patients collaboration: a) collaborative, b) partially collaborative, c) non collaborative;
3. the ratio between the number of HCW on sick leave and the number of HCW workers on service (HCW on sick leave/on service);
4. the number of skipped days-off, due to unexpectedly increased work demand (n. skipped days-off); 5. the days of absence from work due to sickness
(n. of days on sick leave);
6. the number of patients deceased during or shortly after hospitalization (n. of deceased);
7. the number of work accidents causing exposure to biological agents in each sub-unit (n. of accidents). These indicators were collected with the collaboration of the wards head nurses. Each parameter was averaged on the three months prior to the questionnaires admin-istration and for each of the six sub-units in which the hospital wards were divided.
Statistical analysis
Descriptive analysis of the HCW population was per-formed with parametric tests to compare the subgroups of subjects working in the six sub-units. All variables were originally assessed for skewness and eventually transformed into logarithmic form to reach log-normal distribution. The analysis included the general ques-tionnaire on socio-demographic variables, the subjective questionnaires and the objective job stressors.
A stepwise regression was used to assess the possible relation of socio-demographic variables with objective and subjective scores; each score was then adjusted for the socio-demographic variables that resulted significant-ly correlated, using the residuals from each regression analysis. Fisher’s Protected Least Significant Difference (PLSD) was used to evaluate differences in regard to hospital sub-units and job rank. A model of multiple regression was used to assess the correlation among the different subjective methods and, finally, among objec-tive and subjecobjec-tive scores.
Results
Socio-demographic and work-related variables
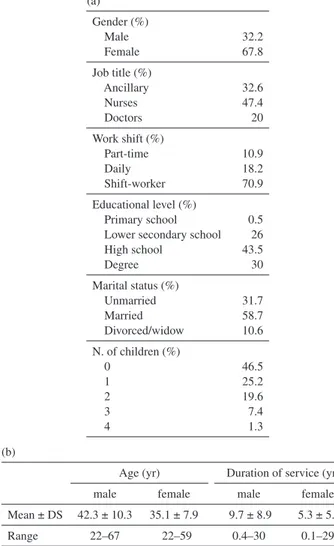
A total number of 230 workers agreed to partici-pate in the survey out of 250 invited (92% participa-tion rate). The 67.8% of the subjects were females,
Industrial Health 2011, 49, 15–23 (SD 10.3) in males, with an average duration of service
of 6.7 yr (SD 6.8) for the overall group. Considering work organization, 71% of the HCW worked on night shift, 18.2% on daily shift and 10.8% worked on part-time. Regarding the job title, 47.4% of the groups were nurses, 32.6% ancillary workers and 20% were medical doctors (Tables 1). The overall group was divided into six the different six sub-units of the hospital wards. No statistical differences were observed among the six
sub-groups in respect of age, type of shift, job title, marital status, number of children, and education level. Gender distribution was similar in the various sub-units except for sub-unit A, where men’s percentage resulted signifi-cantly higher (χ2 p value<0.0001). Among the work characteristics, duration of service was significantly lon-ger for the HCW of sub-unit A compared to B and F (respectively, mean difference 3.761, p=0.01; mean dif-ference 3.451, p=0.04).
The influence of potential confounders on the objec-tive and subjecobjec-tive indicators of stress was assessed with stepwise regression, which showed a significant correlation between age and JD. Regarding the objec-tive parameters, gender and age were related to the ratio “patients/HCW” and to the “n. of skipped days off”, whereas age was related to the ratio “HCW on sick leave/on service” and to the “days on sick leave”.
In the following analysis, the scores of subjective and objective variables were adjusted for the confounders that resulted specifically correlated.
Subjective evaluations
Table 2 shows the mean values, median and ranges of JCQ subscales in the sub-units of the medical wards. The ANOVA showed statistical differences for JD (F=3.511; p=0.0045) and SS (F=3.046; p=0.0112) among the six subunits. Post hoc comparison showed higher scores of JD in unit E compared to unit A and to unit D. The DL score was higher in unit B compared to C; a lower SS was found in department E compared to department B and D (p=0.001) and in F compared to B and D (Table 3). The analysis of subjective evalu-ations according to job rank showed lowest scores for DL and SS in ancillary workers; no significant dif-ferences were found regarding JD. Medical doctors showed the highest levels of PA.
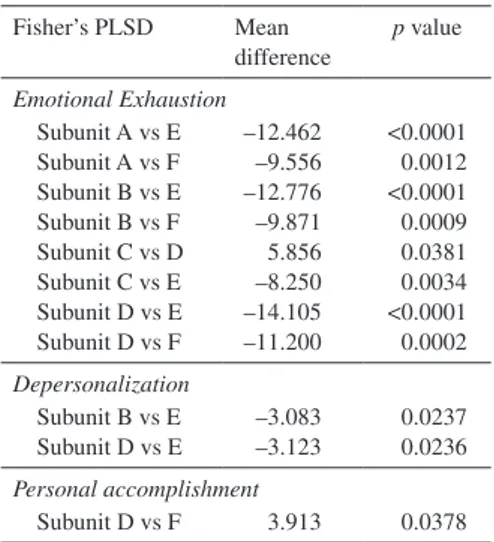
Table 4 shows the mean values, median and ranges of MBI in the sub-units of the medical wards. The ANOVA analysis showed statistical differences of the subscale of EE among the sub-units (F=8.740;
p<0.0001). Post hoc comparison (Table 5) indicated Table 1. socio-demographical data
(a) Gender (%) Male Female 32.2 67.8 Job title (%) Ancillary Nurses Doctors 32.6 47.4 20 Work shift (%) Part-time Daily Shift-worker 10.9 18.2 70.9 Educational level (%) Primary school Lower secondary school High school Degree 0.5 26 43.5 30 Marital status (%) Unmarried Married Divorced/widow 31.7 58.7 10.6 N. of children (%) 0 1 2 3 4 46.5 25.2 19.6 7.4 1.3 (b)
Age (yr) Duration of service (yr)
male female male female
Mean ± DS 42.3 ± 10.3 35.1 ± 7.9 9.7 ± 8.9 5.3 ± 5.1
Range 22–67 22–59 0.4–30 0.1–29
Table 2. Mean scores, median and ranges of JCQ subscales in the 6 subunits of the medical wards
Sub Unit
Decision latitude Job demand Social support
Mean Median Range Mean Median Range Mean Median Range
A 67.8 70 46–94 37.5 37 28–49 22.7 23 17–28 B 68.4 68 44–84 39.7 40 27–51 23.7 24 18–29 C 63.5 63 30–90 40.0 38 29–52 22.7 22 13–44 D 68.1 69 50–78 38.0 38 25–45 24.0 24 17–29 E 66.5 70 30–90 42.3 42 29–56 21.6 23 13–38 F 66.8 66 48–82 40.4 40 31–54 22.1 23 15–28
significantly higher levels of EE in subunit E and F vs. all the others. DP resulted higher in subunit E com-pared to subunits B and D, and PA was significantly higher in subunit D compared to F.
Table 6 shows the mean values, median and range of STAIt and STAIs tests. Post-hoc analysis showed sig-nificantly higher levels of anxiety among the HCW of subunits E and F compared to the others (Table 7).
highly inter-related (Table 8).
Objective parameters
Table 9 shows the mean scores of the objective parameters assessed in the subunits of the medical wards. Parameter #1 is higher in unit E than in others. Table 3. Significant differences of JCQ scores
among the subunits of the medical wards
Fisher’s PLSD Mean difference p value
Jod Demand Subunit A vs E Subunit D vs E –5.151 –6.054 0.0253 0.0100 Decision Latitude Subunit B vs C 4.910 0.0426 Social Support Subunit B vs E Subunit B vs F Subunit D vs E Subunit D vs F 2.125 1.587 2.453 1.915 0.0042 0.0487 0.0011 0.0189
Table 4. Mean scores, median and ranges of MBI subscales in the 6 subunits of the medical wards
Sub Unit Emotional Exhaustion De-Personalization Personal Accomplishment Mean Range Median Mean Range Median Mean Range Median
A 16.7 1–49 14 5.0 0–21 3 39.1 13–48 41 B 16.2 1–41 13 4.2 0–17 2.5 37.3 15–48 39 C 21.1 0–52 17 6.9 0–28 5.0 36.8 7–46 39 D 15.0 0–35 12 4.1 0–17 2.5 39.9 22–48 41 E 29.1 1–54 27 7.3 0–29 6.0 37.2 10–47 41 F 26.4 4–48 28 6.7 0–19 6.0 36.0 27–48 36
Table 6. Mean scores, median and ranges of trait and STAI-state subscales in the 6 subunits of the medical wards
Sub Unit
STAIt STAIs
Mean Range Median Mean Range Median
A 48.0 2–99 50 40.1 4–88 41 B 38.4 1–97 30 38.1 1–89 34.5 C 45.3 12–99 42 39.9 4–89 38.0 D 36.4 1–96 32 33.3 1–89 34.0 E 57.4 3–99 61 51.2 1–99 50.5 F 61.3 5–97 64 48.3 3–90 44.0
Table 5. Significant differences of MBI scores among the subunits of the medical wards
Fisher’s PLSD Mean difference p value Emotional Exhaustion Subunit A vs E Subunit A vs F Subunit B vs E Subunit B vs F Subunit C vs D Subunit C vs E Subunit D vs E Subunit D vs F –12.462 –9.556 –12.776 –9.871 5.856 –8.250 –14.105 –11.200 <0.0001 0.0012 <0.0001 0.0009 0.0381 0.0034 <0.0001 0.0002 Depersonalization Subunit B vs E Subunit D vs E –3.083 –3.123 0.0237 0.0236 Personal accomplishment Subunit D vs F 3.913 0.0378
Table 7. Significant differences of STAI-trait and STAI-state scores among the 6 subunits of the medical wards
Fisher’s PLSD Mean difference p value STAIs Subunit A/E Subunit A/F Subunit B/E Subunit C/E Subunit D/E Subunit D/F –5.166 –3.937 –4.488 –4.374 –6.211 –4.982 0.0048 0.0451 0.0146 0.0204 0.0009 0.0128 STAIt Subunit A/E Subunit A/F Subunit B/E Subunit B/F Subunit C/E Subunit C/F Subunit D/E Subunit D/F –8.225 –10.938 –7.482 –10.195 –6.657 –9.370 –7.822 –10.535 0.0001 <0.0001 0.0005 <0.0001 0.0026 0.0001 0.0004 <0.0001
Industrial Health 2011, 49, 15–23 and E. Parameter #4 (n. of skipped days off) resulted
lower in unit E compared to all the other units, and parameter #5 (days on sick leave) was significantly higher in unit E and F compared to the other units. The last two parameters, #6 (number of deceased) and #7 (number of accidents), were not further considered in the analyses because the values were too low and not significant.
The analysis of the objective parameters according to job rank are reported in Table 11. The ratio Patients/ HCW, quantitative expression of workload, was higher in ancillary vs. nurses and doctors. The ratio HCW on sick leave/on service resulted higher in doctors; the number of skipped days off is higher in nurses. The
lowest average number of sick leave days was observed among doctors.
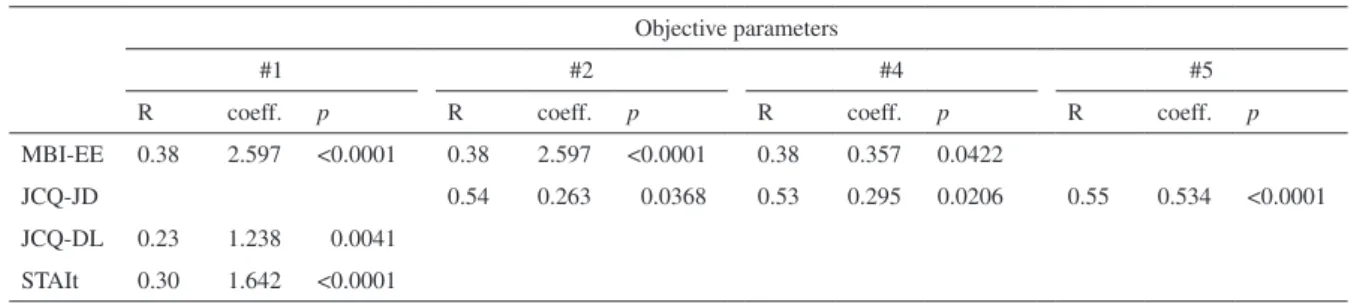
Relationship between subjective questionnaires and the objective parameters
Table 12 shows the correlations between subjective and objective parameters. A significant correlation resulted between EE and parameter #1 “working under-staffed”, #2 “patient/HCW” and #4 “n. of skipped days off”. STAIt and DL correlated to #1 “working under-staffed”; JD correlated to #2 “patients/HCW”, #4 “n. of skipped days off” and #5 “days on sick leave”.
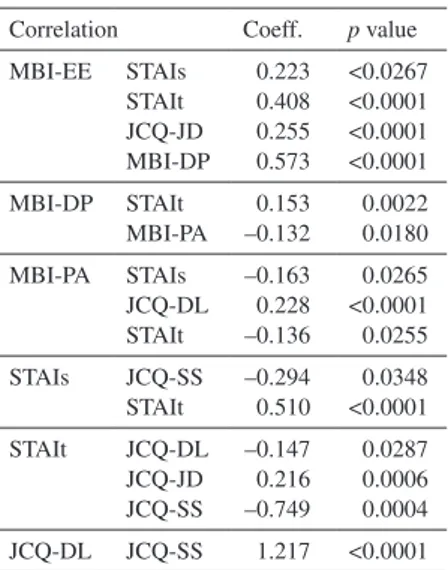
Table 8. Correlation analysis between the questionnaires scores
Correlation Coeff. p value MBI-EE STAIs STAIt JCQ-JD MBI-DP 0.223 0.408 0.255 0.573 <0.0267 <0.0001 <0.0001 <0.0001 MBI-DP STAIt MBI-PA 0.153 –0.132 0.0022 0.0180 MBI-PA STAIs JCQ-DL STAIt –0.163 0.228 –0.136 0.0265 <0.0001 0.0255 STAIs JCQ-SS STAIt –0.294 0.510 0.0348 <0.0001 STAIt JCQ-DL JCQ-JD JCQ-SS –0.147 0.216 –0.749 0.0287 0.0006 0.0004 JCQ-DL JCQ-SS 1.217 <0.0001
Table 9. Mean scores of the objective parameters in each of the 6 subunits of the medical wards
Sub Unit Objective parameters #1 #2 #3 #4 #5 #6 #7 A 1 20.176 1.352 1.025 4.512 0.166 0.044 B 1 19.998 1.428 1.513 5.192 0.176 0 C 1 21.013 3.611 1.879 4.853 0.063 0 D 1.016 20.497 3.047 1.466 1.606 0.204 0 E 1.059 21.750 2.891 0.482 7.919 0.115 0.096 F 1 22.344 0 2.135 7.519 0.293 0
Table 10. Comparison of objective parameters in the 6 subunits of the medi-cal wards Fisher’s PLSD Mean difference p value #3 Subunit A vs F Subunit B vs C Subunit B vs D Subunit C vs F Subunit D vs F Subunit E vs F 5.547 –4.721 –4.510 8.022 7.810 6.502 0.0099 0.0210 0.0254 0.0003 0.0004 0.0027 #4 Subunit A vs E Subunit B vs E Subunit C vs E Subunit D vs E Subunit E vs F 4.816 4.876 5.636 5.259 –7.699 0.0084 0.0084 0.0029 0.0048 0.0001 #5 Subunit A vs D Subunit B vs D Subunit B vs E Subunit C vs D Subunit C vs E Subunit C vs F Subunit D vs E Subunit D vs F 6.988 5.659 –4.378 4.532 –5.505 –5.260 –10.037 –9.792 0.0012 0.0093 0.0410 0.0407 0.0120 0.0269 <0.0001 <0.0001
Table 11. Mean scores of the five objective parameters according to the different job categories
Job rank Objective parameters
#1 #2 #3 #4 #5 #6 #7
Ancillary 1.032 25.031 1.667 0.945 7.170 0.194 0.048 Nurses 1.009 17.661 3.307 2.267 5.768 0.135 0.021 Doctors 0.992 21.714 0.109 0 0.721 0.187 0
Discussion
In our study subjective evaluations of strain, obtained with MBI and STAI strongly agreed in identifying the sub-units E and F oh the medical wards as the most critical. The subjective evaluation of stressors obtained with JCQ indicated also the same sub-units as charac-terized by higher JD and lower SS. This implies that the two approaches investigate similar aspects, as sup-posed by Kasl13–15): in fact, a good correlations resulted in our study between subjective evaluations of stressors and strain.
The objective evaluation of stressors indicated also more critical conditions in the same two subunits E and F regarding to the number of days on sick leave. This can be interpreted as the only objective index of effect, while the other objective parameters can be considered as objective indicators of exposure to stress. Therefore, the number of days on sick leave results as the objec-tive index that better reflects the subjecobjec-tive evaluation of stress and strain in the different subunits.
Nevertheless, objective and subjective indicators were related in various correlations. EE was positively associated with the “n. of skipped days off”, the ratio “patients/HCW” (which is an objective index of JD) and “working understaffed”. The subjective perception of JD was positively correlated to the objective index (“patients/HCW”) and to the loss of recovery time (“n. of skipped days off”). The parameter “working under-staffed” reflected the adequacy of the staff: an inad-equate staff was correlated to higher levels of EE and anxiety measured with STAI. There was also a positive correlation to DL, possibly because if the workers are fewer, they must make more decisions.
Several studies on occupational stress adopted both subjective and objective methods to evaluate job stress-ors and strain19, 21–27). All the studies found some correlation between subjective and objective measures. Each study adopted different methods, both for subjec-tive and objecsubjec-tive evaluations; the indicators chosen
has been one of the mostly evaluated objective param-eter22–24), but the high specificity of the other objective indices and the wide number of subjective question-naires make the comparison among the studies very dif-ficult. For this reason, we focused on studies conducted on HCW to compare our results.
Objective and subjective indicators of psychosocial hazards among HCW were measured by Fox et al.21) with objective indexes and perceptual measures of demands. Objective evaluation included patient load, the percentage of hours spent for direct patients care out of the total work schedule, and the average num-ber of deaths witnessed by the nurses in the last year. Subjective evaluation of JD was performed by a seven-item scale31) and by a 45-items inventory of stressful events32); the subjective perception of the control the workers experienced in that work was measured with a 22-items scale33). Among the affective outcomes, the overall job satisfaction was assessed with a version of the “faces” scale34); illness and somatic complains using a 17-items scale measuring several symptoms. Physiological indicators were also measured including arterial blood pressure and salivary cortisol sampled at work and at home. The last instrument was a measure of the overall job performance. The instrument con-tained six major responsibility areas with rating assigned by an assessor (usually the head nurse). The authors (Fox et al.21)) observed a convergence of subjective and objective assessment of JDs: the scale of quantitative work load correlated significantly with two objective indicators, patient load and direct patients care. The same two indicators correlated also with physiological outcomes. Subjective workload did not correlate with any of the outcome variables. Somatic complains out-comes was positively correlated with the frequency of stressful events, negatively with beliefs in high control levels. Overall job performance resulted significantly related (with a negative correlation) with the percentage of time in contact with patients and with other strain variables (blood pressure at work).
Table 12. Significant results of correlation analysis between objective parameters and the questionnaires’ subscales
Objective parameters
#1 #2 #4 #5
R coeff. p R coeff. p R coeff. p R coeff. p
MBI-EE 0.38 2.597 <0.0001 0.38 2.597 <0.0001 0.38 0.357 0.0422
JCQ-JD 0.54 0.263 0.0368 0.53 0.295 0.0206 0.55 0.534 <0.0001
JCQ-DL 0.23 1.238 0.0041 STAIt 0.30 1.642 <0.0001
Industrial Health 2011, 49, 15–23 determine if nurses exposed to job strain (measured by
JCQ) reported a higher incidence of sick leave than non-exposed nurses. Objective parameters of stress were represented by data on sick leave, both short-term (1–5 d) and longer sick leave (>3 or 5 d). Results indi-cated that short-term sick leaves were associated with job strain and with lower SS at work; longer sick leaves were associated with lower SS.
Rahuala et al.23) measured objective parameters in nurses; the aims of this study were to examine whether work overload was related to sickness absenteeism and to quantify potential loss of working days. Workload was measured by the RAFAELA patient classification system35), sickness absence was measured as short (1–3 d) and long-term (>3 d). Results showed a positive asso-ciation between score of workload and both measures of short and long-term sick leave.
Conclusions
In summary, the use of subjective an objective param-eters of work stress showed two positive associations: a) between subjective and objective indicators of job stressors and strain, and b) between subjective measures of strain and the objective indicators of stress. These results further support the use of integrated methods in occupational stress studies, that allow to take full advan-tage of all the scales and evaluation instruments. A limitation of the studies already published on this topic is that they generally do not adopt widely validated instruments, especially for the subjective measurements. Therefore a strength of our study is the use of validated instruments for subjective measurement. Nevertheless, although subjective instruments are useful to identify the most critical organizational areas and the effects related to occupational stress, they do not identify the sources of work stress. Therefore they cannot be used to program preventive intervention and they must inte-grate with objective measurement. Our model is suit-able for this purpose, although it may be further imple-mented with other objective indicators of effect, such as increased turnover, errors and mistakes in various job tasks. The index that measures days on sick leave could also be divided in short and long term absences.
Risk assessment and risk characterization are essential steps for the implementation of preventive and protective policies. Job-related stress is an emerging risk factor in occupational setting, therefore it should be assessed with an adequate approach. The use of objective measures can contribute to a clearer linkage between subjective perception and the environmental conditions and can indicate what aspects should be modified by preventive intervention. On the other hand, subjective measures
are needed because the impact of exposure varies sub-stantially among individuals; moreover, they examine cognitive and emotional processing. Therefore, the best approach to measure occupational stress is an integrated one, which involves the use of multiple subjective and objective assessment modalities.
References
1) Hurrel JJ Jr, Nelson DL, Simmons BL (1998) Measuring job stressors and strain: where we have been, where we are and where we need to go. J Occup Health Psychol 3, 368–89.
2) Hackman JR, Lawler EE (1971) Employee reactions to job characteristics. J Appl Psychol 55, 259–86. 3) Hackman JR, Oldham GR (1975) Development of job
diagnostic survey. J Appl Psychol 60, 159–70.
4) Sims HP, Szilagyi AD, Keller RT (1976) The mea-surement of job characteristics. Acad Manage J 19, 195–212.
5) C o o p e r C L , S l o a n S J , Wi l l i a m s J S ( 1 9 8 8 ) Occupational Stress Indicator; NFER-Nelson. Windsor, Ontario.
6) Moos RH (1981) Work Environment Scale Manual. Consulting Psychologist Press, Palo Alto.
7) Osipow SH, Spokane AR (1980) The Occupational Environmental Scales, Personal Strain Questionnaire and Personal Resurces Questionnaire, form E-1. Marathon Consulting & Press, Columbus.
8) Ivancevich JM, Matteson MT (1984) Stress diag-nostic survey (SDS): comments and psychometric properties of a multidimensional self report inven-tory. Unpublished manuscript, University of Houston, Houston.
9) Karasek RA, Job Content Questionnaire and users guide (1985) Department of Industrial and System Engineering, University of Southern California, Los Angeles.
10) Hurrell JJ Jr, McLaney MA (1988) Exposure to job stress: a new psychometric instrument. Scand J Work Environ Health 14 (Suppl 1), 27–8.
11) Spielberger CD, Professional Manual for the job stress survey (JSS) (1994) Psychological Assessment Resources, Odessa.
12) Frese M, Zapf D (1988) Methodological issues in the study of work stress: objective vs. subjective measure-ment of work stress and the question of longitudinal studies. In: Causes, coping and consequences of stress at work, Cooper C and Payne R (Eds.), 375–411, Wiley, Chichester.
13) Kasl SV (1978) Epidemiological contribution to the study of work stress. In: Stress at work, Cooper CL and Paine Rl (Eds.), 3–38, Wiley, Chichester.
14) Kasl SV (1987) Methodologies in stress and health: past difficulties, present dilemmas, future directions. In: Stress and health: issues in research methodol-ogy, Kasl SV and Cooper CL (Eds.), 307–18, Wiley,
Chichester.
15) Kasl SV (1998) Measuring job stressors and study-ing the health impact of the work environment. An epidemiologic commentary. J Occup Health Psychol 3, 390–401.
16) Elo AL, Vehvilaienen MR (1983) Method for occu-pational health personnel to assess psychic stress fac-tors at work: a study of reliability and validity of the method. Institute of Occupatonal Health, Helsinki. 17) Greiner BA, Leitner K (1989) Assessment of job
stress: RHIA instrument. In: Landau K, Rohmert W (Eds.), 53–66, Recent developments in work analysis. Taylor and Frances, Philadelphia.
18) Greiner BA (1994) Work analysis instrument to iden-tify objective stress factors in service work: observer manual and response sheets. University of California at Berkeley, School of Public Health, Berkeley. 19) Greiner BA, Ragland DR, Krause N, Syme SL (1997)
Objective measurement of occupational stress factors- an example with San Francisco urban transit operators. J Occup Health Psychol 4, 325–42.
20) Greiner BA, Krause N, Ragland DR (1998) Objective stress factors, accidents and absenteeism in transit operators: a theoretical framework and empirical evi-dence. J Occup Health Psychol 2, 130–46.
21) Fox ML, Dwyer DJ, Ganster DC (1993) Effects of stressful job demands and control on physiological and attitudinal outcomes in a hospital setting. Accad Manage J 36, 289–318.
22) Bourbonnais R, Mondor M (2001) Job strain and sick-ness absence among nurses in the province of Quebec. Am J Ind Med 39, 194–202.
23) Rahuala A, Kivimäki M, Fagerström L, Elovainio M, Virtanen M, Vahtera J, Rainio AK, Ojaniemi K, Kinnunen J (2007) What degree of work overload is likely to cause increased sickness absenteeism among nurses? Evidence from the RAFAELA patient classifi-cation system. J Adv Nurs 57, 286–95.
24) Stanfeld SA, Rael EGS, Head J, Shipley M, Marmot M (1997) Social support and psychiatric sickness absence: a prospective study of British civil servants.
Psychol Med 27, 35–48.
25) Parks (1999) Shiftwork, job type, and the work envi-ronment as joint predictors of health-related outcomes. J Occup Health Psychol 4, 256–68.
26) Greiner BA, Krause N, Ragland D, Fisher JM (2004) Occupational stressors and hypertension: a multi-method study using observer-based job analysis and self-reports in urban transit operators. Soc Sci Med
59, 1081–94.
27) Gimeno D, Benavides FG, Mira M, Martinz JM, Benach J (2004) External validation of psychological job demands in a bus driver sample. J Occup Health
46, 43–8.
28) Baldasseroni A, Camerino D, Cenni P, Cesana G, Fattorino E, Ferrario M, Mariani M, Tartaglia R (2001) La valutazione dei fattori psicosociali. Il Job Content Questionnaire. Fogli di Informazione ISPESL 3, 20–32 (in Italian).
29) Maslach C, Jackson SE (1986) Maslach Burnout Inventory. Consulting Psychological Press Ed, Palo Alto.
30) Spielberger CD, Gorsuch RL, Lushene RE (1970) Manual for the State-Trait Anxiety Inventory Self-Evaluation Questionaire. Consulting Psychological Press Ed, Palo Alto.
31) Caplan RD, Cobb S, French JRP, Harrison R, Pinneau SR (1975) Job demands and worker health main effects and occupational differences. US Government Printing Office, Washington, DC.
32) Motowidlo SJ, Packard JS, Manning MR (1986) Occupational stress: its causes and consecuences for job performance. J Appl Psychol 71, 618–29.
33) Dwyer DJ, Ganster DC (1991) The effects of job demand and control on employee attendance and satis-faction. J Org Behav 12, 595–608.
34) Kunin T (1955) The construction of a new type of attitude measure. Personnel Psychology 68, 334–7. 35) Fagerström L, Rahuala A (2003) Finn patient
classifi-cation – benchmarking in nursing care. Final report of the project 2000–2002. Suomen Kuntaliitto, Helsinki.