EVALUATION OF PHOTOPOLYMERIZATION KINETICS BY MEANS
OF TRANSMITANCE MEASUREMENTS
G. Bovesecchi1
1University of Rome “Tor Vergata”, Dept. of Industrial Engineering ( www.ing.uniroma2.it ) Corresponding author: [email protected], +39-06-72597127
ABSTRACT
Polymeric resins are widely used for dental reconstruction, and most of them use the camphorquinone as activator of the polymerization reaction, through the absorption of light at a defined wavelength range (400÷460 nm).
During the photopolymerization curing, transparency of these resins change, and transmittance variation was detected by photodiode and bolometer measurements. This change can be used as an index of the reaction rate, so the kinetic parameter
k (reaction rate) was evaluated from transmittance data by means of nonlinear regression. The relation between k and the light intensity impinging the resin sample is thus obtained, revealing the presence of two different polymerization reactions at two different intensity ranges. Results can be used to predict the most suited curing times for different light intensities, even for different materials, as ceramics.
1 - INTRODUCTION
Photopolymerization of resins used in dentistry practice is up today the most widely applied technique in reconstruction therapy of teeth, due to its ease and simplicity of use and good results (both esthetical and mechanical) of the obtained prosthesis. The application of specific resins (at least 5 types are normally used) is made by depositing a resin layer of about 1 mm in the prepared cavity of the tooth, and then curing it with a photopolymerizing lamp (generally a LED lamp with a maximum luminous exitance at a 460 nm wavelength. Different layer can be overlapped in order to obtain the desired reconstruction. So it results fundamental to know the kinetic parameters of the polymerization reaction, i.e. the relation between the reaction velocity and the other quantities involved in the process. The knowledge of the parameters involved in such relation can lead to describe the reaction and to decide the best coupling among parameters to get the optimum results. A further development will be to identify eventual change of material properties as a function of parameter values.
Studying the photopolymerization reaction kinetics means to find out a property, which varies during the reaction itself. During previous studies [1] it was found out
that transparency of the resin varies during the curing phenomenon. The present work deals with using this quantity (transmittance, as a measure of transparency) as characteristic property related to curing reaction, and thus able to describe the reaction evolution. This evolution is clearly dependent on the intensity of the light emitted by the polymerizing lamp, which therefore is the first independent variable, which the kinetics is dependent on. Also the temperature effect was investigated as independent parameter, similarly to what happens in thermally induced polymerization reaction. Preliminary tests (DSC measurements of bare materials till to 250°C) showed no or very little effect of temperature on curing. Therefore it has been stated that photopolymerization kinetics is dependent only on time and light intensity. The present work is thus based on finding the relation among these three quantities by a proper experimental plan through the measurement of the transmitted light during the reaction.
Most of previous works have investigated photopolymerization kinetics by analyzing the shrinkage of the material during the reaction [2], [3], [4], [5], [6], [7], [8], [9],[10], [11]. Others studied the kinetics by optical or thermal methods, as NIR (near infrared) [12], internal reflectance spectroscopy [13], differential scanning calorimetry [14], differential thermo mechanical analysis [15], NMR and MRI [16], FTIR spectroscopy [17], light, mechanical properties and temperature [18].
The proposed method allows to determine kinetic parameters with an easy and quick procedure, based on detecting a completely different quantity, i.e. transmittance of the polymer while the reaction occurs.
2 - ANALYTICAL DERIVATION OF CHARACTERISTIC KYNETICS EQUATION
Defining da / dt the rate of conversion of a chemical reaction, and a the extent of reaction, varying between 0 (reaction completely not occurred) and 1 (completed reaction), the reaction kinetics equation is written as
da
dt = k 1- a
(
)
x
(1) with k the reaction rate coefficient, and
x
the reaction order, generally connectedwith the number of the chemical species involved. In the photopolymerization reaction only one species is present, so it is natural to assume x = 1. Besides, the experimental data are not so accurate to justify a value of the reaction order different from one. Eq. (1) with x = 1 can be easily solved leading to:
a = 1- e-k×t (2)
The tests carried out (see par. 3) showed a meaningful variation of the transmittance t during the polymerization, from an initial value t0 to the final t¥,
(after an enough long time when the material is supposed to be completely polymerized). Thus the relation between a and t results:
a =t
( )
t -t0t¥-t0 (3)
And hence:
t(t) =t0+
(
t¥-t0)
(
1- e-k×t)
(4) Being t the ratio between the transmitted light T (in W/m2) and the incident one G
the same eq. (4) can be written as:
T(t) = T0+ T
(
¥-T0)
(
1- e-k×t)
101\* MERGEFORMAT (.)
This is the equation used for processing the experimental data in par. 4.
3 - EXPERIMENTAL
As light source an Ultradent lamp (VALO) with 4 LEDs all in the wavelength range 400÷460 nm have been used in the experimental apparatus, whose sketch is reported in Fig. 1. Pc DAS Ps L Ph Ps
Fig. 1 - Sketch of the experimental setup: L, LED lamp; P, silicon photodiode; Ps: power supply;
Light intensity during transparency measurements is measured by a silicon photodiode EG&G mod. HUV 1100BG, whose signal is amplified by an operational amplifier and gives an output till to 10V. The LED lamp can supply three fixed intensity values, nominally 1000, 1500 and 3200 mW/cm2. In order to get a
continuously varying intensity signal, different grey filters were interposed between the lamp and the polymerizing resin. Also the time length of the lamp switching on is fixed, but experiments were carried on by overlapping different pulses, and considering the overlap as a continuous light source.
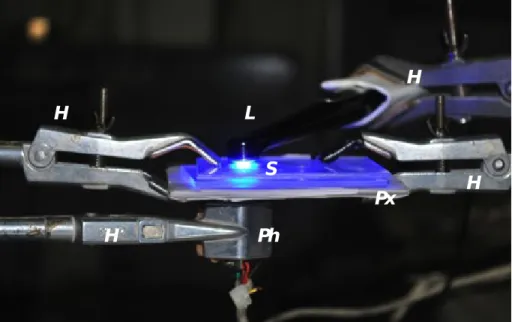
The sample under cure was an Enamel HFO plus GE2. Cylindrical samples of 1 mm in thickness and 7 mm in diameter where obtained and inserted between two plexiglass slabs 2 mm thick (see Fig. 2).
L H S Ph Px H H H
Fig. 2 - Photo of the tests: L, lamp; Ph, photodiode; S, sample, Px, plexiglass slabs; H, holders
In order to calibrate the intensity values measured by the photodiode, an absolute intensity measure was carried out by a bolometer, Coherent LM10. From these values an effective light intensity of 4874, 8893 and 15013 W/m2 resulted to be
compared with the nominal values of 10000, 15000 and 32000 W/m2. The
wavelength response of the 4 sources LED lamp was measured with a spectrophotometer, and reported in Fig. 3.
Fig. 3 - Spectral distribution of the light emitted by 4 sources of the LED lamp
4 - DATA PROCESSING
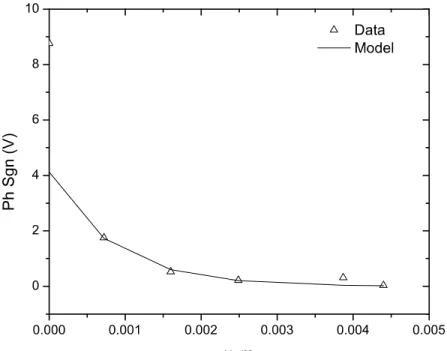
A typical transmitted radiation trend is reported in Fig. 4. Data are processed by a nonlinear least square algorithm [19]. The model for such regression is the equation:
S = b1+ b2×e -b3×t
(5) with S the signal of the photodiode (in V). The algorithm supplies the best estimate
of the three parameters b1, b2 and b3, and of their prevision uncertainty sb1, sb2 and sb3. Among these, only b3 is considered important inasmuch corresponding to k of eq. (1).
Fig. 4 - typical trend of the photodiode signal vs. time during polymerization
5 - RESULTS
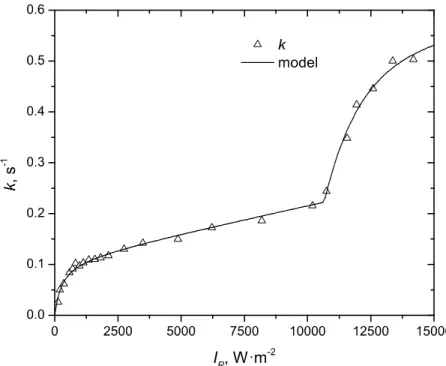
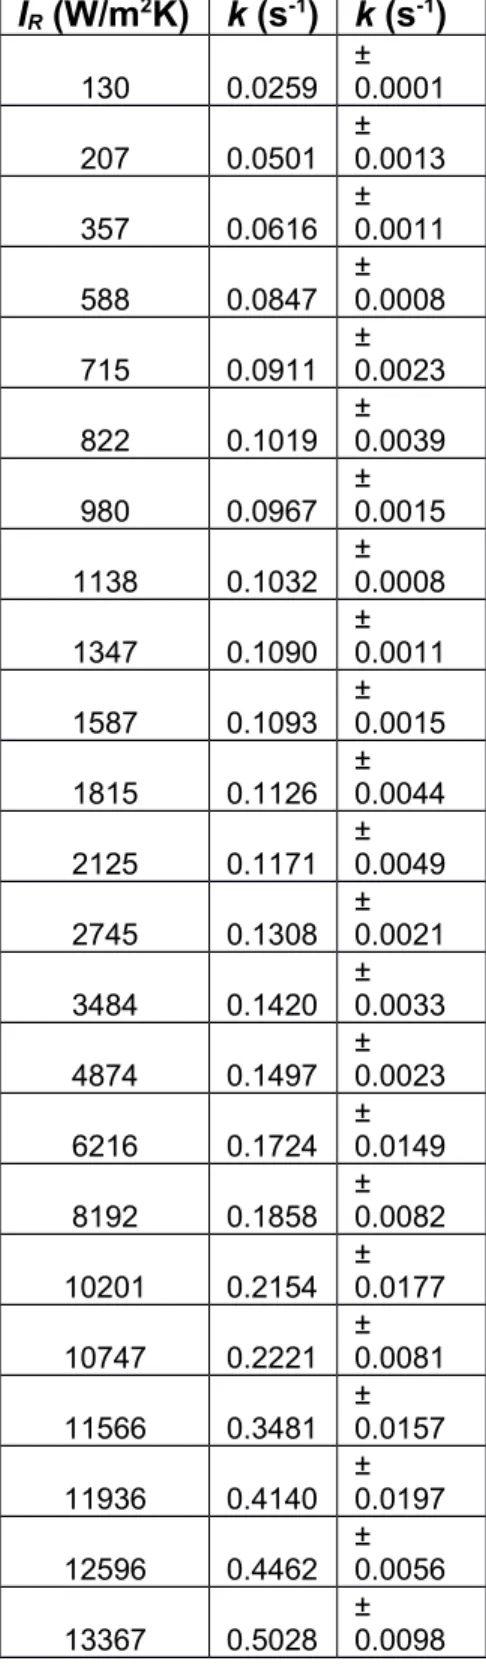
Table 1 reports the results of the b3 parameter from the nonlinear regression as a
function of the intensity of the light emitted by the lamp. The same Data are plotted in Fig. 5. The data present a typical trend: for null light intensity no polymerization is obtained. When intensity increases also the rate coefficient increases, asymptotically to a straight line with a slope of 9.7·10-6 m2W-1s-1, till to 10500 Wm-2.
At higher powers the trend changes abruptly. The data distribution presents a new trend, similar to the first one and overlapped to it. This second trend is likely due to a second different polymerization, occurring with different reaction parameters. In Fig. 5 also a regression line is reported. This line is obtained by a phenomenological model, with the only aim to interpolate experimental data. A physical model describing the reaction parameter k requires a detailed study of the phenomenon by the chemical point of view. The phenomenological model used takes into account that the trend of data must cross the origin of the graph ( k = 0
for IR = 0) and are asymptotical to a straight line, and corresponds to the following equation: k = b1 b2 + b3×IR -b1 IR + b2
(
)
(6)Fig. 5 - Distribution of the rate coefficients vs. lamp irradiance
6 -UNCERTAINTY ANALYSIS
The obtained results (Table 1) are affected by both type A and B uncertainty [20]. Type A uncertainty is reported in table, and corresponds to the prevision uncertainty of parameter obtained from the nonlinear regression procedure, i.e. the diagonal elements of the covariance matrix of the unknowns [19]. Another source of type A uncertainty arises observing Fig. 5: the trend line defines a relative uncertainty of k ranging from 2 to 5%, again obtained with a statistical (regression) method.
Type B uncertainty can be evaluated from the uncertainty of the quantities used to get the final data: these are:
- bolometer accuracy: value declared by the supplier is ±2%. The measured values ranged from 420 mW to 1.3 W, e the resulting uncertainty from 8 to 26 mW, i.e. from 92 to 300 W/m2. From Fig. 5 these uncertainty correspond
to uncertainties in k from 0.005 to 0.015 s-1.
from the point of view of reproducibility silicon photodiode present performances much higher that the bolometer. So photodiode accuracy can be considered negligible because its values are divided for other read by the same device, and eventual drifts or other systematic errors are compensated.
- distance between the lamp and the sample: nominally this has been set to 4 mm. Measuring the lamp intensity variation with distance with the bolometer the uncertainty associated to this variation resulted similar to the bolometer uncertainty.
Thus the type B uncertainty in k results thus just almost the same as type A uncertainty. The total uncertainty results thus between 0.007 and 0.021 s-1.
IR (W/m2K) k (s-1) k (s-1) 130 0.0259 ± 0.0001 207 0.0501 ±0.0013 357 0.0616 ±0.0011 588 0.0847 ±0.0008 715 0.0911 ± 0.0023 822 0.1019 ±0.0039 980 0.0967 ±0.0015 1138 0.1032 ±0.0008 1347 0.1090 ± 0.0011 1587 0.1093 ±0.0015 1815 0.1126 ±0.0044 2125 0.1171 ±0.0049 2745 0.1308 ± 0.0021 3484 0.1420 ±0.0033 4874 0.1497 ±0.0023 6216 0.1724 ±0.0149 8192 0.1858 ± 0.0082 10201 0.2154 ±0.0177 10747 0.2221 ±0.0081 11566 0.3481 ±0.0157 11936 0.4140 ± 0.0197 12596 0.4462 ±0.0056 13367 0.5028 ±0.0098
In the present work the effect of reflectance of the polymer surface was neglected. Previous tests carried out showed that an effect of reflectance is present. This effect was recognized by the data of light extinction of different sample thickness. These data are reported in Fig. 6.
Fig. 6: Transmittance data of the polymer as a function of sample thickness.
The reflectance effect can be observed by fitting data with the usual Bouguer Beer law, e.g. [21]:
GR = GR,0×e-a×x
(7) being GR the irradiation on the detector (SiPh) and GR,0 the irradiation when no sample is interposed between the lamp and the detector, and
a
the extinction coefficient (m-1).When the least square regression is performed using eq. (6) as model, a difference is observed between the value of GR,0 when all data are taken into account, and when the first data (with the lamp directly illuminating the sensor) is cancelled. This can be attributed to the effect of reflectance, present in all data bedside the first. This procedure leads to a reflectance value of about 53%±1%. Even this effect is relevant, its consequence influences only the abscissa of Fig. 5, but the practical use of eq. (1) and (6) is the same, inasmuch the intensity of the light emitted by the lamp is generally taken into account, rather then the effective light arriving on the sample. Clearly this reflectance value must be considered when the correct kinetics as a function of effective illumination of material is required.
6 – CONCLUSIONS
The proposed method to evaluate the parameters of the kinetics of the photopolymerizing reaction of resin for dental reconstruction has proved to be effective in predicting the time/light intensity relation to get the optimum performances of the result.
Fig. 7 - Evaluated polymerizing time of the resin to reach 99% of the reaction completion as a
function of lamp irradiance
Two different kinetics are present, the first for medium light irradiance of the sample (till to 10000 W/m2) and the second for high irradiance (>10000 W/m2). As
an application, Fig. 7 shows the estimated time to get an extent of reaction of 0.99 (99% of the resin cured) as a function of the irradiation provided by the lamp. The uncertainty analysis provides a way to establish the confidence level of the results. For example in the same figure also the two dashed lines, representing the uncertainty bars with 95% of confidence level (2 times the standard uncertainty), are reported. From this figure it is possible to assess that the suggested time by the lamp manufacturer are correct for the low intensity irradiation (20 s per 5000 W/m2) while is a little too short for the high irradiation (3 s for 15000 W/m2). Even
the reported data refer to a specific resin, the procedure can be extended to any kind of resin enough transparent to be detected by usual electro optical devices (photodiodes, bolometers, photomultipliers, etc.), and also to other kind of reconstruction materials, as ceramic, or composites.
The author would like to thank prof. Coppa for the support given in the definition of the experimental procedure and interpretation of results and dr. Armellin for providing the necessary medical knowledge.
REFERENCES
[1] P. Coppa, G. Bovesecchi, E. Armellin “Simulation of Temperature Trend of Tooth Models and Comparison with Experiments”, Proc. of XVIII Convegno Nazionale A.I.P.T., Milano, 28 settembre 2012, pp.65-80 (2013), ISBN 978-88-6507-501-2
[2] D.C. Watts,A.S. Marouf, A.M. Al-Hindia, “Photo-polymerization shrinkage-stress kinetics in resin-composites: methods development”, Dental Materials 19 (2003) 1–11
[3] S. Deb, H. Sehmi, “A comparative study of the properties of dental resin composites polymerized with plasma and halogen light” Dental Materials 19 (2003) 517–522
[4] H.Y. Chen, J. Manhart, K.-H. Kunzelmann, R. Hickel, “Polymerization contraction stress in light-cured compomer restorative materials”, Dental Materials 19 (2003) 597–602
[5] S.H. Kim, D.C. Watts, “Polymerization shrinkage-strain kinetics of temporary crown and bridge materials”, Dental Materials (2004) 20, 88–95
[6] M. E. Cohen, D. L. Leonard, D. G. Charlton, H. W. Roberts, J. C. Ragain, “Statistical estimation of resin composite polymerization sufficiency using microhardness”, Dental Materials (2004) 20, 158–166
[7] A. D. Loguercio, A. Reis, R. Y. Ballester, “Polymerization shrinkage: effects of constraint and filling technique in composite restorations”, Dental Materials (2004) 20, 236–243
[8] D. C. Watts, “Reaction kinetics and mechanics in photo-polymerised networks”, Dental Materials (2005) 21, 27–35
[9] J. D. Eick, R. E. Smith, C. S. Pinzino, S. P. Kotha, E. L. Kostoryz, C. C. Chappelow, “Photopolymerization of developmental monomers for dental cationically initiated matrix resins”, Dental Materials (2005) 21, 384–390
[10] H. Lu, J. A. Carioscia, J. W. Stansbury, C. N. Bowman, “Investigations of step-growth thiolene polymerizations for novel dental restoratives”, Dental Materials (2005) 21, 1129–1136
[11] B. Kahler, A. Kotousov, K. Borkowski, “Effect of material properties on stresses at the restoration–dentin interface of composite restorations during polymerization”, dental materials 22 (2006) 942–947
[12] M. Trujillo, S. M. Newman, J. W. Stansbury, “Use of near-IR to monitor the influence of external heating on dental composite photopolymerization”, Dental Materials (2004) 20, 766–777
[13] U. Lohbauer, C. Rahiotis, N. Kramer, A. Petschelt, G. Eliades, “The effect of different light-curing units on fatigue behavior and degree of conversion of a resin composite”, Dental Materials (2005) 21, 608–615
[14] M. Simeone, A. Lanza, S. Rengo, R. Aversa, D. Apicella, A. Apicella, “Inlay shading effect on the photopolymerization kinetic of a dental composite
material used as bonding system in an indirect restoration technique”, Dental Materials (2005) 21, 689–694
[15] N. Emamia, K. M. Soderholm, “Dynamic mechanical thermal analysis of two light-cured dental composites”, Dental Materials (2005) 21, 977–983
[16] T.G. Nunes, F.C.P. Garcia, R. Osorio, R. Carvalho, M. Toledano, “Polymerization efficacy of simplified adhesive systems studied by NMR and MRI techniques”, dental materials 22 (2006) 963–972
[17] M. Atai, D. C. Watts “A new kinetic model for the photopolymerization shrinkage-strain of dental composites and resin-monomers”, dental materials
22 (2006) 785–791
[18] J. Leprince, J. Devaux, T. Mullier, J. Vreven, G. Leloup, “Pulpal-temperature Rise and Polymerization Efficiency of LED Curing Lights”, Operative Dentistry, 2010, 35-2, 220-230
[19] S. Brandt, Statistical and Computational methods in Data Analysis, North Holland Pub, Amsterdam, 1970
[20] ISO/IEC Guide 98-3:2008