Reprinted from Crop Science Vol. 36, No.2
Effect of Temperature and Phosphorus Fertilization on Phosphorus and Nitrogen
Uptake
by
Sorghum
Laura Ercoli,
*
Marco Mariotti, Alessandro Masoni, and Franco MassantiniABSTRACT
Temperature (T) and phosphorus (P) supply affect each of the mechanisms involved in P and nitrogen (N) uptake by grain sorghum
[Sorghum bicolor (L.) Moench]. This study was conducted to assess
the extent to which air temperature and P fertilizer influenced P and N uptake and partitioning in sorghum plant parts. Research was conducted in a climatic chamber, where plants (Venturoli Aralba
hybrid sorghum) were grown in pots under a 14-h day/night photope-riod regime. Temperature regimes were kept constant for the entire
life cycle at 21, 24, 27, and 30°C. The P fertilization rate was 0 and
150 mg P pot -• as triple mineral per phosphate. Temperature and P
supply controlled P and N concentration and content in all sorghum
plant parts during the biological cycle. Whole plant, leaf, stem, and
root P and N contents were highest at 27°C in growth Stages 3, 6, and 9 for both P-fertilized and unfertilized plants. Increased P supply resulted in greater P and N content in leaves and stems in all three
stages and at all temperatures, while root P and N contents were
unaffected. Panicle P and N contents were highest at 21 to 27°C in
Stage 6 and at 24°C in Stage 9. The effect ofT on increasing plant P and N contents was attributable primarily to higher P and N uptake rate per unit of root rather than to higher rate of root growth. Results do not support the view that poor growth at suboptimal temperatures is caused primarily by restricted P uptake, but that T and P supply limit growth independently, with additive responses.
P
LANT COMPOSITION and nutrient absorption by grainsorghum may be influenced by many genetic and environmental factors. Of the environmental factors,
L. Ercoli, Scuola Superiore di Studi Universitari e di Perfezionamento S. Anna, via Carducci, 40 - 56100 Pisa, Italy; M. Mariotti and F. Massantini, Dip. di Agronomia e Gestione dell'Agro-Ecosistema, Univ. ofPisa, viaS. Micheledegli Scalzi, 2-56100 Pisa, Italy; and A. Masoni, Dip. di Scienze Agronomiche e Genetica Yegetale, Univ. of Napoli Federico II, via Universita, 100 -80055 Portici (NA), Italy. Research supported by National Research Council of Italy, Special Project RAISA, Sub-project no. 2, paper no. 2188. Received 3 Feb. 1995. *Corresponding author.
Published in Crop Sci. 36:348-354 (1996).
nutrient availability and temperature are of prime impor
-tance because they affect key physiological and develop-mental processes determining plant growth, nutrient up -take, and grain yield.
Temperature influences mechanisms involved in plant phosphorus (P) uptake and phosphorus-deficient plants have been associated sometimes with low soil tempera -tures, suggesting that P supply to the root is restricted
with low soil temperature (Barber, 1986).
Satisfactory plant P nutrition is related to the presence
in soil of adequate quantities of H2P04 and HPo~- in soluble form (Mackay and Barber, 1984). An increase in soil temperature may increase the concentration of
soluble soil and fertilizer P or the chemical decomposition
rate of inorganic forms of P. High temperature may raise equilibrium P concentration and thus may affect
plant growth by altering the availability and uptake of
soil P. High temperature may also reduce P solubility by increasing the rate of immobilization and chemical
fixation of P in soil (Singh and Jones, 1977).
Low temperature in the root zone reduces availability of P for wheat (Triticum aestivum L.) (Power et al., 1961), and high temperature increases the absorption of
nitrogen and P by barley (Hordeum vulgare L.). In
barley, the highest P absorption by roots occurs at soil
temperatures of 7 to 11 °C, declining sharply with higher soil temperature, while fertilizer P absorbed by tops is
usually highest at a soil temperature of 11 to 15
o
c
(Poweret al., 1964).
Increasing temperature increases root growth,
allowing plant roots to explore a larger volume of soil. This increases the P potentially absorbable (Stone and
Taylor, 1983; Batten et al., 1986; Fohse et al., 1988).
Abbreviations: GS I, Growth Stage I; GS2, Growth Stage 2; GS3, Growth Stage 3; SAR, specific ab orption rate; SDWI, specific dry weight incre
ERCOLI ET AL.: TEMPERATURE AND PHOSPHORUS EFFECTS ON SORGHUM UPTAKE 349 lncrea ing temperature also increases the rate of physio
-logical processes involved in plant growth, which deter-mine nutrient absorption (Power et al., 1970; Tollenaar, 1989). Thus the ability of the root system to take up P from soil and accumulate it in the shoots (plant uptake
efficiency) depends on the capacity of roots to absorb
P, on the active life time of roots, and on the amount of root per unit of shoot. High P efficiency may also result from uperior translocation or favorable partitioning. Power et al. (1970) showed that reduced growth rate
of barley at low soil temperatures was due to slow
translocation of P from roots to tops.
According to Fohse et al. (1988), P uptake efficiency
depends on influx (uptake rate per unit of root length), root-shoot ratio and the period over which a root segment takes up P. In addition, at a given influx the uptake per plant depends on the size of the root system. Low uptake
efficiency was shown to be associated both with a low root-shoot ratio and a low influx rate. Plants developed different strategies for P uptake from soil: some species
increase the size of their root system, while others
in-crease the uptake rate per unit of root. Increasing soil solution concentration led to an increase in influx rate and a decrease in root-shoot ratio for onion (Allium cepa
L.), ryegrass (Lolium perenne L.), wheat, rape (Brassica napus L.), tomato (Lycopersicum esculentum L.), and
spinach (Spinacia oleracea L.).
This research was conducted in
controlled-environ-ment chambers with the objective of studying the
influ-ence of constant air temperature and P supply on P and
N absorptions and concentrations in the different plant parts of grain sorghum.
MATERIALS AND METHODS
Research was conducted in a climatic chamber, where sor-ghum plants were grown in pots containing 16.5 kg of soil. Soil chemical and physical properties were 77.6% sand, 13.9% silt, 8.5% clay, pH 7.8, 1.2% organic matter (Lotti method), I. 8% total nitrogen (Kjeldahl method), 12 f.lg g-1 assim. P20s
(Olsen method), and 14 f.lg g-1
assim. K20 (Dirks-Sheffer
method). The Venturoli Aralba hybrid sorghum (class 400/
500) was u ed. Three seeds per pot were planted, and seedlings were thinned at Stage I (scale of Vanderlip and Reeves, 1972) to one per pot. Plants were grown under a 14-h day/10-h night photoperiod regime. Sorrells and Myers (1982) reported that for the temperate sorghum group there is an interaction between
variety, air temperature (night and day) and day-length, and
that the number of days to floral initiation is shortest with a
10-h photoperiod. In Central Italy (43 ° N lat), sorghum is planted from about 15 April to I May. At this date, the photoperiod is more than 13 h long, increasing up to 21 June,
when it peaks at 16 h. Lighting was provided by fluorescent lamps (Fluora 77, Osram, Germany) characterized by high emission in the blue and red bands. Photosynthetic photon flux
density at the top of the plant canopy was 450 f.! mol m -2 s-1 measured with a hand-held spectroradiometer model LI-1800 (Ll-COR Inc., Lincoln, NE). Relative humidity was kept at
65
±
5%. .Treatments were air temperatures at 15, 21, 24, 27, 30,
and 35°C and P fertilization rates at 0 and 150 mg pot-1 of
P (4.4 g m- 2). The experiment was a split-plot design, with temperatures serving as main plots and P levels randomly assigned as sub-plots with five replications. Air temperature
was kept constant throughout the trial period (entire life cycle of sorghum) and soil temperature was always about 3
o
c
lower than that of air, owing to soil water evaporation. Phosphorus fertilizer (triple mineral perphosphate) was equivalent to 10 gm-2 of P205 and was uniformly distributed throughout the volume of soil. Nitrogen, as urea, and potassium, as K2S04, fertilizers were applied before seeding at rates of 530 mg por-1
of N (15 g m-2) and 353 mg pot-1 of K20 (8.3 g m-2 of K). Pots were watered regularly to ensure that no water limitation
occurred.
According to Saeed et al. (1986), sorghum development is
divided into three growth stages critical to yield: emergence
to panicle initiation (GSI), panicle initiation to anthesis (GS2), and anthesis to physiological maturity (GS3). Dates of panicle initiation (Stage 3), anthesis (Stage 6), and physiological matu-rity (Stage 9) were recorded for plants in each pot. At each
stage total and plant-component dry weights were determined. All plant parts were dried for dry weight determination at
75°C to constant weight. Plant samples were analyzed for P
and N content, with total P determined colorimetrically in
triacid extract by the ammonium-molybdophosphoric blue
color method (Zandstra, 1968), and total N determined by the microKjeldahJ method (Bremnar, 1965). Leaf, stem, panicle,
and root P and N contents were calculated by multiplying the nutrient concentrations by dry weights. The total amount of P and N per plant was calculated by summing the content of
each element in all plant parts.
The above-ground dry matter growth rate per unit weight of root (Specific Dry Weight Increment) was taken as the parameter for mineral nutrient demand per unit of root. In GS I, GS2, and GS3, this parameter was calculated by modifying the following formula of Engels (1993) as:
SDWI
=
[(S2 - S,)/(12 - t,)] x [ln(R2/R,)/(R2-R,)], where S1 and S 2 are the above-ground dry weight (leaves+ stem+panicle when present) and R, and R2 are root dry weight at the beginning (t1) and the end (t2) of each growing stage
respectively.
Specific absorption rates (SAR) of P and N in GS I, GS2,
and GS3 were calculated according to Hunt's (1981) formula
as:
SAR
=
[(P2- P,)!(t2 - t,)] x [ln(R2/R,)/(R2- R,)],where P, and P2 are whole plant nutrient content and R1 and R2 are root dry weight at times t1 and t2 respectively.
Data were analyzed statistically by analysis of variance,
performed separately for each harvest to test the effects of
temperature, P supply, and temperature x P supply. In addition
to the analyses of variance for individual stages, a combined analysis of variance over stages was conducted. Significantly different means were separated at the 0.05 probability level by the least significant difference test (Snedecor and Cochran, 1980).
RESULTS
Phosphorus Concentration
Optimal growth temperature for dry matter accumula-tion was 27
o
c
for leaves and stems, and 21 to 24oc
forpanicles and roots (results not shown). Up to anthesis, the optimum temperature for whole plant growth was
2rc
,
since the plant was composed mainly of leavesand stems. After anthesis, optimum temperature dropped
to 24
oc,
on account of extensive panicles and roots development. The P rate induced a slightly increased350 CROP SCIENCE, VOL. 36, MARCH-APRIL 1996
Table 1. Effect of temperature on whole plant, leaf, stem, panicle, and root phosphorus concentration of sorghum. Values are
mean of P levels.
P concentration
Stage Temperature Whole plant Leaves Stem Panicle Root
·
c
g kg-•3 21 2.0at 2.4a 2.1a I.Oa 24 2.9b 3.7b 3.1b 1.6b 27 2.8b 3.0c 2.8b 1.7b 30 2.6b 3.2d 2.5ab 1.6b
6 21 !.Sa 2.0a 1.2a 2.0a 1.1a
24 2.4b 3.2b 2.1b 2.2b 1.3a
27 3.1c 3.6b 2.8c 2.6c 2.4b 30 2.6d 3.2b 2.1b 1.7d 1.3a
9 21 1.2a l.la 0.7a 1.9a 0.6a
24 2.lb 2.5b O.Sa 3.2b 0.9a
27 2.8c 3.2c 2.4b 3.6c I.Sb
30 2.3b 2.7b 2.2b 2.5d O.Sa
t Means followed by the same letter, within the same column, are not significantly different at P :s 0.05.
growth rate in all plant parts. Phosphorus concentration in sorghum the whole plant and in different plant parts was affected by temperature but not by P supply or by the temperature x P supply interaction.
Table 1 shows the effect of temperature on whole
plant, leaf, stem, panicle, and root P concentrations in Stages 3, 6, and 9. At each temperature, maximum P
concentration was detected in leaves in Stages 3 and 6, and in panicles in Stage 9. The lowest P concentration
was found in roots at all three stages. In the panicle
initiation stage, leaf P concentration was higher at 24
o
c
than at the other three temperatures. Stem and root P
concentration was also highest at 24°C, but no statis
ti-cally significant differences were found between results obtained at 24, 27, and 30°C. As a consequence, whole
-'c 120
"'
:7:/\
!
100 .§. 0-06 1- 80 · - · 9 z w 60 1-z 00
~
0
(.) 40 a.. C/) 20 w >:-
~
--
6
--
&
< 0 w_.
21 24 27 30 TEMPERATURE ('C) 0'--">-=---'-- ----'---"'--' 21 24 27 30 TEMPERATURE ('C)plant P concentration was the same at 24, 27, and 30°C (approximately 2.7 g kg-1
).
From an thesis to physiological maturity, P
concentra-tion in all plant parts progressively increased with the increase in temperature from 21 to 2rc, and decreased thereafter. The increase was higher for stems ( 133% in Stage 6 and 243% in Stage 9) and for roots ( 118 and 200%) than for leaves (80 and 191 %) or panicles (30 and 89%). Furthermore, the increase was higher for all
plant parts in Stage 9 compared with Stages 3 or 6. From anthesis to physiological maturity, whole plant, leaf, stem (except at 30°C), and root P concentration
decreased at each temperature, while panicle P concentra-tion increased (except at 21 °C).
Phosphorus Content
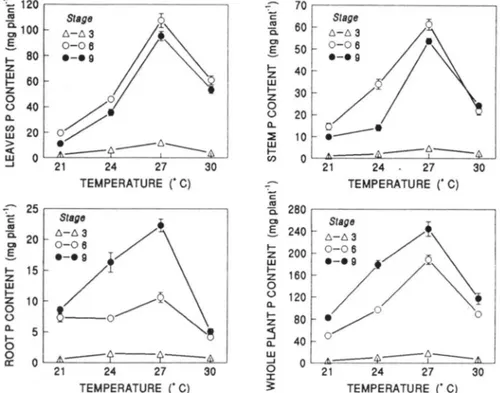
Leaf, stem, root, and whole plant P content was affected by temperature and P supply, while panicle P
content was affected by the temperature x P supply interaction (Fig. 1). At Stage 3, maximum P content
was achieved at 27°C for leaves, stems, and whole plant, and at 24 to 27°C for roots. At this stage plant biomass
was low and temperature-induced variations in P content in all plant parts were negligible. Whole plant P content varied from 4 to 18 mg plant-1
•
In Stages 6 and 9, leaf and stem P content increased markedly from 21 to 27°C and decreased from 27 to
30°C. The increase was greater in leaves (455% in Stage
6 and 7 50% in Stage 9) than in the stems (319 and
447%, respectively), and in both these plant parts, the increase was greater from 24 to 2 7 o C than from 21 to
24 °C. In both stages, minimum leaf and stem P content was detected at 21 °C. From anthesis to physiological
70.---~
c
"'
Q. 0> .§. 1-z w 1-z 0 (.) 60 50 40 30 20 10 Stage a.. ::::!: w 1-C/) _ _ 6_ o~~==~L---'---~-' 21 24 27 30 TEMPERATURE ('C) c: ~ 280 .---, 0> .§. 240 ~ 200 w ~ 160 0 (.) 120 a.. ~ 80~
40 w-
a.-
6
-
"'
-'oo
.___a.==c..- - = - - - ' - - - - ---"'---' :X: 21 24 27 30 3: TEMPERATURE ('C)Fig. I. Leaves, stem, root, and whole plant P content of sorghum as affected by temperature in Stages 3, 6, and 9. Values are mean of P level. Vertical bars represent ± SE of the mean for 10 plants. When not indicated error bar lies within the symbol.
ERCOLI ET AL.: TEMPERATURE AND PHOSPHORUS EFFECTS ON SORGHUM UPTAKE 351 15 100 12 STAGE_6
l
80 STAGE 6 _ _1
9,---,-~
c 60~====§~
l
\
c:Q
---
?
---
2
~"'
c.. c. 6:~ve~
~
OJ 40 OJ.s
P/evel~
.s
3 1- 20 1- z o-oo
z · - · 150 w · - · 150 w 0 1-0 1- z z 140 0 800 0 STAGE 9 (..) STAGE 9 (..) a.. 120-
~~
r~
z (/) (/)~'
100 w 600 w -' -' S:? S:? 80 z;
Q
~f
z c( 400 c( 60 a.. a.. 40 0Pl~v~l
0~!
Pl~v~/ ~ 0-0 0 200 0-0 0 0 20 •-•150°
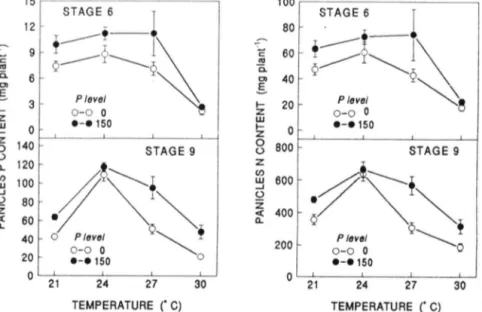
· - · 150 0 21 24 27 30 0 21 24 27 30 TEMPERATURE ("C) TEMPERATURE ("C)Fig. 2. Panicle P and N content of sorghum as affected by temperature x P level interaction in Stages 6 and 9. Vertical bars represent ± SE of the mean for five plants. When not indicated error bar lies within the symbol.
maturity, leaf and stem P content decreased slightly. In
leaves, the decrease was the same at all temperatures
(approximately 9.5 mg plant-1
), while in stems it was highest at 24 oc (20 mg plant-1
). The decrease in leaf
and stem uptake of P between Stages 6 and 9 is indicative
of translocation into the panicles.
Root P content was highest at 27°C in both Stages 6 and 9, but in the Stage 6 the maximum and minimum value differed by only 6.4 mg plant-1
, while in the Stage
9, root P content increased by 13.7 mg planC1 from 21
to 27°C and decreased abruptly by 17.2 mg plant-1 at
30°C (Fig. 1). Root P content at 24 and at 27°C was
higher in Stage 9 than in Stage 6 (9 .1 and 11.7 mg plane 1
, respectively), while at 21 and 30°C, the
differ-ences between the two stages were not noteworthy.
In Stage 6 temperature treatments, from 21 to 27°C, did not modify panicle P content of P-fertilized and unfertilized plants and P supply increased values (Fig.
2). From 27 to 30°C, on the other hand, panicle P content decreased and this decrease was higher for fertilized
than for unfertilized plants. Thus at 30°C, there was no
difference between fertilized and unfertilized plants. In Stage 9, panicle P uptake increased when temperature increased from 21 to 24 oc and decreased thereafter. At all temperatures, P uptake was higher for P-fertilized than
for unfertilized plants, but the difference was negligible at
24°C (Fig. 2). .
As a consequence of leaf, stem, root, and panicle P
uptake, the highest whole plant P content was found at
27°C in all three stages, and was higher in Stage 9 than in Stages 3 or 6 at all temperatures (Fig. 1).
Increased P supply resulted in greater leaf and stem
P content in all three stages at all temperatures, while
root P content was unmodified (Table 2). At physiological maturity, P content in P-fertilized plants was 95.5 mg plant-1 at 21 °C, 183.7 mg planC1 at 24°C, 273.4 mg
plant-1 at 2rc, and 137.1 mg plant-1 at 30°C.
The P taken up by unfertilized plants represents soil P, and that taken up by fertilized plants represents both
soil and fertilizer P. The difference between P content
in the latter group and the former can thus be considered
as the amount derived from fertilizer. The absence of P x
temperature interaction indicated that with increasing temperature, P uptake from soil increased to the same
extent as P uptake from fertilizer. Sorghum whole plant
uptake of soil P exceeded that of fertilizer P and
consti-tuted up to 63% in Stage 3, 79% in Stage 6, and 81% in Stage 9 of total sorghum whole plant P uptake. This is probably because sufficient available P was present in the soil.
Table 2. Effect of P supply on P and N content of sorghum leaves, stem, root, and whole plant in stages 3, 6, and 9. Values are mean
of temperature treatments.
P content N content
Stage P level Whole plant Leaves Stem Root Whole plant Leaves Stem Root
kg ha-' mg plant-'
3 0 7.4at 4.6a 2.1a O.Sa 78.6a S4.Sa 17.8a 6.3a
150 11.8b 7.2b 3.3b 1.2a 121.5b 83.7b 29.2b 8.6b
6 0 93.6a S1.6a 29.2a 6.Sa 630.8a 423.9a 12S.8a 39.0a
ISO 118. 7b 6S.2b 36.7b 8.2a 762.6b S07.4b lSO.Sb 46.7b
9 0 139.7a 44.9a 24.Sa 14.3a 917.7a 3S6.1a 93.1a 95.4a
ISO 172.4b S2.9b 26.5b 11.8a 1087.2b 391.6b 98.9b 88.7b
352 CROP SCIENCE, VOL. 36, MARCH-APRIL 1996
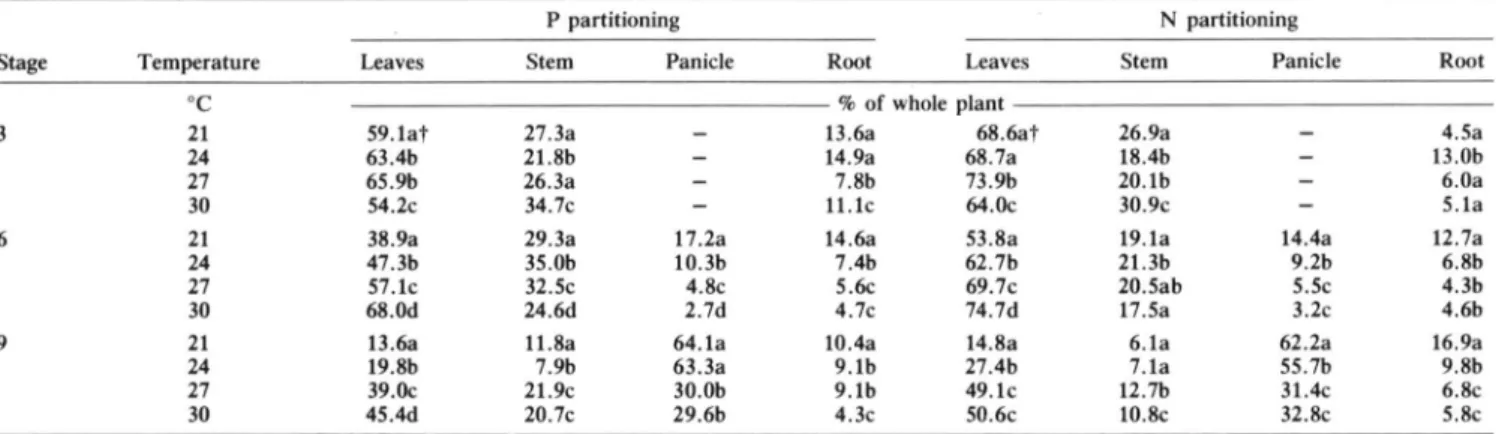
Table 3. Effect of temperature on P and N partitioning in sorghum leaves, stem, panicle, and root. Values are mean of P levels.
P partitioning N partitioning
Stage Temperature Leaves Stem Panicle Root Leaves Stem Panicle Root
o
c
% of whole plant3 21 59.1at 27.3a 13.6a 68.6at 26.9a 4.5a
24 63.4b 21.8b 14.9a 68.7a 18.4b 13.0b
27 65.9b 26.3a 7.8b 73.9b 20.1b 6.0a
30 54.2c 34.7c 11.1c 64.0c 30.9c 5.1a
6 21 38.9a 29.3a 17.2a 14.6a 53.8a 19.1a 14.4a 12.7a
24 47.3b 35.0b 10.3b 7.4b 62.7b 21.3b 9.2b 6.8b
27 57.1c 32.5c 4.8c 5.6c 69.7c 20.5ab 5.5c 4.3b
30 68.0d 24.6d 2.7d 4.7c 74.7d 17.5a 3.2c 4.6b
9 21 13.6a 11.8a 64.1a 10.4a 14.8a 6.1a 62.2a 16.9a
24 19.8b 7.9b 63.3a 9.1b 27.4b 7.1a 55.7b 9.8b
27 39.0c 21.9c 30.0b 9.1b 49.1c 12.7b 31.4c 6.8c
30 45.4d 20.7c 29.6b 4.3c 50.6c 10.8c 32.8c 5.8c
t Means followed by the same Jetter, within the same column, are not significantly different at P !> 0.05. Similarly, efficiency of apparent fertilizer utilization,
calculated at physiological maturity, as [(P uptake by fertilized plant - P uptake by unfertilized plant)/P
sup-ply] was the same at all temperatures, and was found
to be 21.8% (32.7 mg planC1 ).
Phosphorus partitioning among the various plant parts was greatly influenced by temperature in Stages 6 and
9 and to a lesser extent in Stage 3 (Table 3). In this
stage, stems accounted for 30% of whole plant P content,
roots for 10% and leaves for approximately 60%. In Stages 6 and 9, the proportion of P in leaves increased,
while that in panicles and roots decreased with increasing temperature. At physiological maturity, when tempera-ture increased from 21 to 30°C, the proportion of leaf P rose from 14 to 45%, while panicle P decreased from
64 to 30%, and root P from 10 to 4% . Phosphorus
supply had no significant effect on P partitioning among sorghum leaves, stems, roots, and panicles.
Nitrogen Concentration and Content
Similar to P concentration, sorghum whole plant and
different plant part N concentrations were affected by temperature, but were not affected by P supply or by the temperature X P supply interaction. In the panicle initiation stage, leaf, stem, and whole plant N concentra
-tions were maximum at 24 o C (Table 4). During anthesis,
maximum N concentration in leaves was detected at
24 °C, and in the whole plant, stems, and panicles, at
temperature ranging from 24 to 30°C. At physiological maturity the greatest N concentration in all aboveground
plant parts was at 24 to 30°C. Root N concentration was not affected by temperature in Stages 6 and 9.
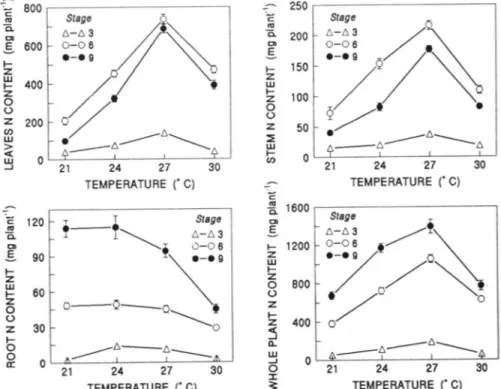
The response of leaf, stem, and whole plant N uptake
to increasing temperature was similar to that of P uptake
in all three stages in as much as values increased from 21 to 27°C and decreased thereafter (Fig. 3). In Stages
6 and 9, root N content did not change from 21 to 24 o C,
and decreased from 24 to 30°C. Root N content in Stages
6 and 9 was affected by the temperature X P supply
interaction, and showed a pattern similar to P uptake
(Fig. 2).
The increase in P availability increased N uptake by
all plant parts with the exception of roots in Stage 9.
The most pronounced increase was observed in leaves
in Stage 6 (Table 2).
Temperature modified N partitioning similarly to P partitioning (Table 3). Thus, at physiological maturity,
when temperature increased from 21 to 30°C, the propor-tion of N in leaves rose from 15 to 50%, while panicle N decreased from 62 to 32% and root N decreased from
17 to 6%. The proportion ofN in leaves, stems, panicles,
and roots was not affected by P supply.
Phosphorus and Nitrogen Uptake Indices
Table 5 shows the effect of temperature on shoot dry
weight, increment and on specific P and N absorption
rate in GS 1, GS2, and GS3 and on root-shoot ratio and
N-P ratio in Stages 3, 6, and 9.
Phosphorus uptake depends both on the amount of
available P in soil and on plant properties. Thus the
increase in plant growth with increasing temperature
enhances a plant's ability to take up P from soil. Shoot dry weight increment represents the increase in shoot
dry weight per unit of root dry weight. Engels (1993) used
this parameter to quantify the mineral nutrient demand
created by shoot growth that is imposed on each unit weight of the root system. In this research, SDWI was
higher in GS2 than GS 1 or GS3 due to extremely elevated
Table 4. Effect of temperature on whole plant, leaf, stem, panicle,
and root nitrogen concentration of sorghum. Values are mean
of P levels.
N concentration
Stage Temperature Whole plant Leaves Stem Panicle Root
o
c
g kg-•3 21 24.7at 35.3a 26.2a 4.9a
24 32.0b 43.0b 28.4a 14.8b
27 28.9b 35.5a 21.8b 13.1b
30 23.1a 32.8a !9.0b 6.4a
6 21 11.4a 21.2a 5.8a 12.3a 7.4a
24 17.5b 31.7b 9.2b 14.5ab 8.9a 27 17.5b 24.7a 9.7b 16.1b 10.1a 30 18.3b 24.4a 10.5b 14.0ab 8.9a 9 21 9.8a 9.8a 2.9a 14.4a 7.3a 24 13.8b 22.2b 4.8ab 18.4b 6.5a 27 16.2b 23.0b 7.6b 21.8b 7.5a 30 15.1b 19.9b 7.5b 19.8b 6.7a t Means followed by the same letter, within the same column, are not
ERCOLI ET AL :TEMPERATURE AND PHOSPHORUS EFFECTS ON SORGHUM UPTAKE 353 ' c: 800 r - - - ,
!
..§. 600:
0~8:~
-0 6/~
1- · -· 9 z~
400~/
z 200 0 ~ • _ _ 6 _ _ _ _ 6 _ _ _ _ ~ o c__:r:._ _ _ ....__ _ _ -=---::-::~ -' 21 24 27 30 ~ 120 c. 0> ..§. 1-z UJ ~ 0 (.) zb
90 60 30 TEMPERATURE ("C) l _ _l
Stager
I~ 6-6 3o
-
o
-~:
- - - -0 0 a: 0~~--~----=---~~----
6
-
6
--
,t,
21 24 27 30 TEMPERATURE ("C) 250~---,c
"'
c. 200i~~i
0\
0> ..§. 1-z UJ 1-z 0 (.) z ~ UJ 1-(/)0
~/
.
• 6'?
-
6
--- ---
6
0 21 24 27 30 150 100 50 TEMPERATURE ("C) 1- 1200 z UJ 1-z 0 (.) z 1-z ~ c.. UJ -' 0 :I: ~ 800 400 /i,-6--6~ 0 21 24 27 30 TEMPERATURE ("C)Fig. 3. Leaves, stem, root, and whole plant N content of sorghum as affected by temperature in Stages 3, 6, and 9. Values are mean of P level.
Vertical bars represent ±SE of the mean for 10 plants. When not indicated error bar lies within the symbol.
growth of the above-ground part. Until anthesis, nutrient demand increased as temperature increased from 21 to
27°C, and decreased above 27°C. In contrast, after anthesis SDWI was consistently l~w and did not present any temperature-related variation. Shoot dry weight in -crement was not affected by P supply.
The P and N uptake rate per unit of root dry weight decreased at all temperatures with progression of the biological cycle of sorghum. As a mean of temperature
and P supply, P SAR decreased from 1.8 g kg-1 in GS1,
to 0.8 g kg-1 in GS2, to 0.1 g kg-1 in GS3, and N SAR
decreased from 18.2 to 5.0 to 0.7 g kg-1
• Our data
suggest that sorghum root P and N uptake efficiency
decreased with plant aging and, until anthesis, was strongly influenced by temperature. Thus, until anthesis
(GS1 and GS2), marked temperature-related vanat10n was observed, with peak values at 27°C and lowest values at 21 °C. In addition, greater differences between maximum and minimum values were found in GS 1 (314%
for P and 261% for N) as compared with GS2 (200 and 100%, respectively). Following anthesis, on the other hand, P and N SAR was not affected by temperature.
The reduction in P and N SAR with plant aging could be attributable to an increase in percentage of older or
suberized roots. Nitrogen and P SAR was unaffected by P availability.
DISCUSSION AND CONCLUSIONS
Temperature controlled P and N concentration and
content of all sorghum plant parts during the biological
Table 5. Effect of temperature on sorghum Shoot Dry Weight Increment (SDWI), Specific P and N Absorption Rates in GSl, GS2, and
GS3 and root-shoot dry weight ratio and N-P ratio in stages 3, 6, and 9. Values are mean of P levels.
SAR
Root-shoot
Growing stage Temperature SOW! p N Stage ratiot N-P ratio
o
c
mg mg-• - - -g kg-• - - - mg mg-•GSI 21 0.3att 0.7a 8.5a 3 0.39a 13.1a
24 0.4a 1.6b 17.lb 0.37a 10.9ab
27 0.9b 2.9c 30.7c 0.16b 10.5ab
30 0.6ab 1.9b 16.6b 0.22b 8.7b
GS2 21 0.9a 0.4a 3.1a 6 0.25a 7.7a
24 1.2ab 0.7ab 4.6ab 0.16b 7.4a
27 1.8b 1.2b 6.2b 0.08c 5.6a
30 1.3ab 0.8ab 5.9b O.lObc 7.1a
GS3 21 0.6a O.la 0.7a 9 0.30a 8.2a
24 0.6a 0.2a I.Oa 0.26a 6.5ab
27 0.4a O.la 0.7a 0.18b 5.7b
30 0.6a O.la O.Sa 0.16b 6.6ab
tOn dry weight basis.
354 CROP SCIENCE, VOL. 36, MARCH-APRlL 1996 cycle, while P supply controlled only P and N content.
Interaction between temperature and P supply was found only for panicle P and N content.
The effect of temperature differed in the different
growth stages and plant parts. Whole plant maximum P
and N concentration was obtained at 24 to 30°C in the panicle initiation stage and at 27°C at anthesis and
physiological maturity. In Stage 3, shoot P and N
concen-tration was highest at 24°C, and that of roots in the 24
to 30°C temperature range. In Stages 6 and 9, the highest P and N concentration in all plant parts was obtained at 27°C.
Whole plant, leaf, stem, and root P and N content was highest at 27°C during all biological cycle for both P-fertilized and unfertilized plants. Increased P supply resulted in greater leaf and stem P and N content in all three stages and at all temperatures, but did not modify
root P and N content. Panicle P and N content was
highest at 21 to 2rc until anthesis and at 24 oc after
anthesis; the increment due to P supply was highest at
27°C. Therefore, sorghum P and N absorption was
maximum at temperatures optimal for dry matter produc-tion. The effect of temperature on increasing plant P and N content could be attributed to temperature-stimulated root growth, which would allow more thorough exploita-tion of a given volume of soil, a temperature-related increasing physiological capacity of roots to absorb nutri
-ents, or both.
Until anthesis for both P fertilized and control plants,
P and N uptake per plant conformed to the following order: 27
>
24 = 300>
21 °C. Since up to anthesis root dry weight decreased progressively from 21 to 30°C,the highest P and N uptake in sorghum was not dependent
on root size. Rather, it was associated with improved root physiological nutrient uptake capacity. Uptake efficiency components are as follow: uptake rate per unit of root length, root-shoot ratio, and the period during which a
root segment takes up nutrients. In this research, highest P and N uptake was associated with highest SDWI and
SAR and lowest root-shoot dry weight ratio. Until anthe-sis, these peak values were observed at 27°C, and after
anthesis SDWI and SAR did not change with temperature
and the root-shoot ratio decreased progressively. In addi-tion, at all temperature regimes, sorghum plants did not
take up P or N after anthesis. Furthermore, during the period from panicle initiation to anthesis leaf and stem
P and N content decreased. This was probably due to translocation into panicles, since an increase in panicle P and N content was observed.
Temperature did not modify utilization of fertilizer P,
since at each temperature, P supply increased sorghum
P uptake by the same amount. Phosphorus fertilization increased P and N uptake but did not modify SDWI, SAR, or root weight. Therefore, the increase was depe n-dent only on the increase in fertilizer-derived soil P,
which also stimulated plant growth.
Sorghum uptake of soil P exceeded that of fertilizer P and accounted for 63% of total P uptake in Stage 3, and for about 80% in Stages 6 and 9 at all temperatures.
Similarly, efficiency of apparent fertilizer utilization was
the same at all temperatures, and was found to be about
22%.
The results of this research do not support the view that poor growth at suboptimal temperatures is caused
primarily by restricted P uptake. Thus, as suggested by Rahaman et al. (1974), it would appear that each factor
(temperature and P supply) is able to limit growth inde-pendently, with additive responses.
REFERENCES
Barber, S.A. 1986. Soil-plant interactions in the phosphorus nutrition
of plants. p. 591-615. In F.E. Khasawneh et al. (ed.) The role
of phosphorus in agriculture. ASA, CSSA, and SSSA, Madison,
WI.
Batten, G.D., !.F. Wardlaw, and M.J. Aston. 1986. Growth and the distribution of phosphorus in wheat developed under various phosphorus and temperature regimes. Aust. J. Agric. Res. 37:
459--469.
Bremnar, T.M. 1965. Total nitrogen. p. 1149-1179. In C.A. Black
et al. (ed.) Methods of soil analysis. Part 2. 1st ed. Agron. Monogr.
9. ASA and SSSA, Madison, WI.
Engels, C. 1993. Differences between maize and wheat in growth
-related nutrient demand and uptake of potassium and phosphorus
at suboptimal root zone temperatures. Plant Soil. 150:129-138. Fiihse, D., N. Claassen, and A. Jungk. 1988. Phosphorus efficiency
of plants. Plant Soil. 110:101-109.
Hunt, R. 1981. Plant growth analysis. Studies in Biology no. 96.
2nd ed. Edward Arnold (Publishers) Ltd., London.
MacKay, A.D., and S.A. Barber. 1984. Soil temperature effects on root growth and phosphorus uptake by corn. Soil Sci. Soc. Am.
J. 48:818-823.
Power, J.F., D.L. Grunes, and G.A. Reichman. 1961. The influence
of phosphorus fertilization and moisture on growth and nutrient
absorption by spring wheat: I. Plant growth, N uptake, and moisture use. Soil Sci. Soc. Proc. 25:613-618.
Power, J.F., D.L. Grunes, G.A. Reichman, and W.O. Willis. 1964. Soil temperature and phosphorus effects upon nutrient absorption by barley. Agron. J. 56:355-359.
Power, J.F., D.L. Grunes, G.A. Reichman, and W.O. Willis. 1970.
Effect of soil temperature on rate of barley development and nutri
-tion. Agron. J. 65:567-571.
Raharnan, M.S., J.S. Gladstones, and N. Thurling. 1974. Effects of
soil temperature and phosphorus supply on growth and composition
of Lupinus angustifolius L. and L. cosentinii Guss. Aust. J. Agric. Res. 25:885-892.
Saeed, M., C.A. Francis, and M.D. Clegg. 1986. Yield component analysis in grain sorghum. Crop Sci. 26:346-351.
Singh, B. B., and J.P. Jones. 1977. Phosphorus sorption isotherm for evaluating phosphorus requirements of lettuce at five temperature
regimes. Plant Soil 46:31-44.
Snedecor, G.W., and W.G. Cochran. 1980. Statistical methods. 7th
ed. Iowa State University Press, Ames.
Sorrells, M.E., and 0. Myers, Jr. 1982. Duration of developmental
stages of 10 milo maturity genotypes. Crop Sci. 22:310-314. Stone, J.A., and H.M. Taylor. 1983. Temperature and the develop
-ment of the taproot and lateral roots of four indeterminate soybean
cultivars. Agron. J. 75:613-618.
Tollenaar, M. 1989. Response of dry matter accumulation in maize
to temperature: I. Dry matter partitioning. Crop Sci. 29:1239
-1246.
Vanderlip, R.L., and H.E. Reeves. 1972. Growth stages of sorghum (Sorghum bicolor (L.) Moench.). Agron. J. 64:13-16.
Zandstra, H.G. 1968. Automated determination of phosphorus in