R E S E A R C H A R T I C L E
Open Access
Use of contrast-enhanced ultrasound for
assessment of nodular lymphoid
hyperplasia (NLH) in canine spleen
Cyndi Mangano
1, Francesco Macrì
1, Simona Di Pietro
1*, Michela Pugliese
1, Silvia Santoro
2, Nicola M. Iannelli
1,
Giuseppe Mazzullo
1, Rosalia Crupi
3and Massimo De Majo
1Abstract
Background: Nodular lymphoid hyperplasia (NLH) is one of the most common non-neoplastic splenic lesions in dogs, especially in old ones, showing a splenic enlargement. More recent studies have been focused on Contrast Enhanced Ultrasonography (CEUS) analysis of the spleen for establishing normal perfusion patterns and blood pool phase peculiarities of focal lesions.
The aim of the study was to evaluate the qualitative and quantitative CEUS analysis of the canine splenic NLH, characterizing the CEUS pattern of this pathology on 20 clinical cases.
Results: A prospective, observational study was performed using a system equipped with contrast-tuned imaging technology. Mechanical Index was set from 0.08 to 0.11; the contrast medium was a second generation contrast medium composed of sulphur hexafluoride encapsulated of a shell of phospholipids (SonoVue®). Qualitative and quantitative assessment of the enhancement pattern of splenic NLH were performed.
Cytology and histology identified 20 splenic NLH. All of the benign hyperplastic lesions assessed were isoechoic
with a homogeneous pattern than the surrounding normal spleen, during the wash-in phase (10–20 s) of the CEUS
exam. Before finishing the wash-in phase, 20–45 s from the contrast medium inoculation, 19/20 benign nodules became markedly hypoechoic to the adjacent spleen. Sensitivity of hypoechoic pattern for NLH was 95%. Conclusions: These findings should prove useful in the evaluation of focal splenic masses in dogs. Since enhancement and perfusion patterns of NLH seem to coincide with some neoplastic lesions of the spleen
previously reported, in clinical practice attention must be paid to the final diagnosis of canine splenic lesions using only the CEUS exam.
Keywords: Dog, Contrast-enhanced ultrasonography, Diagnostic ultrasound, Nodular lymphoid hyperplasia, Spleen, Sonovue, Qontrast
Background
Morphological changes of the splenic tissue related to the presence of focal lesions are common in aging dog [1].
Nodular lymphoid hyperplasia (NLH) is one of the most common non-neoplastic focal splenic masses, es-pecially in old animals showing enlarged spleen [2–4].
Ultrasonography is the imaging technique of choice for the detection of splenic disease, even though it has a low specificity.
Nodular hyperplasia has a variable appearance and cannot be differentiated on the basis of ultrasonography alone. Echogenicity of the nodules may be similar to the remainder of the spleen; irregular with a hyperechoic central region surrounded by a thin hypoechoic rim; well-demarcated with centralized hypoechoic areas; hyperechoic [5]. Sometimes the nodules are not immedi-ately detected in the normal parenchyma and their
© The Author(s). 2019 Open Access This article is distributed under the terms of the Creative Commons Attribution 4.0 International License (http://creativecommons.org/licenses/by/4.0/), which permits unrestricted use, distribution, and reproduction in any medium, provided you give appropriate credit to the original author(s) and the source, provide a link to the Creative Commons license, and indicate if changes were made. The Creative Commons Public Domain Dedication waiver (http://creativecommons.org/publicdomain/zero/1.0/) applies to the data made available in this article, unless otherwise stated.
* Correspondence:[email protected]
1Department of Veterinary Sciences, University of Messina, Polo Universitario
Annunziata, 98168 Messina, Italy
presence can be suspected by a solid nodule bulging from a regular border of the splenic capsule [1].
Application of Doppler ultrasound allowed to evaluate the characteristics of large vasculature network within and adjacent to the focal splenic lesions [6] .
At Computed Tomography, malignant splenic masses had significantly lower attenuation values than nonmalig-nant splenic masses, on both pre- and postcontrast images [7], although a recent study reported substantial overlap in the pre- and postcontrast CT features of malignant and nonmalignant splenic masses and provides limited specific diagnostic information [8].
The development of microbubbles contrast media and the use of harmonic technique allowed to assess microcircula-tion. Moreover, by enhancement kinetics, contrast ultrasound provided a mean of quantification of tissues perfusion [9].
More recent studies have been focused on Contrast Enhanced Ultrasonography (CEUS) analysis of the spleen for establishing normal perfusion patterns and blood pool phase peculiarities of focal lesions, with the purpose of overcoming the limitations of the standard ultrasonography altogether and replace invasive or very expensive procedures in discriminating between malig-nant versus benign splenic lesions [10–15].
Several enhancement patterns have been observed in the benign focal lesions: isoechogenicity with the sur-rounding normal spleen in most of them; hypoechogeni-city (marked enhancement of lesion with marginal hypoechogenicity) throughout all blood pool phases and hyperechogenicity in the early arterial phase have also been detected in a few of them [13,14].
Morphological or functional modifications of the vascu-lar network have been supposed to be responsible of the enhancement pattern variations in splenic lesions [12]. Alterations of lymphoid tissue have been suggested to vary vascular bed and blood flow dynamics of the spleen. Indeed, both the decrease of the venous sinusoids and the formation of hematic lacunae have been found concurrent with lymphoid hyperplastic foci [10,12,16–20].
Based on the aforementioned concerns, NLH enhance-ment and perfusion patterns during CEUS analysis thus far appear to be neither specific nor characterized in depth and deserve more attention in order to avoid mis-diagnosis [12–14].
To testing a previously developed diagnostic criteria, we performed a CEUS examination in 20 dogs affected by NLH, we also reported the quantitative CEUS in order to provide the quantification of blood flow param-eters of this lesion.
Results
All dogs included in the study were considered healthy and their haematological and haematochemical parame-ters were within reference range.
On B-mode examination, dogs enrolled had a single focal lesion with a mean diameter of 1,86 cm (range: 0.45–3.04 cm). 5/20 nodules were located near the splenic capsule, giving an alterated splenic border. 10/20 nodules were homogeneous and hypoechoic than the splenic parenchyma, 8/20 nodules had mixed echogeni-city, only 2 lesions were isoechoic with small hypoechoic areas.
Color and Power Doppler showed detectable vessels only in 10/20 lesions, with small vessels entering the le-sion and in 3/10 with vessels followed the contour of the lesion.
Contrast-enhanced ultrasound of the normal splenic tissue showed rapid enhancement of the small splenic arteries (10–13 s), a heterogeneous phase of enhancement of the spleen that became homogeneous at peak enhancement and a slow de-crease of enhancement.
During the wash-in phase (10–20 s) of CEUS exam the benign hyperplastic lesions (20/20) were isoechoic with a homogeneous pattern than the surrounding normal spleen.
Starting 20–45 s from the contrast medium inocula-tion, when enhancement of the normal spleen was be-coming homogeneous until peak enhancement (about 40 s after injection), 19/20 (95%) benign nodules became markedly hypoechoic to the adjacent spleen. Inner thin vessels enhancement were visible at this time, even though they gradually disappeared during the wash-out phase of the normal spleen, so that lesions acquired an-echoic feature (Fig.1).
Only 1 nodule was isoechoic during all blood pool phases of the CEUS exam.
Sensitivity of hypoechoic pattern for benign nodular hyperplasia was 95% (95% CI 86–100).
Post-processing quantitative analysis showed, a TIC characterized by a faster wash-in and an early washout than normal parenchyma (Fig.2).
The ascending segment of the curve was steep and then the curve rapidly descended to baseline.
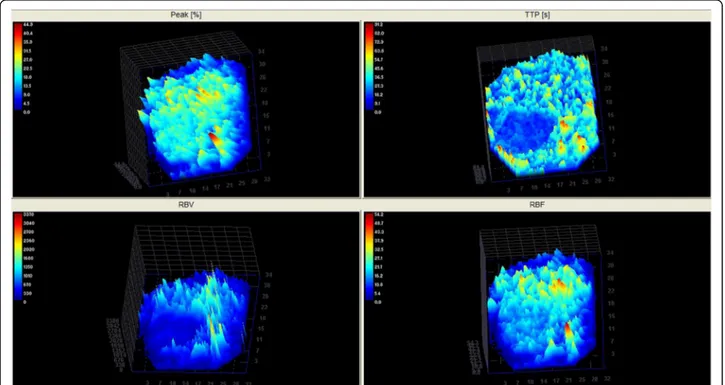
The three-dimensional images of Time to Peak provided a more intuitive visual representation of the contrast medium flow patterns, along the time, both in the nodular tissue and the surrounding normal spleen (Fig.3).
Descriptive statistical analysis of the quantitative CEUS-derived parameters revealed a normal distribution for each value. The perfusion values were significantly lower in the nodule tissue compared with the values of the normal spleen. The values of median, range and P statistical significance of perfusion parameters for both lesion and normal splenic tissues are provided in Table1.
All the examined smears showed cytological features common in all the investigated cases.
They showed a variably degree of cellularity but even optimal quality and moderate hemodilution.
All smears were characterized by a mixed lymph-oid population mainly represented by a predomin-ance of medium and small lymphocytes, a certain
presence of lymphoblasts, rare plasma cells or other kind of cells. No signs of malignancy were observed.
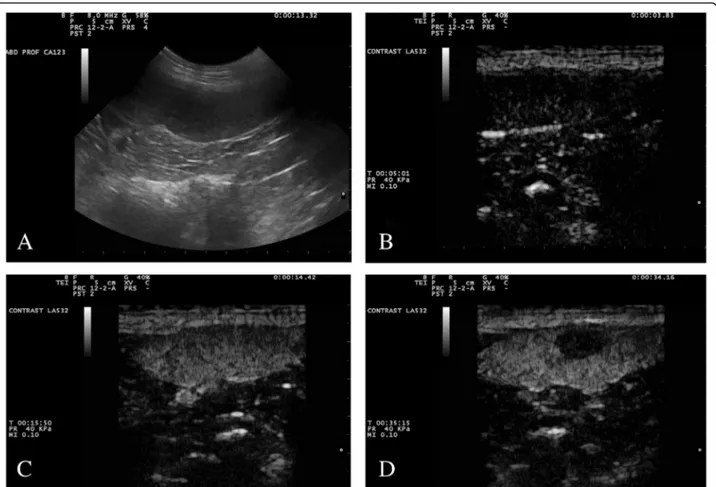
These findings recalled the features of a typical hyper-plastic lymph node response; thus, on this basis and on Fig. 1 Gray-scale (a) and contrast enhanced ultrasound (b–d) images of a splenic benign nodular hyperplasia. The lesion is a round hypoechoic nodule in fundamental ultrasound (a). In the first seconds of the contrast-enhanced ultrasound examination (b), before the entrance of the contrast medium, the image is black because of the suppression of the fundamental signal. After about 10 s (c), the nodule is isoechoic to the surrounding spleen, but it becomes completely hypoechoic after a few more seconds (d)
Fig. 2 Quantitative analyses performed after injection of contrast agent with dedicated perfusion software. Time (seconds) vs. signal intensity (SI%, vertical axis) parametric graphs were drawn from ROIs positioned in the splenic nodule (green graph) and in the normal spleen parenchyma (blue graph)
mere cytological observation, they strongly suggested a diagnosis of hyperplastic nodular reaction of the spleen.
None of dog had adverse reaction during the proced-ure. B-mode follow up examination after one month showed unremarkable changes of nodules.
Discussion
In human medicine, contrast-enhanced ultrasound (CEUS) has been applied in different clinical settings and guidelines for CEUS study of the spleen has been established in a specific study [21]. Contrast-enhanced ultrasound increases the ability to identify most splenic lesions and represent a reliable diagnostic tool to evalu-ate lesions as cysts, ectopic splenic tissue, hemangiomas, hamartomas, infarctions, and abscesses, as well as to fa-cilitate the differentiation between benign and malignant lesions. [22–25].
Also in veterinary medicine, studies about the CEUS perfusion pattern of the normal spleen and of focal lesions were performed and most benign splenic lesions showed a perfusion pattern similar to the adjacent parenchyma, so that the lesions were isoechoic to the surrounding normal spleen after the first few seconds and remained homogeneously isoechoic in the wash out phase [12–14]. The authors explained such results by the similar architecture of the vascular network associ-ated with benign hyperplastic conditions and normal spleen [13].
In the present study we applied CEUS by using the contrast agent sulfur hexafluoride microbubbles in order to determine contrast medium behavior in cytological and histological diagnosed focal splenic NLH in 20 dogs. The appearance of a markedly hypoechoic enhance-ment to the adjacent spleen 20 to 45 s following the con-trast medium inoculation in 95% of examined lesions was the main finding.
In addition, by quantitative analysis, faster TTP and MTT associated to a lesser RBF, and lower PI and RBV in the lesions compared with the surrounding normal parenchyma have been detected, suggesting increased blood velocity and a lower blood volume.
The occurrence of an early in and early wash-out in the NLH observed in our study, does not agree with results of the previous surveys [12–14].
The histologic knowledge about rearrangements of the microvascular environment which can occur in course Fig. 3 Three-dimensional CEUS reconstruction (colour-coded perfusion map) demonstrating Peak (%), TTP(s), RBV and RBF of a canine spleen with a hyperplastic nodule expressed in arbitrary units of signal intensity
Table 1 Median, range values andP-value of CEUS perfusion parameters in Nodular Lymphoid Hyperplasia (NLH) and surrounding normal parenchyma
Variables NLH lesion Normal parenchyma P-value PI (%) 16.2 (10.1–23.7) 20.15 (14.9–31.6) 0.0001 TTP (s) 27.13 (10.54–65.49) 49.53 (25.76–59.38) 0.03 MTT (s) 37.13 (16.47–88.51) 59.72 (34.33–101.32) 0.004 RBF 15.89 (10.88–28.67) 24.72 (16.84–40.52) 0.0001 RBV 669.65 (196.44–2256.1) 1767.6 (616.83–4109.36) 0.0001
of nodular lymphoid hyperplasia give us an explanation for the differences on tissue perfusion assessed by Contrast-enhanced ultrasound in NLH lesions and sur-rounding normal spleen [16].
To justify high perfusion values detected by CEUS analysis in the hyperplastic nodules, Ohlerth et al. (2008) have proposed that distortions of the marginal zone, oc-curring in the NLH [16], may lead to the failure of the intermediate microcirculation and subsequently to blood stasis within and around the hyperplastic nodule, caus-ing accumulation of microbubbles and thus enhance-ment of the lesion [14].
Heterogeneous echogenic patterns, characterized by isoechoic regions to the normal spleen, interspersed among anechoic areas, were observed in case of NLH associated with splenic hematomas, and even hemato-mas without hyperplastic foci were found hypoper-fused during CEUS evaluation [13, 29]. However, different perfusion patterns may be seen in hemato-mas of different ages.
Modifications of the leukocytes environment of the spleen have been seen to affect vascular organization and blood dynamics, nevertheless, hyperplastic lymphoid tissue is known to own a dense vascular bed and to be highly vascularized [14,18,20,26].
This morphological feature do not agree with the isoe-choic appearance of NLH to the surrounding paren-chyma during all blood pool phases.
In our study, as many as 19 out of a total of 20 focal splenic nodules had early wash-in and wash-out phases than the normal parenchyma. These findings suggest a variation of the blood dynamics in parallel with the reorganization of the parenchyma vascular architecture. The isoechoic feature of the lesions to the normal spleen in the arterial phase prompts us to suppose the lack of alterations of the vascular-type structures responsible for blood supply. By contrast, hypoenhancement of the focal masses at the peak-enhancement and dur-ing the wash-out phase of the spleen, and the lower values of RBV and RBF in the lesions compared with the normal surrounding, probably reflect consider-ably decrease of the vascular spaces, specifically of the venous sinusoids. Other authors have proposed similar vascular arrangements to be responsible of the faster wash-in and wash-out phases in the malig-nant tumors to the surrounding normal spleen par-enchyma and have speculate that the lack of normal sinusoids combined with neoplastic angiogenesis might be one of the causes of a malignant hypoe-choic pattern during the late vascular phase [12, 13]. In addition, such a modifications of the intermediate circulation have been observed in splenic lymphoid hyperplasias of dogs infected with visceral leishman-iasis [17, 18, 20].
About the differences during parenchymal phase about hepatic nodular hyperplasia and splenic nodular hyper-plasia, Nakamura et al. (2010), although the precise mechanism of splenic parenchymal phase imaging is not fully determined, speculated that the contrast defect dur-ing the parenchymal phase created by splenic nodular hyperplasia might be because of a decrease of splenic macrophages [12].
Other factors such as transducer frequency, scanning parameters, contrast agent features, multiple injections of the contrast medium, patient-related factors and oper-ator skills might influence both the subjective assess-ment and the measureassess-ments of perfusion [9,27–29].
About the contrast agent dose, we used 0.04 ml/kg of body weight, this dosage was lightly different from 0.03 ml/kg previously used in spleen studies with sulphur hexafluoride contrast medium [13,14,30–32]. Consider-ing the small volume of contrast medium used for a sin-gle bolus/dog, we used 0.04 ml/kg to offset the volume of syringe cone and the difficulty in withdrawing small quantities of contrast agent. This could be considered a limitation of the study. However, too high contrast agent dose results in artefacts such as acoustic shadowing, over-enhancement and signal saturation that are detri-mental for quantification of the early phases; too low a dose, with a reduction of the concentration of the micro-bubbles, afflicting the wash out phases [33]. Concerning the results of the present study, we consider this min-imal difference in contrast medium dosage not relevant about the appearance of a markedly hypoechoic en-hancement of examined lesions to the adjacent spleen, also considering an equal influence as in NLH lesion as in normal parenchyma.
Another limitation of this study is that the diagnosis of splenic Nodular Lymphoid Hyperplasia was performed in most cases by ultrasound-guided cytologic aspirate and not from histologic samples of the specific lesion. However, also in 48 out of 60 subjects studied by Ohlerth et al. and in benign lesions reported by Rossi et al., the diagnosis derives from ultrasound-guided cy-tology [13,14].
Although cytologic diagnoses often reflect histologic results, if missampling or incomplete sampling occurs or tissue architecture is required to distinguish between re-active and neoplastic conditions, accurate diagnosis with fine-needle aspiration may not be possible [34].
However, in a clinical environment and on incidentally detected splenic nodules, although percutaneous fine-needle aspiration and fine-needle core biopsy can be per-formed safely in dogs with sonographic splenic changes [35], ultrasound-guide fine needle aspirates and follow-ing cytology evaluation in addition to an ultrasound follow-up of the lesion are the more common procedure than needle core biopsy or splenectomy.
To date, there are not specific cytologic pattern to de-termine with high specificity the nature of splenic focal lesion and most of them have been investigated only on histopathology. In fact, cytology, especially if performed as a“quick” and routine diagnostic method, lacks of im-portant features, like, for example, the architecture and distribution of cells as they really appear in the organ or in the lesion. Furthermore, in a routine work, as cytology is often involved, it is quite impossible to discern, with the usual staining methods, the T or B nature of cells, thus, in case of tumor suspect, other techniques must be applied and, therefore, the patient must be otherwise considered. In this order, immunocytochemistry, cyto-fluorimetry or Polimerase Chain Reaction for antigen re-ceptor rearrangement (PARR) could represent further methods to consider beside the cytology to differentiate a reactive lymphocyte population from a neoplastic one especially when a malignancy is suspected [36].
In this study a scheduled follow up ultrasound of one month after the diagnosis was performed for all dogs; 12/20 subjects have been checked a second time, during a routine clinical examination over the next 6 months. Certainly, a regular control of the lesion for a longer time could have provided greater strength to the citolo-gical diagnosis of NLH.
Finally, the CEUS pattern observed in this canine be-nign splenic lesion was similar to that reported by some authors for splenic malignant neoplastic lesions [7–9]. This finding allowed us to speculate that the specificity of this pattern in canine splenic CEUS study should be reviewed. Additional studies with larger number of pa-tients are needed to determine the clinical utility of contrast-enhanced ultrasound splenic in characterization of splenic nodules.
Conclusions
The CEUS pattern observed in this canine benign splenic lesion study was similar to that previously re-ported for splenic malignant neoplastic lesions. Conse-quently, in clinical practice, attention must be paid to the final diagnosis of canine splenic lesions using only the CEUS exam and only accurate anatomo-vascular studies can clarify the coincidence of similar patterns of the contrast-enhanced ultrasound study in different splenic lesions.
Methods
General materials
Informed owners’ consents were obtained. All treat-ments, housing, and animal care were in compliance with EU Directive 2010/63/EU on the protection of animals used for scientific purposes and with Depart-ment’s Animal Ethics Council approval (protocol number: 13/2017).
A CEUS prospective, observational study was per-formed (October 2015–December 2017) in 20 consecu-tive dogs with an incidentally detection of a splenic nodular lesion during routine abdominal ultrasonog-raphy. Conclusive diagnosis of NLH, after CEUS study, was performed by ultrasound-guided fine needle aspi-rates (n = 16) or histopathologic (n = 4) samples taken during splenectomy.
Each dog underwent a physical examination; a red blood cell count and serum biochemistry were per-formed. In order to avoid adverse reactions due to the microbubble contrast agent, dogs were excluded if, at the physical examination, had evidence of cardiac dis-ease or a history of anaphylactic reactions to vaccines or other medications. Dogs were also excluded if their haematological and haematochemical parameters were not within normal range. An ultrasound follow-up of one month was scheduled for all dogs.
There was one each Yorkshire, Pomeranian, Weimar-aner, Hound, West Highland and fifteen mixed breed. Thirteen dogs were male and 7 were female. Their ages ranged from 6 to 13 years (mean 9 years); the body-weight ranged from 5 to 28 kg (mean 14 kg).
Ultrasonography procedure
Examinations with B-mode, Doppler ultrasonography and CEUS were performed on all dogs.
B-mode and Doppler ultrasonography of the abdomen were performed by the same operator (C.M.), holding a GPCert (Diagnostic Imaging), during her PhD course and under supervision of a professor of veterinary medical imaging (MDM), using microconvex (5.0 to 8.0-MHz) and linear (10 to 12-8.0-MHz) transducers. Spleen tis-sue was considered normal if the contours were regular and smooth; if the parenchyma was finely textured, homogeneous and more echogenic than liver and the cortex of left kidney. Lesions of the spleen were assessed for their size, number, echo pattern (homogeneous or heterogeneous; hypoechoic, isoechoic, hyperechoic in comparison to normal surrounding parenchyma), and for the presence of cavitary areas within them (anechoic areas surrounded by irregular parenchyma with distal acoustic enhancement or containing corpuscular move-able fluid).
Color Doppler evaluation allowed to evaluate the splenic vascularization, assessing the path of blood ves-sels in and around the lesions.
CEUS examinations was performed by the same inves-tigator (MDM), using a system equipped with contrast-tuned imaging technology (CnTI Mylab 40 and 60/Vet, Esaote, Genova, Italy) in the not sedated dogs.
After detecting the lesions with standard ultrasound, CEUS was performed with a linear (5.0 MHz) transducer with contrast agent capability; a Mechanical Index (MI)
from 0.08 to 0.11, persistency off, a wide dynamic range, and a single focal zone was set deeper to the lesion, in-cluding in the image part of normal splenic parenchyma surrounding the lesion.
Eleven exams were done with a machine that allowed to have a double image (B-mode and CnTI images simultan-eously); nine exams with a machine with a single image (first fundamental and then CnTI). The contrast agent used was a sulphur hexafluoride signal enhancer (Sono-Vue®, Bracco International, Milan, Italy), and it was pre-pared following the manufacturer’s recommendations.
An aliquot (0,04 mL/kg of body weight) of the contrast medium was injected by a second operator (MP), in ac-cordance with a methodology previously reported [37,
38]. Each dog received two bolus injections of contrast agent; the second injection of contrast medium was 10 min later the first. The activation of a timer was per-formed simultaneously with the contrast agent dose in-oculation. Between the two injections, the microbubbles were destroyed with high MI flash on the abdominal aorta. During the first bolus injection, if necessary, ma-chine settings (i.e. total gain, time-gain compensation) were optimized and not changed anymore during the second injection. As animal were not sedated but manu-ally restrained, care was taken to keep the probe in the same position for at least 2 min. Raw data (good-quality video clips for approximately 2 min) obtained during the second contrast enhanced examination were digitally stored on a hard disk and subsequently they were ana-lysed by the same operator.
The splenic focal lesions were classified according to their echogenicity compared to normal tissue in hyper-enhancing, isohyper-enhancing, hypoenhancing or not enhan-cing (anechoic). The presence of homogeneous or heterogeneous lesion patterns, rim enhancement or inner vessels were also evaluated.
Post processing quantitative analysis of video-clips was performed using a dedicated image-analysis software (Qontrast™, Bracco, Milan, Italy) during wash in, peak and wash out phases. For each dog, one Region of Inter-est (ROI), as large as possible, was manually drawn around the entire lesion. A second one ROI, of a similar size to the previous one, was drawn on the normal par-enchyma for comparison. For each ROI, a Time Intensity Curve (TIC) was generated, which is a parametric curve of time (horizontal axis) versus SI, Signal Intensity, (ver-tical axis). During CEUS the tissue perfusion was evalu-ated based on video SI variations over time. The maximal SI was defined as a white band in the grey scale bar (8 bit). Within the selected ROI, the software gener-ated the following parameters: Peak Intensity (PI) de-fined as the percentage increase in SI reached during bolus transit at time T, from baseline intensity to max-imal SI; Time to Peak (TTP), defined as the time, in
seconds, from T0(injection time) until the maximum SI
of the contrast agent. And again, the Regional Blood Flow (RBF) is defined as the ratio between Regional Blood Volume (RBV) and Mean Transit Time (MTT). RBV is proportional to the area under the curve, defined as the area under the time intensity curve during the wash-in and wash-out phase; Mean Transit Time (sec-onds) was defined as the time interval between half of the maximum SI of the contrast agent in the ascending phase of the curve (wash in) and the same value of SI in the descending phase (wash out).
Cytology procedure
For each of the 16 cases where FNA was performed, at least three smears were prepared and stained with MGG. In order to assess a cytological judgement and considering the cytology of such lesion overlapping a lymph node cytology, the following criteria were taken into account: cellularity, homogeneous or mixed lymph-oid population, more represented cytotype, cytological elimination criteria for neoplasia versus other differential diagnoses [39,40].
Statistical analysis
Statistical analysis was performed with a standard com-puter software program (Graphpad prism, GraphPad Software, Inc., La Jolla, CA 92037 USA). All data were expressed as median and range. To compare perfusion values of normal splenic tissue to the values of the lesion tissue, the Student’s t-test was used. When data were non-parametric the Mann-Whitney’s u-test was used. To assess a significant association between the type of enhancement of a lesion with the initial diagnosis of benign lymphoid hyperplasia during the blood pool phases, sensitivity with 95% confidence intervals (CI) was calculated. Statistical significance was assessed at the P < 0.05 level.
Abbreviations
CEUS:Contrast-enhanced ultrasonography; CI: Confidence intervals; MGG: May-Grünwald Giemsa; MTT: Mean transit time; NHL: Nodular lymphoid hyperplasia; PI: Peak intensity; RBF: Regional blood flow; RBV: Regional blood volume; ROI: Region of interest; SI: Signal Intensity; TIC: Time-intensity curve; TTP: Time to peak
Acknowledgments
No third-party funding or support was received in connection with this study or the writing or publication of the manuscript.
Authors’ contributions
FM, MDM and SDP conceived the study. FM, MDM, CM performed the diagnostic examinations. FM, SDP and MDM performed the CEUS off-line quantification analysis, statistical analysis and wrote the manuscript. MP and SS managed the patients and contrast media during the ultrasounds and contributed to reviewing the manuscript. GM performed the anatomo pathological evaluation. RC and NMI analyzed the data and assisted to drafting the manuscript. All authors read and approved the final manuscript.
Funding
There were no funding resources for this study. Availability of data and materials
The datasets used and/or analysed during the current study are available from the corresponding author on reasonable request.
Ethics approval and consent to participate
The protocol was approved by the Animal Ethics Board of the Department of Veterinary Sciences, University of Messina.
The dog owners were informed about the methods and purpose of the study and gave their written informed consent.
Consent for publication
The abstract has already been published on page 340 in Sisvet 2018 Congress Proceedings with the title“Use of contrast-enhanced ultrasound for assessment of nodular lymphoid hyperplasia (NLH) in canine spleen” and we obtained permission from the copyright holder.
Written informed consent was obtained from the dogs’ owners for publication of this manuscript.
Competing interests
The authors declare that they have no competing interests. Author details
1
Department of Veterinary Sciences, University of Messina, Polo Universitario Annunziata, 98168 Messina, Italy.2Camagna Veterinary Clinic, Via Parco
Caserta 13, RC 89124 Reggio Calabria, Italy.3Department of Chemical,
Biological, Pharmaceutical and Environmental Sciences, University of Messina, Viale F. Stagno d’Alcontres 31, 98168 Messina, Italy.
Received: 16 February 2019 Accepted: 30 May 2019
References
1. Corbin E, Cavanaugh R, Schwartz P, Zawadzki KI, Donovan T. Splenomegaly in small-breed dogs: 45 cases (2005–2011). J Am Vet Med Ass. 2017;250: 1148–54.
2. Bettini G, Mandrioli L, Brunetti B, Marcato PS. Canine splenic pathology: a retrospective study of 109 surgical samples, with special emphasis on fibrohistiocytic nodules. Eur J Vet Pathol. 2001;7:101–9.
3. Cowell RL, Dorsey KE, Meinkoth JH. Lymph node cytology. Vet Clin North Am Small Anim Pract. 2003;33:47–67.
4. McGavin MD, Zachary JF. Bone marrow, blood cells and lymphatic system. In: McGavin MD, Zachary JF, editors. Pathologic Basis of Veterinary Disease. Fourth ed. St.Louis, Missuori, USA: Elsevier Mosby; 2010. p. 817–8. 5. Nyland TG, Mattoon JS. Spleen. In: Nyland TG, Mattoon JS, editors. Small
animal diagnostic ultrasound. Third Edition. St. Louis, Missouri, USA: Saunders Elsevier, 2015. p. 400–437.
6. Sharpley JL, Marolf AJ, Reichle JK, Bachand AM, Randall EK. Color and power doppler ultrasonography for characterization of splenic masses in dogs. Vet Radiol Ultrasound. 2012;53:586–90.
7. Fife WD, Samii VF, Drost WT, et al. Comparison between malignant and non-malignant splenic masses in dogs using contrast enhanced computed tomography. Vet Radiol Ultrasound. 2004;45:289–97.
8. Jones ID, Lamb CR, Drees R, Priestnall SL, Mantis P. Associations between dual-phase computed tomography features and histopathologic diagnoses in 52 dogs with hepatic or splenic masses. Vet Radiol Ultrasound. 2016; 57(2):144–53.
9. Tang MX, Mulvana H, Gauthier T, Lim AK, Cosgrove DO, Eckersley RJ, et al. Quantitative contrast enhanced ultrasound imaging: a review of sources of variability. Interface Focus. 2011;1:520–39.
10. Ohlerth S, RüEfli E, Poirier V, Roos M, Kaser-Hotz B. Contrast harmonic imaging of the normal canine spleen. Vet Radiol Ultrasound. 2007;48:451–6. 11. Nakamura K, Sasaki N, Yoshikawa M, Ohta H, Hwang SJ, Mimura T, et al.
Quantitative contrast-enhanced ultrasonography of canine spleen. Vet Radiol Ultrasound. 2009;50:104–8.
12. Nakamura K, Sasaki N, Murakami M, Bandula Kumara WR, Ohta H, Yamasaki M, et al. Contrast-enhanced ultrasonography for characterization of focal splenic lesions in dogs. J Vet Int Med. 2010;24:1290–7.
13. Rossi F, Leone VF, Vignoli M, Laddaga E, Terragni R. Use of contrast-enhanced ultrasound for characterization of focal splenic lesions. Vet Radiol Ultrasound. 2008;49:154–64.
14. Ohlerth S, Dennler M, Rüefli E, Hauser B, Poirier V, Siebeck N, et al. Contrast harmonic imaging characterization of canine splenic lesions. J Vet Int Med. 2008;22:1095–102.
15. Taeymans O, Penninck D. Contrast enhanced sonographic assessment of feeding vessels as a discriminator between malignant vs. benign focal splenic lesions. Vet Radiol Ultrasound. 2011;52:457–61.
16. Spangler WL, Culbertson MR. Prevalence, type, and importance of splenic diseases in dogs: 1.480 cases (1985–1989). J Am Vet Med Assoc. 1992;200: 829–34.
17. Corbett CE, Paes RA, Laurenti MD, Andrade Junior HF, Duarte MI. Histopathology of lymphoid organs in experimental Leishmaniasis. Int J Exp Pathol. 1992;73(4):417–33.
18. Alexandre-Pires G, Pais D, Correia M, Esperança Pina JA. Leishmaniosis– a report about the microvascular and cellular architecture of the infected spleen in Canis familiaris. Microsc Res Tech. 2006;69:227–35.
19. Cole PA. Association of canine splenic hemangiosarcomas and hematomas with nodular lymphoid hyperplasia or siderotic nodules. J Vet Diagn Investig. 2012;24:759–62.
20. Lima IS, Silva JS, Almeida VA, Leal junior FG, Souza PAN, Larangeira DF, et al. Severe clinical presentation of visceral Leishmaniasis in naturally infected dogs with disruption of the splenic white pulp. PLoS One. 2014;9:e87742. 21. Piscaglia F, Nolsøe C, Dietrich CF, et al. The EFSUMB guidelines and
recommendations on the clinical practice of contrast enhanced ultrasound (CEUS): update 2011 on non-hepatic applications. Ultraschall Med. 2012;33: 33–59.
22. Sutherland T, Temple T, Galvin A, Hennessy O. Contrast-enhanced ultrasound of the spleen: an introduction and pictorial essay. Insights imaging. 2011;2:515–24.
23. Omar A, Freeman S. Contrast-enhanced ultrasound of the spleen. Ultrasound. 2016;24(1):41–9.
24. Zavariz JD, Konstantatou E, Deganello A, bosanac D, Huang DY, Sellars ME, Sidhu PS. common and uncommon features of focal splenic lesions on contrat enhanced ultrasound: a pictorial review. Radiol Bras. 2017;50: 395–404.
25. Ivančić M, Long F, Seiler GS. Contrast harmonic ultrasonography of splenic masses and associated liver nodules in dogs. J Am Vet Med Ass. 2009;234: 88–94.
26. McGahan JP, Horton S, Gerscovich EO, Gillen M, Richards JR, Cronan MS, et al. Appearance of solid organ injury with contrast-enhanced sonography in blunt abdominal trauma: preliminary experience. AJR Am J Roentgenol. 2006;187:658–66.
27. Porter TR, Kricsfeld D, Cheatham S, Li S. The effect of ultrasound frame rate on perfluorocarbon-exposed sonicated dextrose albumin microbubble size and concentration when insonifying at different flow rates, transducer frequencies, and acoustic outputs. J Am Soc Echocardiogr. 1997;10:593–601. 28. Leinonen M, Raekallio M, Vainio O, Ruohoniemi M, O’Brien RT. Quantitative
analysis of perfusion in the kidneys, liver, pancreas, small intestine and mesenteric lymph nodes in healthy cats using contrast enhanced ultrasound. Am J Vet Res. 2010;71:1305–11.
29. Macrì F, Di Pietro S, Liotta L, Piccionello AP, Pugliese M, De Majo M. Effects of the size and location of the region of interest on renal perfusion of dogs during contrast-enhanced ultrasound. Am J Vet Res. 2016;77:869–76. 30. Rossi F, Fina C, Stock E, Vanderperren K, Duchateau L, Saunders JH. Effect of
sedation on contrast-enhanced ultrasonography of the spleen in healthy dogs. Vet Radiol Ultrasound. 2016;57:276–81.
31. Volta A, Gnudi G, Manfredi S, Bertoni G. The use of contrast enhanced ultrasound with a second generation contrast medium: preliminary report in the dog. Vet Res Commun. 2009;33(Suppl 1):221–3.
32. Rossi F, Rabba S, Vignoli M, Haers H, Terragni R, Saunders JH. B-mode and contrast-enhanced sonographic assessment of accessory spleen in the dog. Vet Radiol Ultrasound. 2010;51(2):173–7.
33. Dietrich CF, Averkiou M, Nielsen MB, Barr RG, Burns PN, Calliada F, et al. How to perform contrast-enhanced ultrasound (CEUS). Ultrasound Int Open. 2018;4(1):E2–E15.
34. Ballegeer EA, Forrest LJ, Dickinson RM, Schutten MM, Delaney FA, Young KM. Correlation of ultrasonographic appearance of lesions and cytologic and histologic diagnoses in splenic aspirates from dogs and cats: 32 cases (2002-2005). J Am Vet Med Assoc. 2007;230(5):690–6.
35. Watson AT, Penninck D, Knoll JS, Keating JH, Sutherland-Smith J. Safety and correlation of test results of combined ultrasound-guided fine-needle aspiration and needle core biopsy of the canine spleen. Vet Radiol Ultrasound. 2011;52(3):317–22.
36. Sabattini S, Lopparelli RM, Rigillo A, Giantin M, Renzi A, Matteo C, Capitani O, Dacasto M, Mengoli M, Bettini G. Canine splenic nodular lymphoid lesions: Immunophenotyping, proliferative activity, and Clonality assessment. Vet Pathol. 2018;55(5):645–53.
37. Macrì F, Di Pietro S, Mangano C, Pugliese M, Mazzullo G, Iannelli NM, et al. Quantitative evaluation of canine urinary bladder transitional cell carcinoma using contrast-enhanced ultrasonography. BMC Vet Res. 2018;14(1):84. 38. Quartuccio M, Mangano C, Macri F, Rizzo M, Di Pietro S, Pugliese M, et al.
Contrast-enhanced ultrasound evaluation of testicular interstitial cell tumours in conscious non-sedated dogs. Vet Med. 2018;63(3):125–30. 39. Messick JB. The lymph nodes. In: Cowell RL, Tyler RD, Meinkoth JH, DeNicola
DB, editors. Diagnostic cytology and hematology of the dog and cat: Elsevier– Mosby; 2008. p. 179–92.
40. Bonfanti U, Ghibaudo G, Zatelli A, Santilli R, Bussadori C. Diagnosi citologica in corso di patologie epatiche e spleniche del cane e del gatto. Studio retrospettivo su 122 casi (1998-2000). Veterinaria. 2003;17(1):9–15.
Publisher’s Note
Springer Nature remains neutral with regard to jurisdictional claims in published maps and institutional affiliations.