R E S E A R C H A R T I C L E
Open Access
In search of potential predictors of
erythropoiesis-stimulating agents (ESAs)
hyporesponsiveness: a population-based
study
Ingrasciotta Ylenia
1*†, Lacava Viviana
2†, Marcianò Ilaria
3, Giorgianni Francesco
3, Tripepi Giovanni
4,
D
’ Arrigo Graziella
4, Chinellato Alessandro
5, Tari Daniele Ugo
6, Santoro Domenico
2and Trifirò Gianluca
1,3,7Abstract
Background: Evidences show that around 20% of biosimilar or originator erythropoiesis-stimulating agents (ESAs) users are hyporesponsive. Controversial post-marketing data exist on the predictors of ESA hyporesponsiveness. The aim of this study was to identify predictors of ESA hyporesponsiveness in patients with chronic kidney disease (CKD) or cancer in clinical practice.
Methods: During the years 2009–2015, a multi-center, population-based, cohort study was conducted using claims databases of Treviso and Caserta Local Health Units (LHUs). All incident ESA users were characterized at baseline and the differences between the baseline hemoglobin (Hb) value, that is the Hb registered within 30 days prior to the first ESA dispensing (index date, ID) and each outcome Hb value (registered between 30 and 180 days after ID) were calculated and defined as delta Hb (ΔHb). Incident ESA users were defined as hyporesponsive if, during follow-up, they registered at least one ΔHb < 0 g/dL. Including all potential predictors of ESA hyporesponsiveness and stratifying by indication for use, univariate and multivariate binary logistic regression models and Receiver Operating Characteristic (ROC) curves were carried out.
Results: In general, 1080 incident ESA users (CKD: 57.0%; cancer: 43.0%) were identified. In CKD, predictors of ESA hyporesponsiveness were C-reactive protein (OR = 1.2, 95% CI: 1.0–1.5; P-value = 0.060) and high levels of baseline Hb (OR = 1.7, 95% CI: 1.2–2.2; P-value< 0,001), the latter being also predictor of ESA hyporesponsiveness in cancer (OR = 1.7, 95% CI: 1.1–2.4; P-value = 0.007). Both in CKD and in cancer, the type of ESA, biosimilar or originator, was not a predictor of ESA hyporesponsiveness. In CKD, concomitant use of iron preparations (OR = 0.3, 95% CI: 0.2–0.7; P-value = 0.002) and of high dosage of angiotensin-converting enzyme inhibitors/angiotensin II-receptor blockers (OR = 0.5, 95% CI: 0.3–0.9; P-value = 0.022) were protective factors against ESA hyporesponsiveness.
Conclusions: The study confirmed traditional potential predictors of hyporesponsiveness to ESA. The use of biosimilar or originator ESA was not a predictor of hyporesponsiveness in an outpatient setting from two large Italian areas. A better knowledge of the predictors of ESA response would allow a better anemia management to improve patients’ quality of life.
Keywords: Hyporesponsiveness, Erythropoiesis-stimulating agents, Prediction, Claims database
© The Author(s). 2019 Open Access This article is distributed under the terms of the Creative Commons Attribution 4.0 International License (http://creativecommons.org/licenses/by/4.0/), which permits unrestricted use, distribution, and reproduction in any medium, provided you give appropriate credit to the original author(s) and the source, provide a link to the Creative Commons license, and indicate if changes were made. The Creative Commons Public Domain Dedication waiver (http://creativecommons.org/publicdomain/zero/1.0/) applies to the data made available in this article, unless otherwise stated. * Correspondence:[email protected]
Ingrasciotta Ylenia and Lacava Viviana are first authorship shared.
1Department of Biomedical and Dental Sciences and Morphofunctional
Imaging, University of Messina, Via Consolare Valeria 1, Messina, Italy Full list of author information is available at the end of the article
Introduction
Erythropoiesis-stimulating agents (ESAs) are biological products, analogues of human erythropoietin, produced by cell lines using the recombinant DNA technology. ESAs are approved for the treatment of anaemia related to chronic kidney disease (CKD) or chemotherapy-induced in cancer patients. According to the Italian Medicines Agency, ESAs are indicated when hemoglobin (Hb) levels are lower than 11 g/dl in CKD patients and lower than 10 g/dl in cancer patients. In Italy, for both indications, hae-moglobinemia has to range between 11 and 12 g/dl [1], avoiding a rise in Hb values greater than 2 g/dl over a four-week period.
Generally, the term“ESA hyporesponsive” refers to pa-tients who need high doses of ESAs (25–100% higher doses than what recommended) to increase and/or maintain their Hb levels within the acceptable range [2]. More specifically, the Kidney Disease Outcomes Quality Initiative (KDOQI) guidelines define patients as ESA hy-poresponsive if they do not experience an increase in Hb levels within the first month of ESA treatment, using an appropriate weight-based dosing (not graded) [3].
ESA hyporesponsiveness could be acute or chronic, but, to date, there is neither consensus nor shared pos-ition on the definpos-ition of the chronic condpos-ition in par-ticular [3]. Based on the definition gave by Sibbel et al., “4 months of continuous ESA hyporesponsiveness [defined considering both Hb concentrations and ESAs doses] can be used to differentiate acute from chronic hyporespon-siveness” [4].
A previously published population-based study, con-ducted on Italian administrative healthcare databases, evaluated the comparative effectiveness of both biosimi-lar and originator ESAs in CKD and cancer patients. Results highlighted that, in clinical practice, around 20% of ESA users were non-responders, defined as sub-jects experiencing no variations or a reduction in Hb levels within the first 3 months of ESA treatment. Fur-thermore, no differences were observed between differ-ent type of ESAs (i.e., biosimilars or originators), in terms of ESA responsiveness [5].
In patients with conservative end-stage renal disease, as well as in dialysis patients, ESA hyporesponsiveness and Hb level variability may lead to cardiovascular com-plications, increasing the risk of all-cause mortality, due to the required higher doses of ESA [6–8].
In both CKD and cancer patients, several factors may contribute to ESA hyporesponsiveness, such as iron defi-ciency, inflammation and malnutrition status, while chronic hyperparathyroidism may affect ESA response in CKD patients, specifically [9,10].
Debate is still on-going regarding the potential effects of renin-angiotensin system inhibitors, such as angiotensin-converting enzyme (ACE) inhibitors or angiotensin
II-receptor antagonists (ARBs), on the development of an-aemia in patients with renal disease [11].
This naturalistic population-based study was aimed at identifying which factors could be associated to ESA hy-poresponsiveness in anaemic patients with CKD or can-cer, in the general population of two Italian Local Health Units (LHUs).
Methods
Data source
A population-based, retrospective, cohort study was con-ducted. As data source, claims databases of Treviso and Caserta LHUs, covering a total population of more than
1.5 million people during the years 2009–2015 (data
were available till 2014 in Treviso LHU), were consid-ered. Each prescription of ESA requires a specific thera-peutic plan to be filled in by specialists, specifying the exact drug name, number of dispensed packages, dosing regimen and indication for use of the drug. These data can be linked, through anonymized patient unique iden-tifier, to other claims databases including information on hospital discharge diagnoses, healthcare service payment exemptions, drug dispensing, outpatient diagnostic tests, results of laboratory tests (in Caserta LHU, these data are available only for a random sample of around 15% of the general population), etc. ICD-9-CM diagnosis codes were used to identify hospital discharge diagnoses and indications for use, while Anatomical Therapeutic Chemical (ATC) classification system codes and Italian marketing authorization (AIC) codes, which distinguish reference products from biosimilars and other ESAs still covered by patent, were used to identify drug dispensing. Additional details about data source can be found elsewhere [12].
Study population
All the residents in Treviso or Caserta LHUs catchment areas in the years 2009–2015 were included in the study, if they had at least 1 year of database history, at least one ESA dispensing during the study period, with no ESAs dispensing within the previous 6 months (i.e. incident ESA users with 6-month washout period), at least one Hb measurement within 1 month prior to the date of the first ESA dispensing during the study period (i.e. Index Date, ID), defined as baseline Hb value, and at least an-other one between the 2nd and the 6th month after ID, defined as outcome Hb value (Fig.1).
The included subjects were observed from the month prior to the ID to the first 6 months after the ID.
Patients were excluded in case they received at least one blood transfusion from 1 month prior to the ID to the last observed outcome Hb value.
Study drugs
All the available ESAs in Italy during the study period were included in the study: epoetin alfa (ATC: B03XA01;
Eprex®, Abseamed®, Binocrit®), epoetin beta (ATC:
B03XA01; Neorecormon®), epoetin zeta (B03XA01; Reta-crit®), darbepoetin alfa (ATC: B03XA02; Aranesp®), and methoxypolyethyleneglycol-epoetin beta (ATC: B03XA03; Mircera®). Binocrit®, Abseamed® and Retacrit® are biosimi-lars of the reference product (Eprex®), while all other ESAs are ESAs still covered by the patent.
Data analysis
ESA users were categorized as CKD or cancer patients, according to indication for use recorded in the elec-tronic therapeutic plan. In case of non-availability of electronic therapeutic plans, an algorithm described else-where was used to identify indication for use [12].
All incident ESA users were characterized at baseline, in terms of demographics, clinical parameters (e.g. hemoglo-binemia and hematic level of creatinine, albumin, ferritin, folate, potassium, sideremia, parathyroid hormone, vita-min B12, C-reactive protein (CRP), and transferrin
satur-ation), comorbidities including arrhythmia, ischemic heart diseases, diabetes mellitus, heart failure and hypertension, and concomitant use of iron preparations, folic acid, vita-min B12and ACE inhibitors/ARBs.
During follow-up, the distribution of mean Hb values among incident ESA users was calculated.
The differences between the baseline Hb and each out-come Hb value were calculated and defined as delta Hb (ΔHb). Incident ESA users were classified as ESA hypo-responsive if, during follow-up, they registered at least
one ΔHb < 0 g/dL. Only incident ESA users having a
baseline Hb value lower than 11 g/dL were included in these analyses.
All analyses were stratified by indication for use.
Sensitivity analysis
Due to the lack of a shared position on the description of ESA hyporesponsiveness, the definition of ESA hypo-responsiveness was modified in the sensitivity analyses. Incident ESA users with at least two consecutive
out-come Hb values ≥11 g/dL, were classified as ESA
re-sponders, irrespective of ΔHb. Elsewhere, they were
considered as ESA hyporesponsive patients.
Statistical analysis
Depending on the distribution for quantitative variables, results were presented as mean ± standard deviation (SD) or median with interquartile range (IQR), and by absolute frequencies and percentages for categorical variables.
Fig. 1 Flow-chart of study population. * no treatment within 6 months prior to Index Date (ID, i.e. date of ESA treatment start). ESA = erythropoiesis-stimulating agents; Hb = hemoglobin; CKD = chronic kidney disease
Univariate and multivariate binary logistic regression models were performed to identify predictors of ESA hy-poresponsiveness, stratifying by indication for use (CKD and cancer). The dependent variable of the model was the hyporesponsiveness to ESA treatment, that is at least onceΔHb < 0 g/dL.
As covariates, all the potential predictors of ESA respon-siveness identified from the database, including sex, age, baseline Hb value, ESA dosage at ID, type of ESA dispensed at ID (biosimilar, reference product or other ESAs still cov-ered by patent), LHU, type of hospital discharge diagnosis (categorized into cardiovascular, non-cardiovascular or both cardiovascular and non-cardiovascular hospitaliza-tions) within 1 year prior to ID, comorbidities (arrhythmia, ischemic heart disease, diabetes mellitus, heart failure, hypertension and dialysis, only for CKD patients), CKD stage or type of tumor (i.e. solid malignant, non-solid ma-lignant, both solid and non-solid mama-lignant, or not classi-fied), concomitant drug use (e.g. iron preparations, vitamin B12, folic acid, high dosage of ACE inhibitor/ARBs) and
la-boratory values (e. g. hematic levels of creatinine, albumin, ferritin, folate, potassium, sideremia, parathyroid hormone, vitamin B12, C-reactive protein [CRP], transferrin satur-ation, acidosis) were included in the model. By restricting potential predictors to all those factors identified from the database, reduce the likelihood of an overstatement.
In the multivariate model, we included all the covari-ates, which were significantly associated to the outcome at the univariate analysis. For each model, a Receiver Operating Characteristic (ROC) curve was performed to predict the discriminatory power of the variables in-cluded in the model.
For each covariate tested as possible predictor of ESA hy-poresponsiveness, the corresponding odds ratio (OR) were reported along with 95% confidence interval (95% CI).
All statistical analyses were performed using SAS 9.3 (SAS Institute, Cary, NC) and SPSS/PC, Version 21 (SPSS Inc., Chicago, Illinois, USA). The significance level for all statistical tests was set at p-value < 0.05.
Results
On a total population of 1,538,812 subjects registered in Treviso and Caserta LHUs, 10,714 (0.7%) received at least one ESA dispensing during the years 2009–2015; of these, 1080 (10.1%) incident ESA users were included in the study, based on the above-mentioned inclusion cri-teria [CKD = 616 (57.0%); cancer = 464 (43.0%)] (Fig.1).
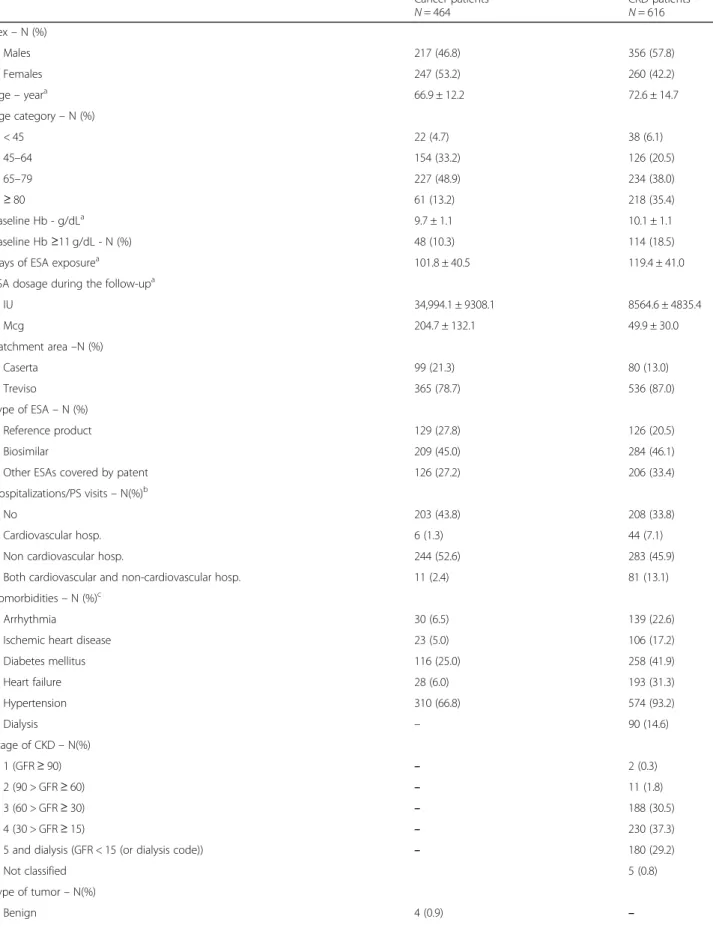
As shown in Table 1, ESAs were in general more
fre-quently used by males among CKD patients, and by fe-males among cancer patients. Regarding age distribution, incident ESA users with CKD appeared to be on average older (mean age ± SD: 72.6 ± 14.7) than patients with can-cer (66.9 ± 12.2). Although most of ESA users started ESA treatment having baseline Hb values within the range
recommended by the Italian guidelines (Hb < 10 g/dL in cancer and Hb < 11 g/dL in CKD), 18.5% (N = 114) of CKD patients and 10.3% (N = 48) of cancer patients started ESA treatment with baseline Hb values≥11 g/dL. Around 45% of incident ESA users received a biosimilar ESA at ID, irrespective of indication of use. In general, CKD patients were more likely to be hospitalized than cancer patients (66.2% vs. 56.2%), especially due to non-cardiovascular diseases. As compared to cancer patients, CKD patients were more likely to be affected by chronic comorbidities, such as hypertension (93.2% vs. 66.8%) and diabetes mellitus (41.9% of vs. 25.0%). Among ESA users with CKD, 410 (66.5%) were affected by stage IV-V CKD or were on dialysis. Instead, more than one third of cancer patients were affected by solid malignant neoplasms, al-though for most of cancer patients the type of tumor was not known (N = 208; 44.8%). CKD patients were more likely to be treated with iron preparations (CKD: 18.3%; cancer: 8.4%) or anti-hypertensive drugs (ACE inhibitor or ARBs) (CKD: 43.0%; cancer: 30.8%) than cancer patients. Considering laboratory parameters, no differences were found among cancer and CKD patients.
The target Hb value, as recommended by the Italian Medicines Agency, was reached on average between 45 and 60 days after ID and was thereafter stable during fol-low-up (Fig.2).
Excluding incident ESA users with baseline Hb values
higher than recommended (i.e., ≥11 g/dL), we observed
that most of subjects included in the study cohort
reached, at least once, the target Hb values (11≤ Hb
levels≤12 g/dL), according to recommendations from Italian guidelines, despite 664 (61.5%) incident ESA users reached Hb levels> 13.0 g/dL, at least once during fol-low-up (Additional file1).
Table 2 showed that, for each cohort, the proportion of ESA hyporesponsive patients was similar using the two approaches of ESA hyporesponsiveness. According to the given definition of ESA hyporesponsiveness, the multivariate binary logistic regression showed that the type of dispensed ESA (biosimilar or originator) was not a predictor of ESA response in CKD. Moreover, high baseline Hb values (OR = 1.7, 95% CI: 1.2–2.2; P-value< 0.001) and CRP hematic levels (OR = 1.2, 95% CI: 1.0– 1.5; P-value = 0.060) were associated to ESA hyporespon-siveness in CKD (Table3), while high baseline Hb values (OR = 1.7, 95% CI: 1.1–2.4; P-value = 0.007) and prior is-chemic heart disease diagnosis (OR = 2.7, 95% CI: 0.9– 7.9; P-value = 0.072) were predictors of ESA hyporespon-siveness in cancer patients (Table 4). On the contrary, ESA hyporesponsiveness was decreased by concomitant use of iron preparations (OR = 0.3, 95% CI: 0.2–0.7; P-value = 0.002) and high dosage of ACE inhibitors/ARBs (OR = 0.5, 95% CI: 0.3–0.9; P-value = 0.022) in CKD pa-tients and by higher levels of albumin and potassium in
Table 1 Characterization of incident ESA users at baseline Cancer patients N = 464 CKD patients N = 616 Sex– N (%) Males 217 (46.8) 356 (57.8) Females 247 (53.2) 260 (42.2) Age– yeara 66.9 ± 12.2 72.6 ± 14.7 Age category– N (%) < 45 22 (4.7) 38 (6.1) 45–64 154 (33.2) 126 (20.5) 65–79 227 (48.9) 234 (38.0) ≥ 80 61 (13.2) 218 (35.4) Baseline Hb - g/dLa 9.7 ± 1.1 10.1 ± 1.1 Baseline Hb≥11 g/dL - N (%) 48 (10.3) 114 (18.5)
Days of ESA exposurea 101.8 ± 40.5 119.4 ± 41.0
ESA dosage during the follow-upa
IU 34,994.1 ± 9308.1 8564.6 ± 4835.4 Mcg 204.7 ± 132.1 49.9 ± 30.0 Catchment area–N (%) Caserta 99 (21.3) 80 (13.0) Treviso 365 (78.7) 536 (87.0) Type of ESA– N (%) Reference product 129 (27.8) 126 (20.5) Biosimilar 209 (45.0) 284 (46.1)
Other ESAs covered by patent 126 (27.2) 206 (33.4)
Hospitalizations/PS visits– N(%)b
No 203 (43.8) 208 (33.8)
Cardiovascular hosp. 6 (1.3) 44 (7.1)
Non cardiovascular hosp. 244 (52.6) 283 (45.9)
Both cardiovascular and non-cardiovascular hosp. 11 (2.4) 81 (13.1)
Comorbidities– N (%)c
Arrhythmia 30 (6.5) 139 (22.6)
Ischemic heart disease 23 (5.0) 106 (17.2)
Diabetes mellitus 116 (25.0) 258 (41.9) Heart failure 28 (6.0) 193 (31.3) Hypertension 310 (66.8) 574 (93.2) Dialysis – 90 (14.6) Stage of CKD– N(%) 1 (GFR≥ 90) – 2 (0.3) 2 (90 > GFR≥ 60) – 11 (1.8) 3 (60 > GFR≥ 30) – 188 (30.5) 4 (30 > GFR≥ 15) – 230 (37.3)
5 and dialysis (GFR < 15 (or dialysis code)) – 180 (29.2)
Not classified 5 (0.8)
Type of tumor– N(%)
Table 1 Characterization of incident ESA users at baseline (Continued) Cancer patients N = 464 CKD patients N = 616 Solid malignant 161 (34.7) –
Non solid malignant 72 (15.5) –
Both solid and non-solid malignant 19 (4.1) –
Non classified 208 (44.8) – Concomitant drugs– N (%)d Iron preparations 39 (8.4) 113 (18.3) Vitamin B12 7 (1.5) 12 (1.9) Folic acid 37 (8.0) 59 (9.6) ACE Inhibitors/ARBs 143 (30.8) 265 (43.0) Laboratory values
Albumin (g/dL; normal range: 3.5–5.5)a 3.6 ± 0.6 3.7 ± 0.6
Creatinine (mg/dL; normal range: M = 0.7–1.2; F = 0.6–1.2)e 0.9 (0.7–1.1) 2.5 (1.7–4.0)
Potassium (mEq/L; normal range: 3.6–5.0)a 4.4 ± 0.6 4.7 ± 0.7
Transferrin saturation (%)a 20.7 ± 14.3 22.3 ± 14.1
Sideremia (mcg/dL; normal range: M = 75–160; F = 60–150)e 56.0 (37.0–83.7) 50.0 (33.0–71.0)
Ferritin (mcg/L; normal range: M = 60–300; F = 30–150)e 278.4 (112.0–583.6) 150.6 (59.5–329.3)
Parathyroid hormone (pg/ml; normal range: 10–60)e 47.0 (27.0–79.0) 160.0 (85.0–300.3)
Vitamin B12(ng/ml; normal range:300–900)a 491.6 ± 224.3 506.9 ± 248.4
Folate (ng/ml; normal range: 2.7–17)e 6.0 (3.9–8.8) 5.2 (3.5–7.6)
CRP (mg/dL; normal value: < 0.5)e 0.9 (0.3–4.4) 0.9 (0.3–3.1)
CKD Chronic kidney disease, GFR Glomerular filtration rate, ACE angiotensin converting enzyme, ARBs Angiotensin II receptor antagonists, CRP C-reactive protein, SD Standard deviation, IQR Interquartile range, IU International Unit, Mcg Microgram
a
Data are expressed as mean ± SD
b
Evaluated within the year prior to ID
c
Evaluated any time prior to ID
d
Evaluated within 3 months prior to ID
e
Data are expressed as median and IQR
cancer patients, although not significantly (P-values> 0.005). The discriminatory power of the predictive re-sponse of the variables included into the models was good, as confirmed by the ROC curves (Figs.3-4).
By modifying the ESA hyporesponsiveness definition in the sensitivity analysis, high baseline Hb value was a positive predictor of responsiveness both in CKD (OR = 0.7, 95% CI: 0.5–1.0; P-value = 0.053) and in cancer pa-tients (OR = 0.5, 95% CI: 0.3–0.8; P-value = 0.003); that is, patients with high baseline Hb values had more chance to reach the target Hb values rather than patients starting ESA treatment with low baseline Hb values (Additional files2, 3,4,5). In addition, concomitant use of iron preparations and acidosis condition increased ESA response in CKD patients, with a good predictive power (AUC = 0.6969 ± 0.03; P-value< 0.001). Moreover, males with CKD (OR = 0.5, 95% CI: 0.3–0.9; P-value: 0.011) seemed to be more responsive than females. Discussion
Anaemia is a common complication in both cancer and CKD patients and it could contribute to a poor prognosis. ESA therapy represents the main treatment to increase
Hb levels in such groups of patients, leading to improve-ment of quality of life and reducing the risk of cardio- and cerebrovascular complications, as well as the requirement of blood transfusions. However, ESA therapy must be carefully handled due to the increased risk of stroke in older patients having Hb levels above the target range. In-deed, due to the occurrence of ESA resistance, the need for higher doses of ESA may increase the risk of develop-ing cardiovascular diseases and, ultimately, death [13]. Moreover, Minutolo et al. demonstrated that ESA hypore-sponsiveness increased the risk of end stage renal disease by 2.5-fold in CKD patients [14].
Our data confirmed that the inflammatory condition and the iron intake affect ESA response. Inflammatory cytokines may affect the development of anemia through suppression of bone marrow erythropoiesis, suppression of erythropoietin production, or interfering with the iron status [15]. Several published studies demonstrated that high levels of CRP in hemodialysis patients were associ-ated with ESA hyporesponsiveness, leading to an in-creased risk of death [16–18]. Although the prevalence of ESA hyporesponsiveness in hemodialysis patients is similar to that found in non-dialysis patients, limited studies on the predictors of ESA hyporesponsiveness have been conducted in the latter population [14].
Regarding the iron intake, our results highlighted that the use of iron preparations was a predictive factor of ESA re-sponse, whilst serum iron and ferritin were not independ-ently associated to responsiveness to ESA treatment. Although previous studies on hemodialysis patients demon-strated that an altered iron status (in terms of low transfer-rin saturation levels and/or low ferritin levels), is a common factor inducing ESA hyporesponsiveness [19], there is no general consensus regarding the role of iron status as a pre-dictor of ESA response. A recent study examined the rela-tionship between iron markers, such as transferrin
Table 2 Frequency of incident ESA hyporesponders Cancer N = 416 (%) CKD N = 502 (%) Non responsiveness ΔHb < 0 g/dLa 146 (35.1) 152 (30.3) Hb < 11 g/dLb 135 (32.4) 147 (29.3)
Only incident ESA users having a baseline Hb value lower than 11 g/dL were included in these analyses
a
Incident ESA users with at least oneΔHb < 0 g/dL
b
Incident ESA users with Hb values < 11 g/dL or with only one Hb value≥11 g/ dL registered between the 2nd and the 6th month after ID
Table 3 Multivariate binary logistic regression to evaluate non responsiveness to ESAs between the 2nd and the 6th month after ID in CKD patients
Non responsiveness ΔHb < 0 g/dL (at least once) OR (95% CI) P-value Baseline Hb (g/dL) 1.7 (1.2–2.2) < 0.001 Comorbidities Hypertension 0.8 (0.3–1.7) 0.513 Concomitant drugs Iron preparations 0.3 (0.2–0.7) 0.002 Folic acid 0.5 (0.2–1.1) 0.100
High dosage ACE inhibitors/ARBs 0.5 (0.3–0.9) 0.022 Laboratory Values
CRP 1.2 (1.0–1.5) 0.060
Transferrin saturation covariate was excluded because of the high proportion of missing values (> 50%)
CKD ESA users starting the treatment at baseline Hb≥ 11 g/dL were excluded ACE angiotensin converting enzyme, CRP C-reactive protein
Table 4 Multivariate binary logistic regression to evaluate non responsiveness to ESAs between the 2nd and the 6th month after ID in cancer patients
Non responsiveness ΔHb < 0 g/dL (at least once) OR (95% CI) P-value Baseline Hb (g/dL) 1.7 (1.1–2.4) 0.007 Comorbidities
Ischemic heart disease 2.7 (0.9–7.9) 0.072 Laboratory Values
Albumin (g/dL) 0.7 (0.5–1.1) 0.091
Potassium (mEq/L) 0.7 (0.4–1.0) 0.063
CRP (mg/dL) 1.1 (0.9–1.3) 0.537
Covariates as ferritin and vitamin B12levels were excluded because of the high
proportion of missing values (> 40%)
Cancer ESA users starting the treatment at baseline Hb≥ 11 g/dL were excluded
Fig. 3 ROC curve to predict the discriminant power of non-responsiveness in CKD
saturation and ferritin levels, and ESA responsiveness. Find-ing from the study highlighted that transferrin saturation, but not ferritin, was statistically associated to ESA hypore-sponsiveness [20]. On the hand, in our study, transferrin saturation covariate was excluded from the analysis, due to the high proportion of missing values (> 50%).
Minutoloet al. studied for the first time the risk of end-stage renal disease in CKD patients, who were hypore-sponsive to ESA treatment. The study findings demon-strated that ESA hyporesponsiveness correlated to an increased risk of end-stage renal disease and the authors suggested that high ESA doses, together with the persist-ence of anemia, could lead to hypoxia, tubular atrophy and interstitial fibrosis, thus causing the progression of the renal damage. On the other hand, no correlation between the iron markers, CRP levels, serum parathyroid hormone, body mass index and ESA response was found [14].
The influence of gender on ESA response is still contro-versial. Female gender was associated with ESA hypore-sponsiveness in our study cohort. This result is in line with previous studies [19, 21], and may be related to the underlying differences in iron release from reticuloendo-thelial cells between the two genders [22]. Conversely, other studies demonstrated that males were more likely to be ESA hyporesponsive, in comparison to women [23,24]. In our study, high doses of ACE inhibitor and/or ARBs were related to ESA responsiveness. This data has been controversially discussed in previous papers. Several studies showing that ACE inhibitors and ARBs are associated to an increase of ESA hyporesponsiveness [23, 25] hypothesized that these anti-hypertensive drugs may interfere with erythropoiesis. It is known that the activation of renin-angiotensin system enhances the erythropoietin produc-tions [26], while its inhibition due to ACE inhibitors may exacerbate anaemia [27]. Moreover, it has been demon-strated that ACE inhibitors may cause an increase in serum N-acetyl-seryl-aspartyl-lysyl-proline (Ac-SDKP) levels, which inhibit the recruitment of pluripotent erythroid cells
in bone marrow [28]. Other potential mechanisms by
which the considered anti-hypertensive drugs may cause anemia are the serum reduction of specific cytokines, such as interleukin-12, and/or of insulin-like growth factor-1, which physiologically stimulate erythropoiesis [11].
Our results also demonstrated that ESA users with meta-bolic acidosis (pH < 7.38 and serum HCO3−< 22 mmol/l) had a good ESA response. Due to the lack of evidence explaining such potential association between metabolic acidosis and ESA hyporesponsiveness, further investigations on this potential predictive factor are needed.
Considering cancer patients, we found that higher base-line Hb values were associated with ESA hyporesponsive-ness (p-value = 0.007), together with the history of ischemic heart disease, although this correlation is close to be significant (p-value = 0.072). The role of cardiovascular
diseases as predictors of ESA hyporesponsiveness has been previously studied [18,29] in CKD patients and the most liable mechanism is related to an increased production of inflammatory cytokines, such as interleukins 1 and 6, Tumor Necrosis Factor and interferon, which induce apoptosis in erythroid progenitor cells and decrease the iron availability by stimulating hepcidin production [30]. Further analyses are, on the other hand, required to con-firm the role of cardiovascular diseases as predictors of ESA hyporesponsiveness in cancer setting.
Strengths and limitations
This study has several strengths. Firstly, we may explore data on ESA dispensing from two large Italian LHUs over a 7-year observation period. Secondly, thanks to the elec-tronic therapeutic plans, information on the exact brand name, number of dispensed packages, and indication for use were available. Moreover, we could explore variations in Hb values as a result of ESA treatment, using real-world data from more than 1000 ESA users. Most of the previous randomized clinical trials were conducted considering CKD patients only, while our study explored the potential predic-tors of ESA hyporesponsiveness in both CKD and cancer patients. However, some limitations warrant caution. The high frequency of missing values for some variables consid-ered into the study (namely: transferrin saturation for CKD, as well as ferritin and vitamin B12 for cancer) precluded the possibility to test the independent effect of these risk factors on the study outcome. Thus such an issue remains to be investigated in a specifically designed future cohort study. Furthermore, although we tested into the models a series of laboratory risk factors assessed proximally to the Hb measurement, the possibility of residual time dependent confounding due to unmeasured confounders cannot be excluded. Some ESA as well as concomitant drugs (i.e. iron preparations) dispensing might not have been fully cap-tured by the LHUs databases, as these drugs may be initially dispensed directly by the public hospitals or purchased by patients as out of pocket, thus not being traced using the study data sources. However, it is unlikely that this limita-tion affected the study results, as the potential seleclimita-tion bias is expected to be minimal and non-differential between ESAs responders and hyporesponders.
Finally, since the exact body weight of each ESA user was not available and we could not evaluate the exact ESA dosing regimen, we defined ESA hyporesponsiveness as a decrease in Hb levels and, in the sensitivity analysis, as the failure in achieving Hb values ≥11 g/dL, as reported by Suttorpet al. in a multi-center, prospective study [7].
.
Conclusions
This study tries to identify some potential predictive fac-tors associated with ESA hyporesponsiveness. Covariates
as serum CRP or high levels of baseline Hb were con-firmed to be associated with poor response to ESA. A better knowledge of the factors associated with ESA re-sponse may help avoiding the use of higher ESA doses, and allow a better anaemia management in order to im-prove the patients’ quality of life and reduce morbidity and mortality of both CKD and cancer patients.
Supplementary information
Supplementary information accompanies this paper athttps://doi.org/10. 1186/s12882-019-1554-0.
Additional file 1. Distribution of Hb values during the follow-up among incident ESA users, stratified by indication for use: a) CKD; b) Cancer. Additional file 2. Multivariate binary logistic regression to evaluate non responsiveness to ESAs between the 2nd and the 6th month after ID in CKD patients.
Additional file 3. ROC curve to predict the discriminant power of non-responsiveness in CKD.
Additional file 4. Multivariate binary logistic regression to evaluate non responsiveness to ESAs between the 2nd and the 6th month after ID in cancer patients.
Additional file 5. ROC curve to predict the discriminant power of non-responsiveness in Cancer.
Abbreviations
ACE:Angiotensin-converting enzyme inhibitors; AIC code: Italian marketing authorization code; ARBs: Angiotensin II-receptor antagonists; ATC code: Anatomical Therapeutic Chemical code; CI: Confidence interval; CKD: Chronic kidney disease; CRP: C-reactive protein; ESAs: Erythropoiesis-stimulating agents; GFR: Glomerular filtration rate; Hb: Hemoglobin; ICD9-CM code: International Classification of Disease, 9th revision, clinical modification code; ID: Index date; IQR: Interquartile range; IU: International Unit; KDOQI: Kidney Disease Outcomes Quality Initiative; LHUs: Local Health Units; Mcg: Microgram; OR: Odds ratio; ROC curves: Receiver Operating
Characteristic curves; SD: Standard deviation Acknowledgements
Ingrasciotta Ylenia, Marcianò Ilaria, Giorgianni Francesco, Tripepi Giovanni, D’Arrigo Graziella, Chinellato Alessandro, Tari Daniele Ugo, Santoro Domenico, Trifirò Gianluca are members of the I-BioNetwork. The authorsd thank Caputi Achille Patrizio, Ientile Valentina, Bolcato Jenny, Pirolo Roberta, Gini Rosa, Roberto Giuseppe, Genazzani Armando, Tari Michele, Pastorello Murizio, Uomo Ilaria, Scondotto Salvatore, Pollina Addario Sebastiano Walter, Cananzi Pasquale, Da Cas Roberto, Traversa Giuseppe, Rossi Mariangela, Davoli Marina, Trotta Francesco, Belleudi Valeria, Addis Antonio who are also members of the I-BioNetwork.
Authors’ contributions
TGianluca generated the study idea. IY and LV wrote the final manuscript. GF, IY, MI, TGiovanni, DAG performed the data analysis. TDU and CA extracted the data and authorized their utilization. SD and TGianluca assisted in interpreting the results under clinical prospective. All authors assisted the results interpretation and manuscript revision. All authors read and approved the final manuscript.
Funding
This study was conducted in the context of the finalized research project “Assessment of short and long term risk-benefit profile of biologics through health-care database network in Italy” (RF- 2010-2320172), which was funded by the Italian Health Ministry. The financial assistance was used to access and analyze data from different partners.
Availability of data and materials
The data that support the findings of this study are available from Caserta and Treviso LHUs, but restrictions apply to the availability of these data,
which were used under license for the current study, and so are not publicly available. Data are however available from the authors upon reasonable request and with permission of Caserta and Treviso LHU.
Ethics approval and consent to participate
All procedures performed in this study were in accordance with the Ethical Standards of the Ethics Committee of the Academic Hospital of Messina and of Treviso, according to the current national law [31], and with the 1964 Helsinki declaration and its later amendments or comparable ethical standards. The manuscript does not contain clinical studies, and all patient data were fully anonymized. For this type of study, formal consent is not required.
Consent for publication Not applicable. Competing interests
Trifirò Gianluca declares his participation to advisory boards on biosimilars, organized by Sandoz and Hospira; furthermore, he coordinates a pharmacoepidemiology research team at the University of Messina, which receives research grants for projects that are not related to the topic of the paper. Ingrasciotta Ylenia, Lacava Viviana, Marcianò Ilaria, Giorgianni Francesco, Tripepi Giovanni, D’Arrigo Graziella, Chinellato Alessandro, Tari Daniele Ugo, Santoro Domenico declare that they have no conflicts of interest.
Author details
1Department of Biomedical and Dental Sciences and Morphofunctional
Imaging, University of Messina, Via Consolare Valeria 1, Messina, Italy.
2Dialysis and Nephrology Unit, University of Messina, Messina, Italy.3Unit of
Clinical Pharmacology, A.O.U. Policlinico“G. Martino”, Messina, Italy.4CNR-IFC, Center of Clinical Physiology, Clinical Epidemiology of Renal Diseases and Hypertension, Reggio Calabria, Italy.5Pharmaceutical Service, Treviso Local Health Unit, Treviso, Italy.6Caserta Local Health Unit, Caserta, Italy. 7
Department of Medical Informatics, Erasmus Medical Center, Rotterdam, Netherlands.
Received: 20 September 2018 Accepted: 6 September 2019 References
1. Determinazione AIFA. Aggiornamento del Piano terapeutico AIFA per prescrizione SSN di Eritropoietine (ex Nota 12).http://www.agenziafarmaco. gov.it/sites/default/files/2010-07-29_determina_aggiornamento_template_ nota_12_g.u._75_del_31-03-2009.pdf. Accessed 12 June 2018.
2. Khankin EV, Mutter WP, Tamez H, Yuan HT, Karumanchi SA, Thadhani R. Soluble erythropoietin receptor contributes to erythropoietin resistance in end-stage renal disease. PLoS One. 2012;5:e9246.
3. International Society of Nephrology. KDIGO Clinical Practice Guideline for Anemia in Chronic Kidney Disease. Kidney In Suppl. 2012;2(Issue 4. Chapter 3):299–310.
4. Sibbel SP, Koro CE, Brunelli SM, Cobitz AR. Characterization of chronic and acute ESA hyporesponse: a retrospective cohort study of hemodialysis patients. BMC Nephrol. 2015;16:144.
5. Ingrasciotta Y, Giorgianni F, Marcianò I, Bolcato J, Pirolo R, Chinellato A, Ientile V, Santoro D, Genazzani AA, Alibrandi A, Fontana A, Caputi AP, Trifirò G. Comparative effectiveness of biosimilar, reference product and other erythropoiesis-stimulating agents (ESAs) still covered by patent in chronic kidney disease and cancer patients: an Italian population-based study. PLoS One. 2016;11(5):e0155805.
6. Szczech LA, Barnhart HX, Inrig JK, Reddan DN, Sapp S, Califf RM, Patel UD, Singh AK. Secondary analysis of the CHOIR trial epoetin-alpha dose and achieved haemoglobin outcomes. Kidney Int. 2008;74:791–8.
7. Suttorp MM, Hoekstra T, Rotmans JI, Ott I, Mittelman M, Krediet RT, Dekker FW. Erythropoiesis-stimulating agent resistance and mortality in
hemodialysis and peritoneal dialysis patients. BMC Nephrol. 2013;25(14):200. 8. Gilbertson DT, Ebben JP, Foley RN, Weinhandl ED, Bradbury BD.
Hemoglobin level variability: associations with mortality. Clin J Am Soc Nephrol. 2008;3:133–8.
9. Locatelli F, Andrulli S, Memoli B, Maffei C, Del Vecchio L, Aterini S, De Simone W, Mandalari A, Brunori G, Amato M, Cianciaruso B, Zoccali C.
Nutritional-inflammation status and resistance to erythropoietin therapy in haemodialysis patients. Nephrol Dial Transplant. 2006;21:991–8.
10. KDOQI. National Kidney Foundation. KDOQI Clinical Practice Guidelines and Clinical Practice Recommendations for Anemia in Chronic Kidney Disease. Am J Kidney Dis. 2006;47(5 Suppl 3):S11–145.
11. Macdougall IC. The role of ACE inhibitors and angiotensin II receptor blockers in the response to epoetin. Nephrol Dial Transplant. 1999;14(8):1836–41. 12. Ingrasciotta Y, Giorgianni F, Bolcato J, Chinellato A, Pirolo R, Tari DU,
Troncone C, Fontana A, Ientile V, Gini R, Santoro D, Santarpia M, Gennazzani A, Uomo I, Pastorello M, Pollina Addario WS, Scondotto S, Cananzi P, Caputi AP, Trifirò G. How much are biosimilars used in clinical practice? A retrospective Italian population-based study of erythropoiesis-stimulating agents in the years 2009-2013. BioDrugs. 2015;29(4):275–84.
13. Solomon SD, Uno H, Lewis EF, Eckardt KU, Lin J, Burdmann EA, de Zwwuw D, Ivanovich P, Levey AS, Parfrey P, Remuzzi G, Singh AK, Toto R, Huang F, Rossert J, McMurray JJ, Pfeffer MA. Erythropoietic response and outcomes in kidney disease and type 2 diabetes. N Engl J Med. 2010;363:1146–55. 14. Minutolo R, Conte G, Cianciaruso B, Bellizzi V, Camocardi A, De Paola L, De
Nicola L. Hyporesponsiveness to erythropoiesis-stimulating agents and renal survival in non-dialysis CKD patients. Nephrol Dial Transplant. 2012;27(7):2880–6. 15. De Francisco ALM, Stenvinkel P, Vaulont S. Inflammation and its impact on
anaemia in chronic kidney disease: from haemoglobin variability to hyporesponsiveness. NDT Plus. 2009;2 [Suppl 1:i18–26.https://doi.org/10. 1093/ndtplus/sfn176.
16. Kalantar-Zadeh K, McAllister CJ, Lehn RS, Lee GH, Nissenson AR, Kopple JD. Effect of malnutrition-inflammation complex syndrome on EPO
hyporesponsiveness in maintenance hemodialysis patients. Am J Kidney Dis. 2003;42:761–73.
17. Kimachi M, Fukuma S, Yamazaki S, Yamamoto Y, Akizawa T, Akiba T, Saito A, Fukuhara S. Minor elevation in C-reactive protein levels predicts incidence of erythropoiesis-stimulating agent hyporesponsiveness among hemodialysis. Patients Nephron. 2015;131(2):123–30.
18. López-Gómez J, Portolés J, Aljama P. Factors that condition the response to erythropoietin in patients on hemodialysis and their relation to mortality. Kidney Int. 2008;74(Suppl 111):S75–81.
19. Kalantar-Zadeh K, Lee GH, Miller JE, Streja E, Jing J, Robertson JA, Kovesdy CP. Predictors of hyporesponsiveness to erythropoiesis stimulating agents in hemodialysis patients. Am J Kidney Dis. 2009;53:823–34.
20. Kuragano T, Kitamura K, Matsumura O, Matsuda A, Hara T, Kiyomoto H, Murata T, Fujimoto S, Hase H, Joki N, Fukatsu A, Inoue T, Itakura Y, Nakanishi T. ESA hyporesponsiveness is associated with adverse events in
maintenance hemodialysis (MHD) patients, but not with iron storage. PLoS One. 2016;11(3):e0147328.
21. Mallick S, Rafiroiu A, Kanthety R, Iqbal S, Malik R, Rahman M. Factors predicting erythropoietin resistance among maintenance hemodialysis patients. Blood Purif. 2012;33:238–44.
22. Uchida T, Akitsuki T, Kimura H, Tanaka T, Matsuda S, Kariyone S. Relationship among plasma iron, plasma iron turnover, and reticuloendothelial iron release. Blood. 1983;61:799–802.
23. Rossert J, Gassmann-Mayer C, Frei D, McClellan W. Prevalence and predictors of epoetin hyporesponsiveness in chronic kidney disease patients. Nephrol Dial Transplant. 2007;22(3):794–800.
24. Gilbertson DT, Peng Y, Arneson TJ, Dunning S, Collins AJ. Comparison of methodologies to define hemodialysis patients hyporesponsive to epoetin and impact on counts and characteristics. BMC Nephrol. 2013;14:44. 25. Erturk S, Ates K, Duman N, Karatan O, Erbay B, Ertug E. Unresponsiveness to
recombinant human erythropoietin in haemodialysis patients: possible implications of angiotensin-converting enzyme inhibitors. Nephrol Dial Transplant. 1996;11:396–7.
26. Vlahakos DV, Balodimos C, Papachristopoulos V, Vassilakos P, Hinari E, Vlachojannis JG. Renin-angiotensin system stimulates erythropoietin secretion in chronic hemodialysis patients. Clin Nephrol. 1995;43(1):53–9. 27. Vlahakos DV, Canzanello VJ, Madaio MP, Madias NE. Enalapril-associated
anemia in renal transplant recipients treated for hypertension. Am J Kidney Dis. 1991;17(2):199–205.
28. Azizi M, Rousseau A, Ezan E, Guyene TT, Michelet S, Grognet JM, Lenfant M, Corvol P, Ménard J. Acute angiotensin-converting enzyme inhibition increases the plasma level of the natural stem cell regulator N-acetyl-seryl-aspartyl-lysyl-proline. J Clin Invest. 1996;97(3):839–44.
29. Guerrero-Riscos MÁ, Montes-Delgado R, Seda-Guzmán M, Praena-Fernàndez JM. Erythropoietin resistance and survival in non-dialysis patients with stage 4–5 chronic kidney disease and heart disease. Nefrologia. 2012;32(3):343–52. 30. Van der Putten K, Braam B, Jie KE, Gaillard CA. Mechanisms of disease:
erythropoietin resistance in patients with both heart and kidney failure. Nat Clin Pract Nephrol. 2008;4(1):47–57.
31. Ministero della Salute, Agenzia Italiana del Farmaco (AIFA). Circolare AIFA del 3 agosto 2007. Linee guida per la classificazione e conduzione degli studi osservazionali sui farmaci.http://xoomer.virgilio.it/pgiuff/osservazionali.pdf. Accessed 9 Sept 2019.
Publisher’s Note
Springer Nature remains neutral with regard to jurisdictional claims in published maps and institutional affiliations.