UNIVERSITA’ DEGLI STUDI DELLA TUSCIA DI VITERBO
DIPARTIMENTO PER L’INNOVAZIONE NEI SISTEMI BIOLOGICI, AGROALIMENTARI E FORESTALI (DIBAF)
CORSO DI DOTTORATO DI RICERCA
IN ECOLOGIA FORESTALE – XXV CICLO
CANOPY PROPERTIES ESTIMATION IN DECIDUOUS FORESTS WITH
DIGITAL PHOTOGRAPHY
AGR/05
COORDINATORE: Prof. Paolo De Angelis
TUTOR : Dott. Andrea Cutini
Acknowledgments
Ringrazio innanzitutto il Prof. Paolo de Angelis e il dott. Andrea Cutini, che mi hanno dato l’opportunità di perfezionare la mia formazione con il dottorato. Sono riconoscente al dott. Craig Macfarlane (CSIRO) per i preziosi consigli che mi ha fornito in fase di analisi e stesura del lavoro. Un sentito ringraziamento va anche al personale del CRA – SEL di Arezzo, in particolare a Umberto Cerofolini, Tessa Giannini, che mi hanno aiutato nello svolgimento dei rilievi in campo. Un ulteriore aiuto in campo mi è stato fornito anche da Giovanni Vagnoli e Giovanni Venturi, che qui ringrazio. Un grazie speciale va a mia moglie Alessandra, che mi ha sostenuto ed incoraggiato durante questi anni, e ai miei figli Pietro e Marta.
Hic tamen hanc mecum poteras requiescere noctem fronde super viridi: sunt nobis mitia poma, castaneae molles, et pressi copia lactis; et iam summa procul villarum culmina fumant, maioresque cadunt altis de montibus umbrae.
Summary Abstract ...6 1. Introduction...7 1.1 Background ...7 1.2 Problem definition...9 1.3 Research objectives...10
2. Literature and Theory review...11
2.1. Canopy definition and units of canopy structure ...11
2.2. Definitions of LAI...11
2.3 Ground-based methods for LAI determination...11
2.3.1 Direct methods ...12
2.3.2 Indirect methods...13
2.4 Canopy instrumentation ...14
2.4.1 Digital photography...14
2.4.1.1 Multidirectional view photography: hemispherical photography ...15
2.4.1.2 Current controversies and opportunities of hemispherical photography: an overview 15 2.4.1.3 Unidirectional view photographic methods: 57.5 degree and cover photography ...17
2.4.2 LAI-2000 PCA...20
2.4.3 Quantum measures...21
3. Materials and methods ...23
3.1. Study sites ...23
3.2. Field measurements...25
3.2.1 Direct measurements of LAI ...25
3.2.2 Direct measurements of canopy transmittance...26
3.2.3 Estimates of canopy properties using digital photography ...26
3.2.3.1 Camera setup, image acquisition and pre-processing of images ...26
3.2.4 Comparison of LAI 2000 PCA and AccuPAR ceptometer ...28
4. Estimation of canopy properties in deciduous forests with digital photography...29
4.1 Methods...29
4.1.1 Software image analysis...29
4.1.2 Statistical analyses...32
4.2 Results...32
4.3 Discussion ...40
4.4 Conclusions...43
5. The influence of spatial resolution on clumping index retrieval in dense forest canopies: an assessment through multidirectional view canopy instruments...45
5.1 Definitions and theory...46
5.2 Methods...49
5.2.1. Software image analysis...49
5.2.2 Comparison with LAI-2000 PCA and littertraps ...50
5.2.3 Statistical analyses...51
5.3 Results...51
5.3.1 The effect of azimuth resolution on clumping index and leaf area index ...51
5.3.2 Comparison with reference values obtained by littertraps...54
5.3.3 Foliage projection coefficient ...55
5.4 Discussion ...57
5.5 Conclusion ...59
6.1.2 Statistical analyses...62
6.2 Results...62
6.4 Discussion and conclusions ...67
7. Conclusive considerations...69
References ...71
ANNEX 1...78
Abstract
Rapid, reliable and meaningful estimates of forest canopies are essential to the characterization of forest ecosystems. The aim of the research was to conduct a thorough technical appraisal of existing available digital photographic methods for forest canopy estimation. The the more traditionally used digital hemispherical photography (DHP), which measures the gap fraction at multiple zenith angles, was compared with methods that measure the gap fraction at a single zenith angle, namely 57° photography and cover photography (DCP). DCP is a more recent canopy photographic method, which measures gap fraction at the zenith (0°).
These methods were applied in deciduous forests of beech, chestnut and Turkey oak. All photographic methods provided good indirect estimates of canopy properties, as compared with reference direct methods obtained by littertraps and AccuPAR ceptometers. However, all methods showed different advantages and disadvantages, which were discussed and addressed.
Among the methods, DCP showed high potential as a means to quickly obtain inexpensive estimates of forest canopy over large areas, being therefore highly suitable for routine, research and monitoring of forest canopy attributes. The method also appeared particularly suitable for calibrating nadir remotely-sensed canopy estimates, on account of its high vertical resolution imagery.
Comparison of logarithm gap fraction averaging procedures implied in DHP allowed defining a protocol for effective leaf area index and apparent clumping index extraction from non segmented analysis of gap fraction, which can be applied to both DHP and LAI-2000 PCA. The results have important implications for the evaluation of satellite-based leaf area index product of airborne laser scanning (LiDAR).
Comparisons of compact (point-and-shoot) cameras with digital single lens reflex cameras allowed defining standardized field protocol for image acquisition and software analysis. The outcome can greatly assist canopy photographic methods to achieve the standards of an ideal device.
The study also provided a suite of several variables of interest such as light extinction coefficient and crown porosity, which can provide insights towards the characterization of deciduous forests, and which can be further applied for further canopy studies in deciduous stands.
Keywords: Hemispherical photography, Cover photography, Leaf area index, Clumping, Light
1. Introduction
1.1 Background
A key aspect in characterizing forest ecosystems is obtaining accurate and reliable estimates of forest canopy (Chen et al. 1997). Leaves and crown are the active interface of energy, carbon and water exchanges between plant and atmosphere (Jarvis and Leverenz 1983). For this reason, crowns and canopy are more sensitive and react more promptly than other stand structural components to abiotic as well as biotic disturbances, and thus show effective potential for use in monitoring the status of forest ecosystems and establishing long-term research programs (Cutini 2003, Macfarlane 2011).
Among the properties, leaf area index (LAI) and photosynthetically active radiation (PAR) are key parameters to wide range of studies including hydrology, carbon and nutrient cycling, and global change (Macfarlane et al. 2007c). Consequently, the description of plant canopies and their interception of radiation have been the subject of considerable scientific endeavour involving both experimental and modelling investigations (Jennings et al. 1999; Van Gardingen et al. 1999). Despite the importance of these variables, it is very difficult to gain accurate and meaningful estimates of them.
Over the last few decades, much attention has been given to indirect estimates of forest canopy properties using ground-based instruments (Bréda 2003; Jonckhhere et al. 2004). This approach is mainly motivated because direct measurements are so destructive, expensive and time consuming that they are unsuitable for most forestry purposes (Jennings et al. 1999). By contrast, remotely sensed vegetation indices show novel potential, but still need site- and stand-specific calibration against ground-based measurements (Bréda 2003).
Indirect optical methods infer LAI and other canopy properties, such as forest light regime, by measurements of radiation transmission through the canopy and making use of radiative transfer theory (Ross, 1981). Among the methods, use of Licor LAI-2000 Plant Canopy Analyzer (PCA; Lincoln Inc., NE, USA) and of AccuPAR Ceptometer (Decagon Devices, Pullman, WA, USA) has gained wide acceptance for estimating LAI and light trasmittance in forest stands, respectively. Regardless of technical drawbacks related to these methods, a significant obstacle to their widespread adoption is represented by the high cost of the instrumentation (Macfarlane et al. 2007c).
Digital photography is a cost-effective and readily available alternative. Since the ’60s, film photography has been used for a long time in forest ecology. However, because it involved many time-consuming steps, it was progressively forsaken (Bréda 2003). More recently, advances in
digital photographic technology have led to a resurgence of interest in photography for indirect quantifying forest canopy. Digital cameras have greatly simplified image capturing and software processing, as compared with film cameras (Macfarlane 2011).
Among the techniques, digital hemispherical photography (DHP), also known as fisheye photography, has long been the most frequently employed of several photographic techniques for describing forest canopies. Hemispherical photography provides estimates of canopies via photographs acquired through a fisheye lens from beneath the canopy oriented towards the zenith (Jonckheere et al. 2004). Hemispherical photography measures the gap fraction at multiple zenith angles; it is characterized by an extreme angle of view, generally with a 180° field of view. The method is cost-effective, as it uses standard camera with a fisheye lens. Nevertheless, the sensitivity of outputs to photographic exposure and image processing is a major drawback (Cescatti 2007; Jonckheere et al. 2004; Zhang et al. 2005). Accordingly, strict protocol should be developed to prevent problems from compounded errors (Jonckheere et al. 2004).
More recently, a new digital photographic technique was proposed by Macfarlane et al. (2007c) namely digital cover photography (DCP). The method involves collecting vertically oriented digital photographic images with a narrow field of view (roughly 30°) and dividing the total zenithal gap fraction into between-crowns and within-crown gaps (Pekin and Macfarlane 2009). The method was pioneered in sparse canopies of Eucalyptus stands in Australia (Macfarlane et al. 2007c) and then it was successfully applied in sparse canopies of Populus euphratica stands in China (Zhongguo et al. 2009) and in an open savanna ecosystem in California (Ryu et al. 2010b). DCP has the advantage that it can be applied during normal working hours due to its insensitivity to photographic exposure, unlike DHP and PCA. The method provides several canopy properties aside from LAI, such as canopy (crown and foliage) cover, crown porosity and zenithal clumping index; however, the method requires an assumed zenithal extinction coefficient to estimate LAI. As another alternative to fisheye and cover photography, use of single direction view photography pointed at 57.5 degree angle provides LAI values without knowledge of the extinction coefficient, because the extinction coefficient is largely independent of the foliage angle distribution at this zenith angle. So far, LAI estimated from both 57.5 degree and DCP has been evaluated directly only in forest stands with low LAI values (< 3.0 m2m-2); thus, a thorough appraisal in more dense canopies is strongly required.
The aim of the current research is to evaluate digital photographic methods for the estimation of canopy properties in dense deciduous forests. The study mainly focussed on LAI; however, since leaf area is computed by other important canopy structure variables such as leaf
1.2 Problem definition
Indirect optical methods such as digital photography are based on measurements of the radiation transmission through the canopy. These methods apply the Beer-Lambert law taking into account that the total amount of radiation intercepted by a canopy layer depends on incident irradiance, canopy structure and optical properties (Monsi and Saeki 1953); this approach requires the assumption that all foliage elements are randomly arranged within the canopy. It is well-accepted that the main source of error in indirect optical LAI estimation (and other related canopy properties) is a result of canopy’s deviation from the random assumption, which was named clumping (Bréda 2003; Chen et al. 1997; Jonckheere et al. 2004; Macfarlane et al. 2007c, Ryu et al. 2010a).
With the available technology, digital photography is able to provide clumping indices (Ω), to accurately estimate LAI from analysis of gap fraction distribution and/or gap size distribution, thereby producing information on the spatial distribution of leaves. However, since clumping effects appear at multiple scales from within-crown level to between-crowns level (Kucharik et al. 1997; Ryu et al. 2010b), different methods quantifying distinct scales of clumping might results into different Ω values. So far, the clumping indices from digital photography have been calculated only in sparse forest canopies, which were characterized by higher between-crowns clumping than within-crown clumping (Leblanc et al. 2005, Macfarlane et al. 2007c). Moreover, Ryu et al. (2010a) recently proposed a method to calculate clumping effects at between-crowns level with the LAI-2000 PCA, which can be implemented in fisheye photography; this approach was successfully tested in a sparse and heterogeneous savanna ecosystem in California. Nevertheless, the degree of clumping in dense canopies and the resulting accuracy of clumping indices calculated from optical methods in dense deciduous forests is still open to debate.
Another source of discrepancy from optical methods is the need to know the foliage angle distribution (Chen and Cihlar 1995). DHP automatically estimates the foliage angle distribution by measuring gap fraction at multiple zenith angles. 57.5 degree photography instead assumes LAI is insensitive to foliage angle at that angle. By contrast, DCP requires a zenithal light extinction coefficient, which is most dependent on leaf inclination angle. However, the reliability of these approaches has been rarely investigated.
Another source of discrepancy is because of the contribution of the supporting woody materials to the radiation interception measurement. Accordingly, all indirect optical methods estimate a Plant Area Index, because they include the contribution of woody elements (Bréda 2003; Chen and Cihlar 1995).
In addition to these, specific technical limitations arise, when using digital photography. A great drawback of photographic methods for estimating canopy metrics has been the tedious and time consuming image processing step and the perceived sensitivity of the results to image processing (Jonckheere et al. 2004, Macfarlane 2011). The sum of these factors may results in different canopy estimates.
1.3 Research objectives
The aim of the study is to assess the accuracy of digital photography for estimating canopy properties in dense deciduous forests, using the more traditional DHP - which has a long history of application in forestry and plant ecology (Evans and Coombe 1959; Anderson 1964) – with the more recently developed DCP. Another technique derived from DHP, namely 57.5 degree photography (Bonhomme et al. 1974) was also tested. Forest stands of the most common deciduous species in Italy, which differed in age, stand structure and silvicultural treatment, were analysed. Other indirect methods commonly used to estimate canopy properties, such as LAI-2000 PCA and AccuPAR ceptometer were also tested, to compare the performance of digital photography with other canopy instrumentations.
The specific objectives of the study were:
• To evaluate the accuracy of LAI from digital photography, as compared with direct LAI derived from litterfall, a direct approach which was considered the most precise method in deciduous forests (Chen et al. 1997; Dufrêne and Bréda 1995);
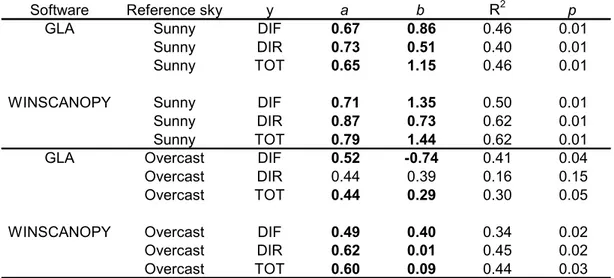
• To evaluate the accuracy of light estimates from DHP with direct measures from AccuPAR ceptometer, obtained in different sky conditions;
• To assess strength and weakness of the different methods, in order to propose corrective strategies to overcome some technical drawbacks of the different photographic techniques;
• To compare and evaluate different gap fraction averaging approaches applicable in DHP and PCA, and the resulting different clumping indices obtainable, and to test the accuracy of the different approaches;
• To conduct a thorough technical appraisal between digital point-and-shoot-cameras- which have been more frequently employed in forestry and plant ecology- and more recent higher quality digital single-lens-reflex (DSLR) cameras.
2. Literature and Theory review
2.1. Canopy definition and units of canopy structure
Canopy is the combination of all leaves, twigs, and small branches in a stand of vegetation; it is the aggregate of all crowns; the open spaces (gap fraction) between canopy elements and the atmosphere contained within- and between-crowns were considered as part of the canopy (Lowman and Nadkarni 1995). Canopy structure is the organization in space and time of these aboveground components of vegetation (Norman and Campbell 1989).
Because measuring all leaves or twigs in a forest canopy is unrealistic, canopy structure can be measured at several levels of detail. It is most commonly described by a characteristic descriptor, such as tree height, stocking rate, canopy cover, and light trasmittance. However, leaf area index is the variable most commonly used to quantify forest canopy.
2.2. Definitions of LAI
Leaf area index is a dimensionless variable and was first defined as the total one-sided area of photosynthetic tissue per unit ground surface area (Watson 1947). For broad-leaved species with flat leaves, this definition is easily applicable (Jonckheere et al. 2004). For non flat leaves (i.e., coniferous leaves), this approach in no longer feasible (Chen and Black 1992). Some authors proposed a projected leaf area to overcome the problem of irregular form of needles and leaves (Smith 1991). Myneni et al. (1997) also proposed the maximum projected leaf area per unit ground surface area. By contrast, Lang et al. (1991) and Chen and Black (1992) suggest half the total interception area per unit ground surface area would be more adequate for non-flat leaves, because they criticized the physical and biological significance of the projected area concept. Different definitions of LAI were also proposed subsequently.
In the current literature and close to Watson’s definition, the following definition has gained wide acceptance: LAI is one half the total leaf area per unit ground surface area (Chen and Black 1992).
2.3 Ground-based methods for LAI determination
There are two main categories of procedure to estimate LAI: direct and indirect methods. Direct methods measure LAI in a direct (or semi-direct, see Dufrêne and Breda 1995) way, while
indirect methods derived LAI from measurements of related variables. In the next section the description of the methods were presented.
2.3.1 Direct methods
Direct methods are the most accurate, but they have the disadvantage of being time-consuming and as a consequence making broad scale application not feasible (Jonckheere et al. 2004). Accordingly, these methods are not suitable for routine measure and monitoring of LAI and other forest canopy properties. However, the need for validation of indirect and remotely sensed methods remains, so direct methods can be considered important as cross-calibration tools (Cutini et al. 1998).
Direct methods involve measurement of leaf area, using either a leaf area meter or a specific relationship of dimension to area via a shape coefficient (Bréda 2003). In coniferous species, projected leaf area differs from the developed one by a coefficient depending on a needle cross-section area (Grace 1987, Barclay 1998, Sellin 2000). Leaf area is determined through repeated area measurements on single leaves and area accumulation (Jonckheere et al. 2004).
Harvesting of trees for direct measurement is the most accurate method, but it is labour intensive, time-consuming and destructive, and practical only in small areas (Bréda 2003, Macfarlane et al. 2007c). This method is better suitable for vegetation of small structure, such as crops and pastures, but is unrealistic in forest stands.
One less destructive method using allometry has been frequently applied in forested ecosystems. This method enables estimation of LAI by measurement of more readily acquirable variable such as diameter at breast height or total height. However, this method is destructive, tedious and time-consuming, and not immune of error because is it site- and species-dependent (Bréda 2003).
In deciduous forests, the litterfall method is a non-destructive direct method consisting of collecting leaves in traps distributed below canopy during leaf-fall period. The litterfall method provides an integrated measure of LAI over the whole measurement period, not at a single moment in time during the growing season. The method is reliable for deciduous species, in which the total leaf fall is directly related to the maximum LAI. For some species which can replace their leaves during the growing season, such as poplar, the method overestimates the maximum LAI (Jonckheere et al. 2004). Additional source of errors may results from SLA estimation; however, this method is less laborious and time consuming than the other direct methods and is the only one giving access to the contribution of each species to total leaf area index (Bréda 2003). Once again,
2.3.2 Indirect methods
Indirect methods infer leaf area index, and other canopy properties, from measurements of the transmission of radiation through the canopy and making use of the radiative transfer theory (Ross 1981). These non-destructive methods are based on a statistical and probabilistic approach to foliar element (or its complement, gap fraction), distribution and arrangement within the canopy (Bréda 2003). LAI is calculated by inversion of the Beer-Lambert law, which computes canopy transmittance (Equation (1)): − ⋅ = ) cos( ) , ( exp ) (
θ
α
θ
θ
G LAI P (1)Where P(θ) is the gap fraction at a given zenith angle (θ), α is the leaf angle, G(θ) is the G-function and correspond to the fraction of foliage projected on the plane normal to the zenith direction. G-function depends from θ and leaf angle α, but the latter is generally unknown.
Bréda (2003) proposed a distinction between gap fraction-based and radiation measurement methods. Jonckhere et al. (2004) instead proposed a distinction between instruments based on gap fraction analysis and instruments based on gap size distribution. However, these classifications are unable to provide a clear distinction between fisheye photography and cover photography; as such, in this study optical indirect methods were divided into two main categories: a first group contains instruments based on multiple zenith angle measurements of gap fraction, while a second group contains instruments based on single zenith angle measurement of gap fraction, similarly with the classification provided by Weiss et al. (2004). This is mainly desirable because different approaches provide different measures of forest canopy and traditional classification may lead to considerable confusion over what is really measured. Jennings et al. (1999) reported a useful discussion of the sometimes confusing terminology relating to canopy measurements in forest vegetation.
Methods based on multiple zenith angle measurements compute LAI by inversion of equation (1):
[
]
) ( ) cos( ) ( lnθ
θ
θ
G P LAI =− (2)Equation (2) is independent from leaf angle (α). Hemispherical photography and LAI-2000 PCA are the most commonly used methods based on multiple zenith angle measurements.
Originally, methods based on single zenith measurement were radiation measurement methods; LAI is computed by measurement of both incidence irradiance (I) and below-canopy radiation (I0), assuming a random distribution of leaves within the canopy (Equation (3)):
) exp(
0 kLAI
I
I = − (3)
Where k is the extinction coefficient. By combining eq. 2 and 3, the expression for k is (Equation (4)): ) cos( / ) , ( ) , (θ α Gθ α θ k = (4)
As such, the extinction coefficient is dependent from zenith angle and leaf angle. Methods involving ceptometer and cover photography are both based on single direction view measurement of trasmittance at the zenith (0°); under certain assumptions (see below), gap fraction from cover photography is the equivalent of transmittance from ceptometer. Another method based on single direction measurement is 57.5° view angle photography, which is a method derived from fisheye photography. Use of 57.5° (≈ 1 radian) is desirable because at that zenith angle both the G-function and the extinction coefficient are almost independents from leaf angle (G~ 0.5; k~0.91; Warren and Wilson 1963); Bonhomme et al. (1974) used 57.5° view angle of hemispherical images to estimate LAI in young crops.
All indirect optical methods share the following assumptions: • Leaves are randomly distributed within the canopy;
• Leaves are small compared to the total field of view of the sensors and compared with the canopy;
• Foliage is black, namely leaves do not transmit light.
Under these assumptions, gap fraction and transmittance are equivalent (Bréda 2003).
2.4 Canopy instrumentation
2.4.1 Digital photography
Photography can be thought of as “upside down” remote sensing. Among the techniques, hemispherical photography has a long history of application in forestry and plant ecology and has been the subject of several reviews (Chen et al. 1997, Kucharik et al. 1999, Bréda 2003, Jonckheere
2.4.1.1 Multidirectional view photography: hemispherical photography
Hemispherical images are acquired via a film or digital camera fit with a fisheye lens from beneath the canopy and oriented towards the zenith. Hemispherical photography has an extreme angle of view (180° FOV). The fisheye image provides a permanent record of sky and vegetation geometry, which is used to calculate solar radiation regimes and canopy properties such as LAI and openness (Rich et al. 1999; Figure 1).
Hemispherical photography is a method that measures the gap fraction at multiple zenith angles. Gap fraction is computed by applying the Beer-Lambert law, modified for clumping effects by Nilson (1971), Equation (5): Ω − = ) cos( ) ( ) ( exp ) (
θ
θ
θ
θ
G LAI P (5)Where Ω(θ) is the clumping index at a given zenith angle; LAI is the leaf area index including leaf and woody materials (also called Plant area index - PAI; Bréda 2003) . Clumping indices can be calculated from an analysis of the gap size distribution (Chen and Cihlar 1995), the gap fraction distribution (Lang and Xiang 1986), or combining both the gap size and the gap fraction distribution analysis (Leblanc 2002).
Measuring the gap fraction at multiple zenith angles enables estimation of both LAI and foliage angle distribution simultaneously, thus avoiding the need to known a priori the extinction coefficient (which is related to the G-function). Hemispherical photography has been also used to estimate the percentage of incident photosynthethic photon flux density (PPFD) transmitted through gaps (Canham et al. 1990).
2.4.1.2 Current controversies and opportunities of hemispherical photography: an overview
The first fisheye lens was developed by Hill (1924) to study cloud formation. Later, the first approach to fisheye photography in forestry was provided by Evans and Coombe (1959), which used hemispherical photography to describe the light environment under forest canopy. Anderson (1964 and 1971) used fisheye photography to calculate the direct and scattered components of solar radiation from visible sky directions. Subsequently, film hemispherical photography has been used for a long time to estimate forest canopy properties (Bonhomme et al. 1974, Anderson 1981, Chan et al. 1986, Wang and Miller 1987). However, technical and theoretical obstacles involving many
time consuming steps have progressively prevented wide spread adoption of film hemispherical photography (Bréda 2003, Macfarlane et al. 2007b).
Hemispherical Image
~180° FOV
Medium resolution Poor vertical sampling
Large effective plot size per image
57.5 degree image
~60° FOV
Low resolution and small number of pixels
No vertical sampling
Medium effective plot size per image
Cover image
~30° FOV High resolution
Mainly vertical sampling
More recently, advances in digital photographic technology and image processing software have led to a renewal of interest in digital hemispherical photography for indirect quantification of forest canopy properties (Bréda 2003, Macfarlane et al. 2007b, Jarčuška et al. 2010). Digital cameras have greatly simplified the process of image capture and processing, when compared with film cameras (Macfarlane 2011). In addition, over the last few years, numerous commercial software packages, as well as freeware programs for canopy analysis, have been developed (Frazer et al. 1999, Jonckheere et al. 2005, Jarčuška 2008).
In spite of these recent improvements, a significant obstacle to widespread adoption of digital hemispherical photography (DHP) remains, that of automation of the analysis of canopy images, which is tedious and time consuming (Jonckheere et al. 2004). Moreover, the sensitivity of outputs to camera exposure and image processing (in particular, gamma correction, thresholding) is a major drawback (Jonckheere et al. 2004, Cescatti 2007). The importance of exposure control is well documented, since automatic exposure has been demonstrated to prevent accurate and reliable estimates of the gap fraction (Chen et al. 1991, Macfarlane et al. 2000, Zhang et al. 2005). Images taken with automatic exposure underestimates gap fraction in open canopies, while overestimates gap fraction in medium-high density canopies (Zhang et al. 2005); as a consequence, exposure needs to be manually set.
Gamma function is another source of uncertainty for hemispherical imagery. The gamma function describes the relation between actual light intensity during photography and the resulting brightness value of the pixel (Wagner 1998). A gamma value of 1.0 denotes an image that accurately reproduces actual light intensity (Macfarlane et al. 2007b). Digital cameras typically have gamma values between 2.0 - 2.5. The main effect of this correction is to lighten the midtones, thus resulting in worse estimate of canopy light transmittance (Cescatti 2007).
Even though an apparent advantage of fisheye photography is that LAI and the extinction coefficient (k) are simultaneously estimated (Equation 4), previous studies found that the foliage angle distribution calculated from hemispherical photography appeared sensitive to canopy structure (Chen and Black 1991, Macfarlane et al. 2007a). As such, the foliage angle distribution calculated from fisheye images should be treated with caution.
2.4.1.3 Unidirectional view photographic methods: 57.5 degree and cover photography
To overcome the main drawback of hemispherical photography, that of the high and skilled intervention of the operator on canopy image analysis needed, different photographic approaches and procedures have been alternatively proposed. Among these, single-direction view photographic methods are theoretically simple and convenient, and have many advantages over fisheye
provides better spatial resolution than the corresponding hemispherical photography (Pekin & Macfarlane 2009). In addition, unidirectional view photography methods are quite insensitive to light conditions and camera exposure (Macfarlane et al. 2007a).
The disadvantage of single direction gap fraction measurement methods is the extinction coefficient needs to be known a priori, unlike methods based on multiple gap fraction measurements such as fisheye photography. It can be determined experimentally from independent destructive measurements of leaf area index (Macfarlane et al. 2007a) or by deriving leaf inclination angle from levelled-digital camera approach (Ryu et al. 2010b; Pisek et al. 2011).
A different approach has been proposed using 57.5 degree photography. The method was derived from the inclined point quadrat method by Warren-Wilson (1960). The rationale behind this method is that for a view angle of 1 radian (57.5°) the G-function can be considered almost independent of leaf inclination (G~0.5; k~0.91; Equation (6)):
[
]
91 . 0 ) 5 . 57 ( ln P LAI =− (6)In addition, the 57.5° approach implies that when foliage inclination angle is about 56°, G is insensitive to view angle θ. This angle approximately equals the mean foliage inclination angle of a spherical distribution model (de Wit 1965), which is a reliable approximation for several canopy types. The major obstacle of 57.5 degree photography is the potentially large contribution of woody area sampled in the image, which would limit the accuracy of canopy properties estimates.
As another alternative to fisheye photography, Macfarlane et al. (2007c) proposed digital cover photography (DCP), a method based on a single zenithal gap fraction measurement. Unlike fisheye photography, DCP uses a narrow field of view (approximately 30° FOV) by pointing a 70 mm (35 mm format equivalent) focal length lens upwards and achieves very fine spatial resolution (Figure 1; Macfarlane et al. 2007b, 2007c). This provides a compromise between vertical FOV and adequate spatial sampling, and is also comparable with the first ring of the LAI-2000 PCA. The DCP method divides gap into those where Beer-Lambert’s law applies (within-crown) and those where it does not (between-crowns; Pekin and Macfarlane 2009). The method provides estimate of crown cover (% ground covered by the vertical projection of solid crowns) and foliage cover (% ground covered by the vertical projection of foliage and branches). The method has many advantages over fisheye photography. It is rapid and insensitive to exposure, and is able to provide several canopy properties, but requires an assumed zenithal light extinction coefficient (k) to estimate LAI.
A more detailed descriptions of the models used in DHP and DCP are provided in the materials and methods section; however, an useful distinction made by Jennings et al. (1999) between two basic types of canopy measurements is illustrated and described below, which allows to discriminate between the different photographic methods (Figure 2).
Figure 2 - Comparison of canopy closure (A) and canopy cover (B).
A) Canopy closure is the proportion of the sky hemisphere obscured by vegetation when viewed from a single point of view. Canopy density is a synonym often found in forestry literature. The term canopy openness is frequently used as the complement of canopy closure (Openness=1-canopy closure) and is defined as the proportion of the sky hemisphere not obscured by vegetation when viewed from a single point. Fisheye photography is a technique used to measure canopy closure.
B) Canopy cover refers to the proportion of the forest floor covered by the vertical projection of the tree crowns. This is analogous to the use of term cover. Cover photography is a technique that measure canopy (foliage and crown) cover.
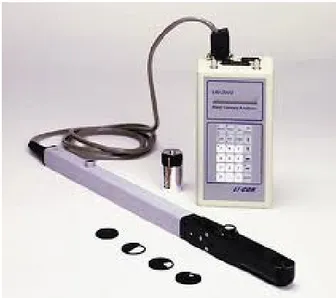
2.4.2 LAI-2000 PCA
LAI-2000 PCA is based on measurement of diffuse radiation attenuation caused by canopy in the blue part of electromagnetic spectra. The method is based on multiple zenith angle measurements, and the theoretical background is similar to that used in hemispherical photography. The instrument (Figure 3) has a data logger and a sensor; the sensor consists of a fisheye lens (148° FOV), a mirror and an optical sensor divided into five concentric rings (with central zenith angles of 7°, 23°, 38°, 53°, 68° set by default, respectively). Measurements made above and below canopy are used to determine canopy light interception at 5 zenith angles, from which LAI is computed using a radiative transfer model. In particular, the PCA method calculated LAI by applying equation (2) as modified by Miller (1967), (Equation (7)):
[
]
∫
− = /2 0 ln ( ) cos sin 2 π Pθ
θ
θ
dθ
LAI (7)LAI-2000 may be regarded as a convenient version of hemispherical photography because image processing is not required (Chen et al. 1997). For instance, PCA has an optical filter in the sensor, which rejects radiation above 490 nm (blue), because the foliage elements have a much lower reflectivity and transmittance in the blue region of the visible electromagnetic spectrum (which meet the ‘foliage is dark’ assumption, see section 2.3.2); in DHP a similar results can be obtained (more laboriously) by processing the blue channel of the image at adequate exposure setting.
However, when comparing with DHP (see equation 5), PCA is unable to provide clumping index (Ω). In fact, owing to design limitation, PCA can’t divide the zenith rings into azimuth segments, unlike DHP (Lang and Xiang 1986). As a consequence, PCA assumes foliage elements were randomly distributed in azimuth (within each ring). However, Ryu et al. (2010a) noticed that for multiple samples, two different averaging methods can be applied to equation (7), namely
) (
lnPθ and lnP(θ), which can provide different LAI estimates. They proposed an apparent clumping index (ΩAPP) as calculated by the ratio of the two averaging gap fraction methods, even though this apparent clumping index considers only between-crowns clumping (namely the distance between two sample measurements). For further details, see chapter 5.
2.4.3 Quantum measures
Incident radiation is both a limiting and basic environmental factor for every organism. The crucial energy for photosynthesis is delivered by the electromagnetic spectrum between 400 and 700 nm, namely the Photosynthetically Active Radiation (PAR). Some part of this radiation is reflected directly by green leaves (roughly 6-12%), some part is absorbed and some is transmitted through the canopy. PAR is a key parameter in several physiological and biomass models (Amiro et al. 2000).
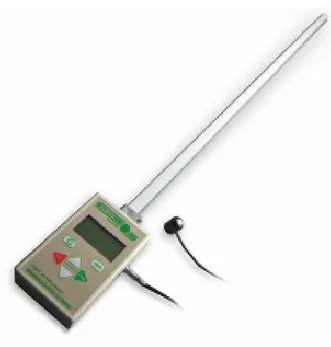
Figure 4 - AccuPAR ceptometer
Various methods have been used to quantify forest light environment and PAR. Ideally, light should be measured continuously in order to sample spatial and temporal variability of the light
environment. However, this is not practical for most research, and methods based on percent incident radiation have gained wide acceptance (Gendron et al. 1998). Among the methods, characterizing the light environment via instantaneous measurement of light transmission on sunny days has been very popular (Comeau et al. 1993, Brown and Parker 1994, Smith and Ritters 1994). By contrast, Messier and Puttonen (1995) proposed to estimate light environments in the understory via instantaneous diffuse light transmission on overcast days.
Instantaneous light measurements can be collected using an accuPAR ceptometer (Figure 4). This instrument consists of line quantum sensor making use of 80 individual sensors on a probe and control units. It strictly measures incident radiation and transmitted PAR (Bréda 2003). LAI is derived from canopy light interception using Equation (3); this approach, defined ‘canopy transmittance’ method (Cutini 1996), requires assumption about the light extinction coefficient (k). The method is based on single zenithal measure, and the theoretical background is similar to that used in DCP, even though clumping effects are not readily available from ceptometer measures (Lang and Xiang 1986).
3. Materials and methods
3.1. Study sites
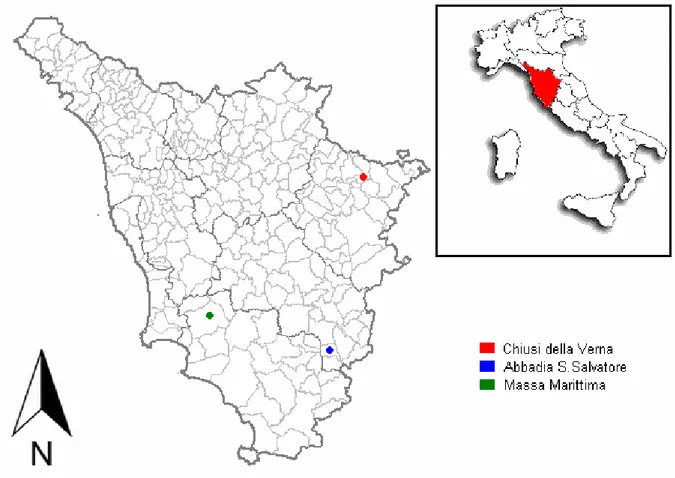
The study was carried out in three different forested areas of Tuscany, central Italy, in order to sample forest stands of the most widespread deciduous species: Turkey oak (Quercus cerris L.), chestnut (Castanea sativa Mill.) and beech (Fagus sylvatica L.), which cover 11.6%, 9.2% and 11.8% of the total forested surface in Italy (Italian National Forest Inventory 2005; www.infc.it), respectively.
In the three forested areas (Figure 5), 10 stands were sampled in 2011 and 11 stands were sampled in 2012. The selected stands were drawn from a network of permanent research plots, which were established in previous studies (see below). Specifically, four stands of Turkey oak were sampled in Massa Marittima (43°08’ N; 10°54’ E), two stands of chestnut were sampled in Abbadia San Salvatore (42°51’ N; 11°40’ E) and four stands of beech and one stand of chestnut were sampled in Chiusi della Verna – Alpe di Catenaia (43° 59’ N; 11°55’ E). Species composition in each stand was pure.
The selected stands of Turkey oak consisted of experimental trials aimed at defining silvicultural option for management of oak coppices; the oak plots were located in Massa Marittima, within the ‘Colline Metallifere’ forested area. The area is an important oak vegetation area, where Turkey oak is the dominant species, but other different deciduous species were also present in minor percentage. In the past, the forested areas were mainly managed as coppices, due to charcoal for mine activity. The area is characterized by mild-Mediterranean climatic conditions. The mean annual rainfall was 906 mm (maximum concentration in autumn and spring), and the mean annual temperature was 14.4°C.
The selected stands of beech consisted of experimental trials aimed at defining management option for the conversion of ageing beech coppices into high forests (Amorini et al. 2009, Cutini et al. 2009). The study area for beech is located in the western slope of Alpe di Catenaia. The area (south-eastern Tuscany) well represents the typical forested ecosystems of central Apennines. Altitude ranged from 330 to 1,414 m a.s.l.. The climate was temperate, with hot and dry summers, and cold and rainy winters. The mean annual rainfall was 1,224 mm, and the mean annual temperature was 9.5°C. Roughly 87% of the mountainous area was covered in forests. Deciduous high forests, aged mainly between 50 – 70 years, were prevalent, while the rest consisted of deciduous coppices. The main species were beech, chestnut and Turkey oak. Additional stand of chestnut was selected within this study area in 2012.
The selected stand of chestnut consisted of experimental trials aimed at defining new management options for chestnut coppices (Amorini et al. 1998, Cutini 2001); the study area for chestnut is located in the eastern slope of Monte Amiata. Monte Amiata (1738 m a.s.l., south-western Tuscany) is an important chestnut vegetation area where, in the past, woods were traditionally coppiced every 8–10 years to obtain poles and posts for mine activity. Climate is mountain-Mediterranean: mean annual rainfall and temperature are, respectively, 1547 mm (maximum concentration in autumn and winter) and 10.0°C (hottest month +18.5°C, coldest month +1.8°C).
All the permanent plots were represented by ageing coppices in conversion into high forest, either by thinning or by natural evolution. When applied, thinning was selective and low; its grade was from light to heavy, with a temporary opening of the canopy cover (Cutini et al. 1998). Accordingly, the selected stands showed differences in age (29-66 years), stocking rate (108 – 4509 individuals ha-1) and basal area (14.7 – 45.3 m2), depending with the different silvicultural treatment applied. All the main stand characteristics of each plot were reported in Table 1.
Table 1 - Main stand characteristics of the studied stands
Species Plot Site Elevation Silvicultural treatment Age Stems Basal area
ID m. a.s.l. years n ha-1 m2 ha-1
Q. cerris
112 Massa Marittima 566 natural evolution 52 4509 30.2
1324 Massa Marittima 568 1 medium thinning 52 3181 33.2
2536 Massa Marittima 589 1 light thinning 52 4198 31.1
3748 Massa Marittima 594 2 medium-heavy thinnings 55 402 21.2
F.sylvatica
TS Chiusi della Verna 1080 seed cutting 67 108 14.7
CONTR Chiusi della Verna 1100 2 medium-heavy thinnings 67 419 34.6
TEST Chiusi della Verna 1050 natural evolution 67 3324 45.3
DIR Chiusi della Verna 1020 3 light-medium thinnings 67 414 23.8
C.sativa
DIR Chiusi della Verna* 940 1 heavy thinning 62 920 37.6
G2D Abbadia S. Salvatore 870 2 medium thinnings 30 580 28.4
G3D Abbadia S. Salvatore 850 3 medium thinnings 30 447 23.9
* Stand added in 2012.
3.2. Field measurements
3.2.1 Direct measurements of LAI
Reference LAI values were directly estimated using litter traps (LAILT; Figure 6). Cutini et al. (1998) described the procedure and accuracy of the method. In each plot, 9–15 litter traps were set out on a grid, at 1 m above ground level, with traps spaced 7–20 m apart, based on the stand homogeneity and structure. Litterfall was collected every 2 weeks in fall and winter 2011 and 2012, with the last collection timed soon after last leaf fall.
Litter was sorted into its main components, and then dried for at least 24 h to a constant weight in a forced-air stove at 85°C ± 2° (Cutini et al. 1998). This method provides leaf dry mass per unit of ground area (g m−2). Specific leaf area (SLA; cm2 g−1) was estimated from a sub-sample of about 200 leaves for each stand, with samples collected at every litterfall. The area of unwrinkled and undamaged leaves was measured with the Li-Cor 3000 area meter (Licor, Lincoln Inc., NE, USA), and the dry weight was measured.
The resulting SLA was corrected using a shrinkage coefficient (Vansereven 1969), which was estimated from a sub-sample of green leaves collected close to the research plots. Finally, the total dry mass of leaves collected was converted into LAILT by multiplication of the dry weight by the corrected SLA.
3.2.2 Direct measurements of canopy transmittance
Canopy transmitted light in the PAR waveband was measured during summer using AccuPAR ceptometer (Decagon Devices, Pullman, WA, USA). Instantaneous measurements of direct light were collected in summer 2011 and 2012 at midday on sunny days. Instantaneous diffuse light transmission was also measured close to sunrise or sunset in summer 2012, in order to measure different light components. Incident radiation was measured in open areas, which were located in the vicinity of the experimental plots. Below-canopy radiation was measured on a grid of 9–15 sample points, which were located within 2 m of the litter traps (Cutini 1996). For each sample point, four measurements at cardinal directions were recorded, averaged and stored in the instruments, for a total of 36–60 readings per plot. Transmittance was calculated as the percent fraction of below-canopy light divided by the incident radiation.
3.2.3 Estimates of canopy properties using digital photography
3.2.3.1 Camera setup, image acquisition and pre-processing of images
Digital images were first collected using the Nikon Coolpix 4500 compact camera (Figure 7); this is mainly desirable because the Nikon CoolPix models have been very popular in forest ecology, and the performance of these cameras have been deeply investigated (Leblanc et al. 2005, Zhang et al. 2005, Macfarlane et al. 2007c) . For instance, Frazer et al. (2001) compared film photography with the 2.1 Megapixel Coolpix 950; Inoue et al. (2004) compared the effect of quality and image size in two different Coolpix models (990 vs 900); Leblanc et al. (2005) used both
using the Coolpix 950. These researchers found that little or no differences exists between TIFF and JPEG images from the same camera, but that image size can influence canopy properties estimates.
Figure 7 - Nikon Coolpix 4500 equipped with FC-E8 fisheye lens converter
Recently, DSLR (Digital single lens reflex) cameras have become much more affordable and their resolution has increased greatly, but thorough appraisals using DSLR cameras are still poorly documented (Pekin and Macfarlane 2009). This section solely refers to Coolpix compact camera setup; however, a comparison between compact (point and shoot) and DSLR cameras was performed in the chapter (6) of the study.
All images were collected as ‘FINE’ quality and at maximum resolution JPEG. Photographs were taken at a height of 1.5 m, on a grid of sample points, which were located near the littertraps. Images were collected between June and August 2011 and 2012. In each plot, 15-25 cover images (DCP) and 9-15 fisheye images (DHP) were collected, according to the stand density and structure.
Fisheye images (DHP) were collected close to sunrise (or sunset) under uniform sky conditions. The Coolpix 4500 was equipped with a FC-E8 fisheye lens converter, and was set to F1; the lens was aligned to magnetic north and pointed upward using a self-levelling tripod. The aperture was set to the minimum (F 5.3) and with the camera in aperture-priority (A) mode; the exposure was metered in an adjacent clearing. Subsequently, the mode was changed to manual (M) and the shutter speed was lowered by two stops in comparison to the exposure metered in the clearing. To investigate the influence of camera exposure on the accuracy of gap fraction from DHP, different exposure were also collected, by setting an exposure bracketing, respectively of
+1,+2,+3,+4 stops, relative to the open sky reference measured in an adjacent clearing (0). 57.5 degree images were derived from fisheye images.
Unlike fisheye imagery, DCP uses a narrow field of view (about 30°); the method does not require a fisheye converter and exposure is automatically set. Cover images were collected during the morning under uniform sky conditions. The camera was set to F2, aperture-priority mode (A) and minimum aperture (F 9.6). The fixed lens was pointed upward using a self-levelling tripod.
Cover images were then analyzed in colour using the freeware GIMP 2.6 (GNU image manipulation program; www.gimp.org). Large gaps (gL) between tree crowns were selected using the ‘fuzzy’ tool, and the total number of relative pixels was recorded from the histogram. All gaps were then selected using the ‘select by color’ tool, and the relative number of pixels within each gap (gT) was recorded from the histogram.
3.2.4 Comparison of LAI 2000 PCA and AccuPAR ceptometer
The LAI-2000 PCA measurements were performed in each plot between June and August 2011 and 2012, just after dawn or close to sunset, under uniform sky conditions. One above-canopy reference measurement for each plot was recorded in clearings near each study area. The fisheye lens of the instrument was covered by a 90° view cap to avoid the influence of surrounding trees on the reference measurements (Cutini et al. 1998). Nine to 15 below-canopy measurements were recorded within each plot at the same grid points used for photography. From the raw data recorded by the instrument, LAI was calculated with (LAI C) and without (LAI NC) correction for clumping (see section 5 for major details). An apparent clumping index (ΩAPP) was calculated as the ratio of LAI NC to LAI C, even though clumping is considered above the shoot scale (between-crowns).
LAI was also estimated from transmitted light values measured with AccuPAR ceptometers, making use of the Beer-Lambert’s law (Bolstad and Gower, 1990; Cutini, 1996; Pierce and Running, 1988). This procedure needs a light extinction coefficient (k), which in this study was assumed to be k = 0.50 (spherical distribution), because of the difficulty of directly measuring k.
4.
Estimation of canopy properties in deciduous forests with
digital photography
4.1 Methods
4.1.1 Software image analysis
The gamma function of all fisheye and 57.5 degree images was corrected to 1.0 using Irfanview 3.95 before conducting hemispherical software image analysis. To assess the effect of the camera’s gamma function on gap fraction and LAI retrieval, non-corrected hemispherical and 57.5 degree images (gamma= 2.2) were also processed. Fisheye (DHP) and 57.5 degree images were then analyzed using Winscanopy 2012a (Regent Instruments, Ste-Foy, Quebec, Canada). The blue channel of each image was used for processing. This is manly desirable because in the blue band of the electromagnetic spectrum, the foliage appears darker than in the other bands, thus minimizing the interference of multiple scattering in the canopy and chromatic aberration (Zhang et al. 2005). In addition, in diffuse sky conditions –namely the sky condition being considered in DHP - sky is saturated in the blue band, and thus appears white in 8-bit blue channel (Leblanc 2008), thereby improving thresholding procedures.
Fisheye images were also sharpened (medium), to enhance the contrast between sky and non sky elements. The hemisphere of each image was divided into 7 zenith angle rings and 8 azimuth segments. The zenithal angle range used for the analyses was 0-70°.
Among the outputs, canopy openness, LAI, mean leaf inclination angle and foliage clumping were derived. LAI without correction for clumping (LAI NC) was calculated by averaging the generalized LAI-2000 method (Welles and Norman 1991) and the ellipsoidal LAI method (Campbell 1986), for unmodified gap fraction data for each image (non segmented method). The ellipsoidal LAI method (Campbell 1986) was also used to calculate the mean leaf inclination angle.
LAI corrected for clumping was calculated in three different ways: first, LAI was corrected using the Lang and Xiang (1986) method, obtained by averaging the generalized LAI-2000 method and the ellipsoidal LAI method, considering the logarithm of gap fraction calculated for each azimuth segment, and the resulting log transformed gap fraction data for each image (segmented method; Lang and Xiang 1986). Further details on how gap fraction and clumping were computed using both non segmented and segmented methods were provided in chapter 5.The gap fraction distribution was also corrected for foliage clumping using the gap size distribution method (Chen and Cihlar 1995; Leblanc 2002) or by combining the gap fraction distribution and the gap size
distribution approaches (Leblanc 2005). Based on previous visual inspections, gaps larger than 500 pixels were classified as large gaps and not included in the calculation of crown porosity from DHP (the within-crown gap fraction to which Beer-Lambert’s law is applied). The Lang and Xiang (1986) correction was abbreviated as LX, the Chen and Cihlar method (1995) as CC and the combined method (Leblanc et al. 2005) as CLX.
Estimates of woody materials were obtained by collecting and analyzing fisheye images during leafless; results indicated that woody area index averaged 0.71 ± 0.05 in beech, averaged 0.39 ± 0.01 in Turkey oak, averaged 0.38 ± 0.01 in chestnut. However, woody materials were not included in statistical analysis, assuming that leaves tend to present themselves to obscure underlying stems from sun (Kucharik et al. 1998). In doing so, LAI estimates from digital photography are equivalent to Plant Area Index (Bréda 2003).
The percent fraction of direct, relative and total transmittance (respectively the direct, indirect, and total site factor outputs, multiplied by 100) was also estimated from DHP, under the assumption of a standard overcast sky model (Anderson, 1966).
The blue channel of fisheye images was also analyzed with the freeware Gap Light Analyzer 2.0 (GLA; Frazer et al. 1999). Since pixel classification between sky and canopy (thresholding) in GLA was performed manually, while it is automatically determined in Winscanopy, the latter automatic threshold for both software analyses was used, to avoid subjectivity (Jarčuška et al. 2010). LAI (NC) was considered to be the LAI 5 ring output result. Also, the percent transmittance (% transmittance direct, diffuse and total outputs) was estimated, under the assumption of a standard overcast sky model.
57.5 degree photography was derived from fisheye photography using Winscanopy software. From 57.5° view angle, LAI NC and LAI LX was assumed to be LAI derived using unmodified gap fraction data (non segmented method) and log-transformed gap fraction data (segmented method), respectively. LAI CC and LAI CLX were also derived from 57.5 degree photography. For simplicity, even in this case the contribution of woody elements in leaf area calculations was neglected. Anyway, WAI estimates obtained during leafless indicates the large contribution of woody elements at 57.5 zenith angle: woody area index averaged 2.03 ± 0.55 in beech, averaged 0.70 ± 0.06 in Turkey oak, and averaged 1.27 ± 0.06 in chestnut.
Cover images (DCP) were analyzed in colour using the freeware GIMP 2.6 (GNU image manipulation program; www.gimp.org). The number of pixels contained in large gaps as well as in total gaps was used to estimate crown cover (fc, equation 8), foliage cover (ff, equation 9), porosity (φ, equation 10) as described by Macfarlane et al. (2007c):
1704 2272 1 x g f L c = − (8) 1704 2272 1 x g f T f = − (9) c f f f − = 1 φ (10)
Since, the gap removal procedure was also automated in Winscanopy (since 2006a version), another objective was to compare the performance of manual and automated classification procedures. Among the outputs, the method provided LAI, with either Chen and Cihlar (1995) correction for clumping (LAI CC, equation 11) or without correction (LAI NC, equation 12) and making use of a modified Beer-Lambert law:
k f CC LAI⋅ =− c ln(φ) (11) k f NC LAI⋅ =−ln(1− f) (12)
The contribution of woody elements was assumed not significant at the narrow and vertical zenith angle used in DCP. The clumping index at the zenith was calculated as (Ω0, Equation 13):
f f f f ) ln( ) 1 ln( ) 1 ( 0
φ
φ
− − = Ω (13)However, DCP needs a zenithal light extinction coefficient (k) to calculate LAI. Measures of zenithal extinction coefficients are challenging to obtain (Ryu et al. 2010b); also, k for DCP has been accurately evaluated only for Eucalyptus spp. (Macfarlane et al. 2007a, 2007b). Because measuring k is difficult, a spherical leaf angle distribution was first assumed (zenithal extinction coefficient of 0.50). However, a calculated k was obtained by combining direct measurements of LAI by the litterfall method (LAILT) with measurements of crown cover and porosity from DCP (Equation 14), to verify the spherical distribution assumption:
LT c LAI f k =− ln(
φ
) (14)4.1.2 Statistical analyses
The output results from both fisheye and non-fisheye imagery were first compared with the reference methods, to evaluate the accuracy of the digital photography methods. LAILT was compared with digital photography output results by analyzing the root mean-squared error (RMSE). Methods with a small RMSE were then compared using reduced major axis (RMA) regression because the assumption that measurement errors were similar in both the direct and indirect methods (Warton et al. 2006). The RMSE of the other indirect methods commonly used for estimating LAI (LAI-2000 PCA and canopy transmittance methods) was also analyzed, to evaluate the performance of the different methods in relation to digital photography. Also, the transmittance estimated with the AccuPAR ceptometer with DHP output results were compared by fitting RMA regression lines.
All statistical analyses were performed using R version 2.13.1 (R Development Core Team, 2011), with the lmodel2 package uploaded.
4.2 Results
The studied stands were characterized by dense canopy cover with different attributes, as a consequence of the different silvicultural treatment applied (Table 2). Leaf litter ranged from 2.910 to 4.200 Mg ha-1 in beech, from 2.091 to 4.030 Mg ha-1 in Turkey oak, and from 2.865 to 3.555 Mg ha-1 in chestnut. LAILT ranged from to 2.6 to 8.1, with a coefficient of variation of 29.3 %. More specifically, LAILT averaged 6.9 ± 0.5 m2 m-2 in beech, averaged 4.0 ± 0.4 m2 m-2 in Turkey oak, and averaged 5.0 ± 0.2 m2 m-2 in chestnut. Transmittance values ranged from 0.3% to 18.5% when measured in sunny conditions, while they ranged from 0.7% to 29.4% when measured in overcast sky conditions, with a coefficient of variation of 71.2% and 69.4 %, respectively.
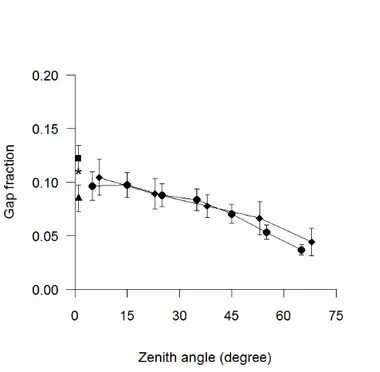
The gap fraction obtained from fisheye images, cover images and LAI-2000 PCA were similar, although cover photography provided slightly larger gap fraction at the zenith (Figure 8). Gap fraction obtained from AccuPAR in diffuse sky conditions was similar to that obtained with DCP. By contrast, gap fraction measured with AccuPAR in sunny conditions was noticeably lower than those obtained with the other methods (Figure 8).
Table 2 Main stand characteristics of the studied stands 2011 2012 2011 2012 2011 2012 2011 2012 Species Turkey oak 3,604 2,175 140,40 125,54 4,44 2,94 6,20 18,47 Turkey oak 3,312 2,091 146,81 109,34 3,91 2,62 8,21 16,65 Turkey oak 3,968 2,581 160,73 134,39 4,78 3,99 8,05 18,21 Turkey oak 4,030 3,232 167,32 136,11 4,44 4,89 7,34 14,62 beech 2,910 3,114 160,73 157,09 5,16 5,45 11,56 3,72 beech 3,941 4,200 167,32 167,71 7,34 7,52 1,63 0,56 beech 3,854 3,627 169,81 195,32 7,14 8,09 4,26 0,34 beech 3,259 4,062 190,76 182,50 6,66 7,92 3,14 0,61 chestnut 3,236 3,555 140,40 146,00 4,83 5,52 8,92 11,78 chestnut 2,856 3,098 146,81 146,54 4,46 4,83 6,72 6,88 chestnut - 3,163 - 156,29 - 5,26 - 7,11 LAILT (m 2 m-2) Transmittance* (%)
Leaf litter (Mg ha-1) SLA (cm2 g-1)
* transmittance values refer to those measured in sunny conditions.
Photographic exposure influences the magnitude of gap fraction in DHP (Figure 9). Gap fraction increased as camera exposure increased; conversely, LAI decreased with the increase in exposure. As the relative exposure increases from 0 (open sky reference) to +1, +2, +3, +4, the gap fraction increases by 186, 313, 488 and 772%, respectively.
Figure 8 - Gap fraction vs zenith angle calculated from DHP (circles) and PCA (diamonds). Gap fraction near the
zenith are also showed for DCP (square) and AccuPAR, either measured in sunny conditions (triangle) or in overcast sky conditions (asterisk). Standard errors are reported. To improve readability, the standard errors are not showed for AccuPAR measured in overcast sky conditions.
Figure 9 - Variation of gap fraction with camera exposure in DHP. The relative exposure 0 refers to the sky reference.
From DCP, crown cover, foliage cover and crown porosity ranged from 0.86 to 0.99 (average 0.93 ± 0.01), 0.78 to 0.96 (average 0.88 ± 0.01) and 0.03 to 0.13 (average 0.06 ± 0.005), respectively. Cover increased as LAILT increased, while crown porosity decreased (Figure 10). Compared on a sub-sample of cover images, a good agreement was found between crown cover estimates using either automatic or manual classification (fcAUTOMATIC = 0.89 fcMANUAL+0.11, R2=0.99, n= 52, p<0.05). By contrast, manual classification provided significantly lower estimates of crown porosity, as compared with automated procedure (ΦAUTOMATIC = 0.26 ΦMANUAL + 0.01, R2=0.53, n=52, p=0.16), even though the difference did not significantly affect Ω0 nor LAI estimated from the two procedures (data not shown).
The zenithal clumping index from DCP (Ω0) averaged 0.81 ± 0.02; ΩLX, ΩCC and ΩCLX from DHP averaged 0.86 ± 0.01, 0.93 ± 0.01 and 0.80 ± 0.02, respectively. ΩLX, ΩCC and ΩCLX from 57.5 averaged 0.82 ± 0.01, 0.93 ± 0.01 and 0.76 ± 0.02, respectively. All the clumping indexes increased with increasing LAILT (Figure 10 and Figure 11); moreover, all the clumping indexes were significantly correlated (Pearson’s r, p < 0.05). The apparent clumping index from PCA averaged 0.94 ± 0.01, which indicated little between-crowns clumping effect.
The zenithal extinction coefficient calculated from DCP and LAILT (Equation 14) averaged 0.53 ± 0.03 and agreed closely to a spherical distribution assumption (k0 = 0.50). However, the k values appeared sensitive to canopy density and decreased as LAILT increased (Figure 10). Moreover, there was significant effect of species on calculated k (ANCOVA, p < 0.001). The
Figure 10 - Foliage cover (filled circles), crown cover (empty circles), crown porosity (squares), zenithal extinction
coefficient (triangles), zenithal clumping index (diamonds) from DCP vs LAILT from the litterfall method.
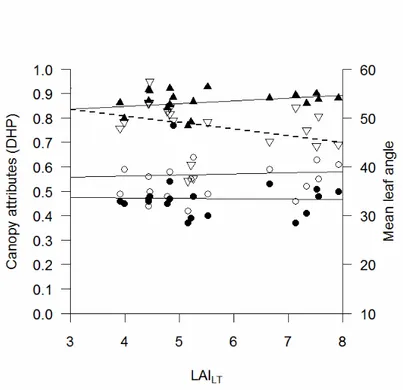
Figure 11 Foliage projection coefficient, averaged for all zenith angles (filled circles), zenithal extinction coefficient (empty circles), ΩLX (filled triangles), mean leaf angle (open triangles) from DHP vs LAILT. To improve readability,
only the outputs calculated after correction for clumping and only the LX clumping index were drawn; also, the dashed lines indicated the mean leaf angle trend.
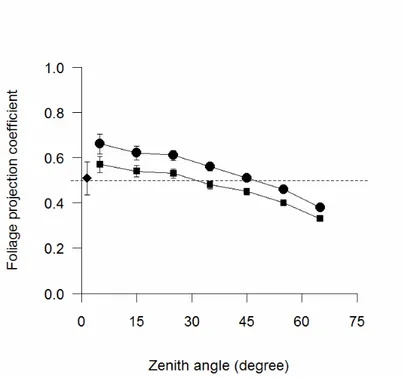
The foliage projection coefficient (G(θ)) calculated from DHP even showed an approximately spherical leaf angle distribution, at least for zenith angle up to 30°, in particular when correction for clumping (LX) was applied (Figure 12). Both G(θ) (averaged for all zenith angles) and mean leaf angle decreased as LAILT increased, but k near the zenith increased (Figure 11). The G(57.5) showed a more vertical leaf angle compared to the spherical assumption made in 57.5 photography, in particular when correction for clumping was applied (G57.5~0.40). There was no effect of species on both G(θ) and k from DHP (ANCOVA).
Figure 12 - Foliage projection coefficient vs zenith angle before (circles) and after (squares) LX correction for
clumping from DHP. The dashed line represents the spherical leaf angle distribution. Foliage projection coefficient near the zenith is also presented from DCP (diamond). Standard errors are reported.
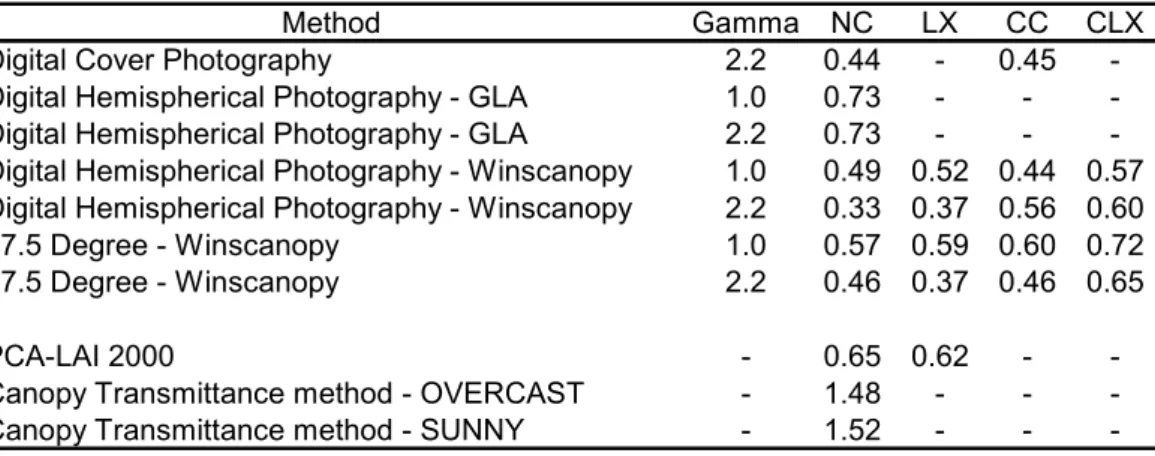
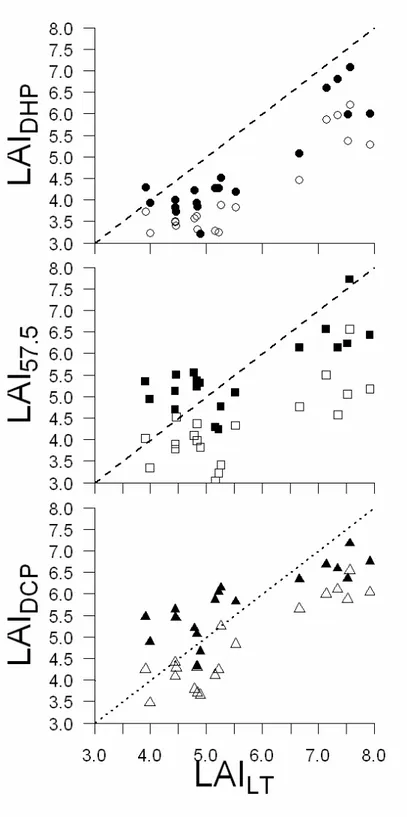
With regard to LAI, similar RMSE were obtained from fisheye images using Winscanopy, regardless of whether the images were gamma corrected or not, and regardless of which clumping correction (if any) was applied (Table 3). Similar RMSE values were also obtained from DCP, regardless of whether clumping correction was applied. Small RMSE values were obtained from 57.5 degree images without gamma correction. Overall, the CLX correction for clumping produced poorer results than the other two clumping indexes. Poor results were also obtained from fisheye images using GLA software and using LAI-2000 PCA. Worse results were obtained with canopy transmittance method (Table 3).
Methods in which the RMSE was equal or below to 0.6 were further analyzed using RMA regression (Table 4). On the basis of the RMA regression results, the DHP method outperformed the DCP method, because the slopes were closer to unity and the intercepts were closer to zero than