2
Content
List of Figures 6 List of Tables 7 Abstract 8 Abstract 10 Chapter 1 12 Introduction 12 1.1 Environmental problems 12 1.2 UAV systems 131.3 Advantages and limitations in the use of UAVs 14
1.4 UAV-based photogrammetry 15 1.5 Research goals 15 1.6 Outline 16 Chapter 2 17 Photogrammetry 17 2.1 Introduction 17 2.2 Historical background 17 2.3 Photogrammetry 19
2.4 Basic principle of photogrammetry 20
Chapter 3 22
UAV systems 22
3.1 Introduction 22
3.2 Historical background and applications 22
3.3 Regulation 23
3.4 UAVs classification 25
3.5 Aircraft configuration used in the two case study 27
Chapter 4 29
Workflow for processing UAV data 29
3
4.2 Workflow 29
4.3 Data acquisition 30
4.4 Image analysis 35
4.4.1 3D modelling software overview 39
4.5 Final products and applications 39
Chapter 5 41
Case study 1: UAVs and photogrammetric technique for detecting copper contaminated soils 41
5.1 Introduction 41
5.2 Material and methods 44
5.2.1 Area of interest 44
5.2.2 Landform mapping 45
5.2.3 Modelling of the transport process 47
5.2.4 Indices for wetlands prediction 47
5.2.5 Detection of copper contaminated areas and model validation 48
5.3 Results 50
5.3.1 Copper concentration in soil samples 50
5.3.2 Landform mapping 51
5.3.3 Modelling of the transport process and wetland prediction indices 51 5.3.4 Detection of copper contaminated areas and model validation 53
5.4 Discussion 55
5.5 Conclusions 57
Chapter 6 58
Case study 2: Estimating biochemical and physical grassland traits from UAV acquired
hyperspectral images 58
6.1 Introduction 58
6.2 Materials and method 60
6.2.1 Area of interest 60
6.2.2 Hyperspectral and field data collection 62
6.2.3. The Narrow-Band Vegetation Indices 63
6.2.4. Partial Least Squares Regression (PLSR) 64
6.3 Results 66
6.3.1 Grassland traits 66
6.3.2 Hyperspectral data 70
6.3.3 Narrow-Band Vegetation Indices 71
6.3.4 Partial Least Squares Regression (PLSR) 75
6.4 Discussion 78
6.5 Conclusions 80
Chapter 7 82
4
Publications 85
5 The difference between a toy and a tool is the value that users can create with it.
6
List of Figures
Figure 3.1 - The Tarot 690s UAV 27
Figure 3.2 - octocopter UAV, Aerialtronics Altura AT8 v1A equipped with all essential tools 28
Figure 4.1 - Workflow for UAV data processing 28
Figure 4.2 - Description of data acquisition procedure 28
Figure 4.3 - Camera calibration 29
Figure 4.4 - Radial and decentering distortion profile for a digital camera set at different focal length. 30
Figure 4.5 - Steps of target preparation and final result 33
Figure 4.6 - Image analysis workflow 34
Figure 5.1 - Area of interest 42
Figure 5.2 - The Tarot FY690s drone equipped with all essential hardware elements and software tools 43
Figure 5.3 - Three flight missions 44
Figure 5.4 - Cu concentrations classified in category (mg/Kg) over the generated orthophoto 48
Figure 5.5 - Cu interpolated map using Indicator Kriging 48
Figure 5.6 - Digital Elevaton Model (DEM) 49
Figura 5.7 - Micro-basins 52
Figure 5.8 - Topographic Index map 51
Figure 5.9 - Clima Topographic Index map 51
Figure 5.10 - Actual map of copper concentration on interpolated map of T 52
Figure 5.11 - Actual map of copper concentration on interpolated map of CTI 52
Figure 5.12 - Boolean And operation between interpolated copper concentration and interpolated TI 53
Figure 5.13 - Boolean And operation between interpolated copper concentration and interpolated CTI 53
Figure 6.1 - Area of interest 59
Figure 6.2 - Distribution of the type and amount fertilizer 59
Figure 6.3 - Influence of the type and the amount of fertilizer treatment on grassland traits and their standard
deviations 67
Figure 6.4 Average and standard deviation of the spectra for the three different levels of organic fertilization (170, 230,
and 340 kgN/ha) for May and October harvest. 68
Figure 6.5 - Correlogram between spectral variables of the hyperspectral dataset and grassland traits for the May
harvest. 69
Figure 6.6 - Scatterplot related to the influence of the type and the amount of fertilizer on selected narrow-band
vegetation indices 70
Figure 6.7 - Scatterplot of the best relationships between selected grassland traits and vegetation indices for the
integrated dataset of May and October, except the metabolic energy, for which the best result was found instead in the
integrated May dataset. 72
Figure 6.8 - Height variation within plots by applying the NDRE index on the acquired hyperspectral dataset of May.72 Figure 6.9 – Metabolic energy variation within plots by applying the CIrededge index on the acquired hyperspectral
dataset of May. 73
Figure 6.10 - Scatterplot of the measured vs. predicted values for the best PLSR models presented for the integrated
dataset of May and October 74
Figure 6.11 - PLSR coefficients for height, fresh matter yield, crude protein, and metabolic energy for the PLSR model
7
List of Tables
Table 3.1 – Photogrammetric UAV systems categorization (source: Eisenbeiss, 2009) ... 25
Table 3.2 - Evaluation of UAVs traits ... 26
Table 6.1 - Selected vegetation indices... 62
Table 6.2 - Pearson coefficient of structural and biochemical traits ... 65
Table 6.3 - Summery statistics of the grassland traits for the May harvest ... 66
Table 6.4 - Summery statistics of the grassland traits for the October harvest ... 66
Table 6.5 Significance level obtained by applying the t-test between organic and inorganic treatments in May, October, and between May and October data ... 67
Table 6.6- Results of linear regression models between the selected narrow-band vegetation indices and grassland traits for the integrated sub-datasets of May and October and the sub-dataset of May. ... 731
8
Abstract
Nel corso degli anni, purtroppo, la terra è stata caratterizzata dal susseguirsi da numerosi disastri ambientali, sia naturali che dovuti alle attività dell’uomo. Questi hanno comportato e comportano un’alterazione dell’equilibrio dell’ecosistema e danni alla salute umana. Il termine problema ambientale è comunemente usato per definire gli atti che danneggiano flora, fauna e genere umano. Da ciò si comprende la necessità fondamentale di mettere a punto delle tecniche in grado da un lato di determinare le caratteristiche e l’entità di tali problematiche, e dell’altro di monitorarle nel tempo. Nel corso dell’attività di ricerca del corrente dottorato due diversi problemi ambientali sono stati affrontati. Il primo incentrato sullo sviluppo di una tecnica innovativa per l’individuazione dei terreni inquinati da rame, ed il secondo, invece, relativo alla scelta del metodo migliore per poter stimare le proprietà strutturali e biochimiche dell’ecosistema grassland.
La presenza dei contaminati nei suoli agricoli rappresenta una delle maggiori criticità ambientali del territorio italiano in generale e della regione Campania in particolare. Quest’ultima, da sempre nota per la bellezza dei suoi paesaggi, si è ritrovata al centro dell’attenzione mediatica a causa della presenza di ben 6 dei 55 siti di interesse nazionale. Infatti, gli inquinanti presenti nei terreni agricoli danneggiano la qualità del cibo e, di conseguenza, la sicurezza della salute umana. Infatti, a seconda del tipo di contaminante, gli effetti sulla salute umana sono sostanzialmente differenti e, di conseguenza, è fondamentale conoscere la loro reale distribuzione e la loro concentrazione. Al fine di sviluppare una tecnica innovativa, in grado di sostituire la metodica correntemente utilizzata per l’individuazione degli inquinanti, si è scelto di fondere tecniche comunemente applicate in altri settori e a scale differenti e di trasferirle a scala di campo e in tale settore di ricerca. Infatti, la tecnica proposta si base sulla fotogrammetria aerea da UAV, sugli indici per la predizione delle zone umide e sulla geostatistica. Al fine di validare tale metodo, il campo sperimentale nell’area di Trentola Ducenta, appartenente al SIN agro-aversano, è stato scelto come campo test. Tale area è stata campionata con una maglia regolare 5*5 m e, per ogni campione, la è stata analizzata concentrazione del rame.
Confrontando la mappa della reale distribuzione del rame con quella predetta mediante l’applicazione del metodo suddetto, si evince che ben 5 aree, caratterizzate da una concentrazione superiore ai limiti di legge, su 7 sono state predette dal metodo. Di conseguenza, i risultati risultano promettenti, anche se, prima che quest’ultima possa entrare a pieno titolo nell’organizzazione dell’attività di campionamento è necessario che venga sperimentata su campi di altre dimensioni e localizzati in altre aree.
9 L’ecosistema grassland, invece, è stato scelto in quanto esso ricopre circa il 40% della superficie terrestre e perché le sue caratteristiche risentono fortemente della posizione geografica e delle attività umane. Pertanto, lo sviluppo di una metodica in grado di ottimizzare i piani di gestione di tale ecosistema, fino ad ora organizzate sulla base dell’esperienza dei contadini, con informazioni quantitative sembra fondamentale per migliorare il suo stato di salute e per l’individuazione del punto ottimale di raccolta o di concimazione. L’obiettivo di tale applicazione è quello di testare i diversi metodi statistici al fine di individuare quello più performante nella stima delle caratteristiche strutturali e biochimiche della grassland dalle immagini iperspettrali acquisite da UAV.
Ambo i metodi confrontati, gli indici vegetativi e il PLSR, presentano dei risultati promettenti anche se il più performante è il PLSR. Anche in questo caso, come in quello precedente, per poter affermare la validità universale di tale tecnica sono necessarie ulteriori sperimentazioni.
Gli esempi esplorati hanno permesso quindi di confermare gli enormi vantaggi introdotti dall’uso della fotogrammetria aerea da drone nell’ambito del monitoraggio ambientale e nel settore dell’agricoltura di precisione, nonché di introdurre delle tecniche innovative in grado di migliorare le metodiche attualmente adoperate.
10
Abstract
Currently, the earth surface is damaged by natural disaster and any human activities, that causes seriously problems to the well-being of humans and the balance of our ecosystem. Therefore, in order to conserve the human health and protect the environment, the detection and the monitoring of the environmental problems are necessary. In particular, two different examples of environmental problems are explored. The first is focused on the development of an innovative method for detecting copper contaminated soils while the second is related to the choice of the best statistical method for estimating grassland traits in order to conserve the different grassland ecosystems.
The knowledge of pollutants concentration and distribution should be a priority for the community since they strongly affect the human health. Indeed, the pollutants presented in soils are commonly absorbed by crops that are usually eaten by human. The health problems are different according to the pollutant taken into account (Oliver, 1997; Muchuweti et al., 2006). This problem has been selected because it is one of the most widespread Italian criticality, due to the combination of geogenic and anthropogenic elements (Cicchella et al., 2005). The heterogeneity of Italian territory has generated an extremely diverse and complex situation (Vito et al., 2009), whereby also difficult to detect. Indeed, Campania region, known for the beauty of its territory, is currently involved in the area with more environmental problems since 6 of the 55 sites of national interest (NIPS) have been selected in this area. For this reason, it is essential to develop a new technique able to replace the method commonly used to detect pollutants accumulated in agricultural soils too expensive and time consumive. Thus, in the present work, approaches commonly applied in other research sectors and at other scales have been merged and transferred to field scale in order to predict copper accumulation in agricultural soils. The proposed technique is based on photogrammetry using UAVs, the indices for predicting wetland and geostatistics. In addition, to validate this method, an experimental field in Trentola Ducenta, in NIPS Agro-Aversano, has been selected as test field. So, in order to know the amount of the pollutants in the soil, the field was sampled using a regular grid of 5*5 m.
By comparing the map of the real distribution of copper and the map of predicted values, it is clear that 5 areas on 7, characterized by a value greater than legal limit, were identified. Consequently, the results of the method appear promising and the information extracted from this method have to be integrated in the sampling activity.
11 Grassland ecosystem has been selected because it covers 40% of the earth surface and because its features are affected by the geographical position and human activities. Therefore, it is required the development of a new grassland management plans able to integrate the qualitative information, due to farmers experience, with the quantitative data. Thus, the goal of this method is to test the different statistical approaches and identify the most performant approach for predicting the structural and biochemical grassland traits from hyperspectral images acquired by UAVs. Both tested methods show promising results, even if PLSR is the best.
The explored examples show a lot of advantages introduced by photogrammetric technique from UAVs in the field of environmental monitoring and precision agriculture supporting.
12
Chapter 1
Introduction
1.1 Environmental problems
Nowadays, the environment suffer from natural disaster and any human activities, that result in changes in the habitat, greatly damaging the well-being of humans and the balance of our ecosystem. This means that only when a problem endangers flora and fauna enough to ruin the balance of the ecosystem, it can be defined as an environmental problem. Thus, to not damage the human health, protect and preserve the environmental wellbeing, the activities of detection of the problem features and monitoring are essential. In particular, in the current study, two different examples, the first related to the pollution detection and the second focused on the grassland ecosystem conservation, have been selected and analyzed.
Detection of contaminated sites and knowledge of pollutants concentration should be a priority since, both by means of crops and air, they compromise environmental and human health. Generally, the contaminants accumulated in agricultural soils are absorbed by crops and, consequently, they get in touch with human body, causing serious health problems (Oliver, 1997; Muchuweti et al., 2006). In addition, among the several environmental problems, this topic has been selected also because it is one of the most widespread Italian criticality, due to both geogenic elements and anthropogenic factors (Cicchella et al., 2005). The diversity of the contributing factors has generated an extremely heterogeneous and complex situation on the Italian territory (Vito et al., 2009), whereby also difficult to tackle. Although the distribution of geogenic pollutants is essentially known and predictable, the mapping of anthropogenic elements is difficulty cognizable, if not applying laborious and expensive procedures. Therefore, priority of the Italian government should be the development of the new methodology, able to detect the contaminated soils, reducing the time – consuming and the operation costs. The introduction of the new technologies, such as drones and small RGB cameras that can be mounted on them, has allowed to significantly improve the landform mapping and, consequently, to obtain more precise information regarding earth surface. Therefore, their application could result essential in pollutants detection.
13 The other environmental problem considered in the current research activity has been selected in the field of precision agriculture. The term precision agriculture (PA) is related to farming management and is based on the measurements and observations regarding crop traits, in order to identify the best plan for its conservation and improve its health status. Among the different type of crops, grassland has been chosen since it covers roughly 40% of the total world (Whie et al., 2000) and, consequently, its traits are completely different according to topographic location, extension and in particular, to anthropogenic effects, like fertilization treatments. In addition, up until now, the grassland schedule is organized on the base of qualitative information, resulting to farmers experience. Surely, in order to identify the best strategy and adapt it to the grassland ecosystem features is required to integrate the already existing plans with the quantitative data, obtaining by spatial observations. These variables can be implemented thanks to the development of new sensors and technologies, such as Unmanned Aerial Vehicles (UAV) and hyperspectral cameras that can be mounted on them.
1.2 UAV systems
The term “Unmanned Aerial Vehicles” (UAV) is used to describe the remotely controlled, semi-autonomous or autonomous vehicles. Its most significant characteristic is the absence of the pilot. However, this do not imply that it flies itself autonomously, because, the people responsible for a UAV are several, such as the pilot, the operator and backup pilot, and more than that aircraft.
Firstly, they were built and applied for military purposes, and only, in the last few years, they has become widespread also in other field of investigation, like the civil one or scientific disciplines, thanks to their features and the possibility to mount on it several kind of sensors, (Nex & Remondino, 2014). For these reasons, the development of instrumentations, suitable to be mounted on them is becoming more and more important over the years. The evolution has interested both technical electronic tools for aerial platforms and sensors that can be mounted on them. In particular, the evolution of the integrated circuits and radio-controlled systems has allowed to reach difficult to access areas, since no pilot is on them, and to reduce the flight altitude, compared to traditional aircraft, incrementing, consequently, the spatial resolution. Additionally, it is possible to acquire aerial images in flexible data, eliminating cloud cover problems.
Moreover, the size and the weight of sensors used for capturing aerial photos have been modified in order to adapt them to UAV size. Indeed, big UAV can be equipped with very heavy weights, otherwise the weight must be reduced. Also the introduction of small digital multispectral
14 sensors has allows to extend the field under investigation to grassland monitoring. Indeed, several studies (Von Bueren et al., 2015) have shown the limitations of RGB cameras and the superiority of multispectral sensors in grassland traits estimation. Subsequently, Sakamoto et al., (2012) has showed that there is a good relationship between vegetation indices, calculated from multispectral images, and grassland bio-chemical variables, able to investigate temporal changes and monitor crop growth. This has allowed the miniaturization of hyperspectral sensors and their application on UAV. The combination of UAV platforms with small RGB cameras or (and) hyperspectal sensors has improved the results in supporting precision agriculture and monitoring environmental problems.
1.3 Advantages and limitations in the use of UAVs
UAV platforms have several advantages compared to the traditional aircraft. First of all, it allows to completely eliminate risks for the pilot, since the vehicles haven’t a sitting place for him, but they are remotely controlled, semi-autonomously, or autonomously driven (Eisenbeiß, 2009). This aspect is extremely important since it is the only practical alternative for flying over difficult access areas, or characterized from natural disasters, for example, such as volcanic areas and scenes of accidents (Nex et al., 2013). Moreover, it allows to drastically reduce the flight altitude, improving the images resolution and adapting it to the size of object under investigation (Capolupo et al., 2014; Capolupo et al., 2015). UAV allows also to improve the aerial photos quality, removing the problems caused by weather conditions. Indeed, thanks to low flight quota and the possibility to realize the campaign in flexible data, aerial photos don’t affect by cloudy and drizzly weather conditions (Nex et al., 2013). Additional advantages are related to the capacity to see the aerial images in real time, in order to verify if they are taken in the correct position and they are blurry, to acquire and transmit the picture in fast way. The implementation of a global position system (GPS) and a navigation unit allow to accurately plan the flight path, guaranteeing sufficient image coverage and overlap.
On the contrary, the most significant limitation is related to the size and the weight of the sensors that can be mounted on them, often characterized by a small or medium format images. This means that, in comparison of large format camera, a major amount of photos are required to cover the entire area. Moreover, other limitations, regarding the platform configuration, are related to regulation of the country in which they have to be applied.
15
1.4 UAV-based photogrammetry
Photogrammetry is the science regarding the accurate and metric reconstruction of an object or a scene from pictures (Mikhail et al., 2002). Thus, it allows to analyse the 2D data and establish the geometric relationships between the images and the object under investigation in order to obtain a 3D model. In order to reconstruct the scene, this technique require a minimum of two images of the same objet acquired from two different points of view, but partially overlapped, like the human vision system. Indeed, if a scene is present in at least two images, the different position of an object allows to obtain a stereoscopic view and extract 3D information, essential for the 3D modelling (Remondino, 2011). The performance of this technique has been greatly improved thanks the introduction of UAVs and fifth-generation software for photogrammetry, since they have allowed to acquire aerial images at lower altitude than traditional aircraft and to process hundreds of photos in the mean time and to automatically restitute them (Pierrot-Deseilligny et al., 2011).
The introduction of these elements has allowed to revolutionize the photogrammetric technique, extending the sectors of applications to field scale and opening other opportunity of investigation. So, this new way to do photogrammetry is called UAV photogrammetry (Eisenbeiss, 2008).
1.5 Research goals
Goal of this research activity is to assess the possibility to apply UAV based photogrammetry for solving different environmental problems and to evaluate their ability in these situations.
In particular, two different case studies have been analyzed. The first is related to the development a highly innovative methodology for the detection of copper contaminated soils at small scales. It is based on an “inverse” approach to predict the distribution of copper accumulation hotspots in order to identify the points to be sampled. To reach this goal, techniques commonly used in other contests, such as hydraulic model have been mixed and applied at field scale. It involves indices able to predict wetlands locations and extension at catchment scale, models of transport process, geostatistics and UAV photogrammetry. In contrast, the second case study is focused on the assessment of the ability of hyperspectral images, acquired by UAV, for estimating structural and biochemical grassland traits in order to implement quantitative spatial information to the already existing management plans. In addition, in this research work, the best statistical strategy for predicting vegetation features, the influence of different fertilization types and
16 grassland plant phenology on the relationships between predicted grassland variables and observed vegetation traits have been explored.
1.6 Outline
Chapter 2 gives an overview regarding photogrammetric technique in order to describe this methodology more in depth and to analyse its evolution over the years. Chapter 3 is dedicated on UAV platforms and in particular, it gives an overview of the UAV platforms and their classification. In addition, it describes also the UAV systems applied in the two case studies, analyzed in this research activity. Chapter 4, instead, is related to the workflow for acquiring and processing aerial images in order to obtain 3D models and orthophotos, and later the final products, required to fit the research goals. Chapters 5 and 6 illustrate the practical applications of the combination of photogrammetry and UAV systems for detecting copper contaminated soils and for estimating structural and biochemical grassland traits, respectively. In the last chapter, chapter 7, the final conclusions are presented.
17
Chapter 2
Photogrammetry
2.1 Introduction
Photogrammetric technique is based on the extraction of 3D information from photographs or any type of image (satellite, aerial or terrestrial) as long as there is an overlap between the images. Thanks to the development of new digital cameras, computers and software, the photogrammetry has been become attractive and, for this reason, it can be applied to a wider range of situations, in particular in the field of environmental monitoring. Moreover, the introduction of new technologies has allowed to dramatically reduce the cost of the entire process of acquiring, processing and analyzing. Therefore, this technique has become essential in the current research work.
So, after an overview on the historical background at the base of the photogrammetry, this chapter is focused on the description of the photogrammetric technique and its evolution over the years.
2.2 Historical background
The first investigations were performed by Gaspard Tournachon in 1858 by applying a manned balloon in Paris (Newhall, 1969). Over the years, the balloon and other systems, such as kites, Pigeons and Rockets were developed in order to spy the enemies during the world wars (Newhall, 1969). In addition, a tethered balloon was employed in archaeological field in 1967, as shown by Whittlesley (1970). During this experiment, several cameras were mounted on a gimbal, located 9 m below the balloon, and the images were taken at a distance of up to 50 m above the ground. The load of this configuration was of about 2.7 kg while it was able to fly at a distance of about 600 m above the ground. Therefore, this first configuration showed that the flight quota depends on the requirements of the project and system parameters.
The first fixed wing UAV was applied in photogrammetric experiment in 1979 by Przybilla and Wester-Ebbinghaus, (1979). In this case, an UAV of the company Hegi was used. It was 3 m long with a wing span of 2.6 m. It was able to carry a maximum payload of 3 kg. It flow over the
18 study at flying height of 150 m above ground with a speed of 11 m/s. As explained in the successive chapters more in depth, the flight height was strongly influenced by the size of the plane, the payload and the size of the object under investigation. This experiment showed also that the images acquired in this way were not sufficient because of image motion, caused by the speed and the vibration of the engine. Therefore, in order to reduce the vibrations, Przybilla and Wester-Ebbinghaus (1979) proposed to use an helicopters.
In 1980, Wester-Ebbinghaus employed a rotary wing UAV for photogrammetric purposes. It was able to rise up a maximum payload of 3 kg and it was equipped with a medium format camera like the Rolleiflex SLX, a navigator system in order to verify the altitude, a camera shutter activated via radio link, a pilot in order to control the take off, landing and flying. Due to the success of this experiment, this kind of configuration was used as example for developing the successive models. Indeed, currently, multi rotors are the “gold standard” used in photogrammetry. In particular, the model most used is the quadricopter.
Also the development in computers and electronics have strongly improved the evolution of photogrammetry. Thus, four generations of photogrammetry can be distinguished. The first generation involves the period between the middle and the end of 1800, and it is characterized by the invention of photography by Daguerre and Niepce in 1839. The second generation is related to the analog photogrammetry, referred to the beginning of last century with the invention of stereophotogrammetry by Pulfrich in 1901. Moreover, also the airplanes and cameras became available and the aerial survey techniques were developed. This allowed to developed the basic mathematical theory even if the amount of computational operations was prohibitive for numerical solutions and consequently this method was not appreciate for long time.
Analytical is the name of the third generation photogrammetry, which is characterized by the introduction of the computer. For the first, Schmid employed the adjustment theory to photogrammetric measurements, even if the computers of that period were not adapt to support these operational heavy. Another important innovations of this group were the plotter and block adjustment program developed by Brown in the late sixties. In the fourth generation, digital photogrammetry, the aerial photographs are replaced by the digital images. In addition this phase is characterized by the development of special microprocessor chips and storage devices which permit rapid access to digital images.
19
2.3 Photogrammetry
In the reality, there is not an univocal definition of the term photogrammetry, which is composed by three Greek words: “phos” that means light, “gramma” that means letter and “metrein” that means measure. It's commonly defined as the “science of obtaining reliable information about the properties of surfaces and objects without physical contact with the objects, and of measuring and interpreting this information” (Shenk, 2005). Indeed, quite simply, it can be considered as a black box, for which the inputs are characterized by any kind of images, acquired with a proper overlap, from which is possible to extract reliable 3D information of the object or study area under investigation. The device used for acquiring photogrammetric data is called sensor and it consists of an optical and a detector system. It can be a digital sensor or an analog sensor. In this case, the pictures have to be digitalized by applying a scanner. On the contrary the tool where is mounted the sensor is called platform. The most common used platform are the airplanes or UAVs. From the digital images can be extracted four types of information:
Geometric information, consisting of the spatial position and the shape of the object under investigation;
Physical information, involving the properties of electromagnetic radiation;
Semantic information, depending of the meaning of the image;
Temporal information, depending of the change of an object in time. This data can be obtained by comparing several images of different times.
After having processed the pictures and extracted the information required the outputs are generated. They can be classified in three categories:
Photographic products: they can be generated from one photo or, alternatively, more pictures, which are merged in a mosaic. This result is called photomosaic. Only when it is rectified, it is geometrical identical with a map. In this case, it is called orthophoto;
Computational results: the most important application of this field is the aerial triangulation. It allows to deliver 3D position of the points in a ground control coordinate system. The most significant product is the digital elevation model (DEM);
Maps: these are the most considerable result and they can be distinguished in planimetric (they contain only the horizontal position of the ground
20 features), topographical (they contain both horizontal and elevation data) and thematic (they underline one particular feature of the ground).
2.4 Basic principle of photogrammetry
The generation of photogrammetric outputs is based on the collinearity principle, which defines the relationship between image and object space. Following the equations of that principle is described: (Eq. 2.1)
where f is the focal length, X0 Y0 Z0 are the element of the perspective centre, r11, r12, r13, r21,
r22, r23, r31, r32, r33 are the elements of the rotation matrix, X,Y,Z are the coordinates of the 3D object
while x0 and y0 are the coordinates of the image point. The collinearity model is related to the
metric image coordinate system, while the measurements carried out on the digital images is related to the pixel coordinate system. The points measured in at least two images are commonly called tie points, and for them the collinearity model is applied. The equations for all tie points are merged in a system, which is solved using an iterative least squares method, generally called Gauss-Markov model. In order to obtain the 3D object, firstly it is required to approximate all the unknown parameters and then they are estimated. The name of this method is bundle adjustment. If the interior parameters are known the method is called self calibrating bundle adjustment. The estimation error can be described by the following equation:
(Eq. 2.2)
where e is the error vector, while A is the design matrix, x is the vector of the unknown parameters and l is the vector constituted by the observations. To weight the observations and the unknown parameters it is used also a weight matrix P. Thus, the estimated x is computed by Equation 2.3:
(Eq. 2.3)
Its residual and the standard deviation are calculated with Eq. 2.4 and 2.5:
(Eq. 2.4)
21 r is the redundancy of the system.
In order to obtain a 3D reconstruction, at least two pictures of the same object acquired by two different viewpoints are necessary. Indeed, between the two images the baseline (B) and the average camera to object distance (D) are considered and used to calculate the base-to-depth ratio (B/D). Its typical value in photogrammetry is around 0.5, even if it’s really difficult to reach this standard in the practical situations. This parameter influences the accuracy of the results. So, the accuracy is increased with the largeness of the baseline. In the mean time, the largeness of B causes problems in finding automatically the correspondences between the images involved. The accuracy of the reconstruction is computed by Eq. 2.6 (Fraser et al., 1996):
(Eq. 2.6)
Where k is the number of pictures, q is an empirical factor, S is the image scale, σXYZ is the
accuracy of the computed 3D object coordinates and σxy is the accuracy of the measurements. The
22
Chapter 3
UAV systems
3.1 Introduction
The term Unmanned Aerial Systems (UAS) has been coined and adopted by the US Department of Defense (DOD) and the Civil Aviation Authority (CAA) of the UK to describe the whole flight system, composed by the aerial vehicles and the ground control station (Nex & Remondino, 2014). Over the years and depending on the field of investigation, various different names and acronyms have been developed to describe them, such as ‘‘Unmanned Aerial Vehicle’’ (UAV), ‘‘drone’’ or ‘‘Remotely-Piloted Aerial System’’ (RPAS), introduced by the International Civil Aviation Organization (ICAO) in the ICAO Circular 328 (ICAO, 2011). Nevertheless, the most popular terms are drone and UAV (Colomina & Molina, 2014), and, for these reasons, in the present work, the term UAV is commonly used.
This chapter gives an overview of UAV systems, which have been used in photogrammetric applications. In particular, historical background and applications, classification of UAVs, description of UAV platforms applied in the two case studies under investigation, and regulation have been discussed over the following sections.
3.2 Historical background and applications
At first, UAVs were born and developed in the military context, in order to fly over the enemy areas without any risk for the pilot. Just in the late nineteen-seventies, it was evaluated their utility for civil and Geomatics field (Przybilla et al, 1979). Nevertheless, their spread has run up against the distrust of scientific community. Indeed, they have become increasingly popular and widespread in the last two decades thanks to the fast improvement and integration of platforms, of integrated circuits and radio-controlled systems and software applied for reconstructing the surveys.
First investigations dated back to the Carnegie Mellon University, which applied drones in the robotics context. Works related to the study of the potential of the spatial details in the 3D point cloud for urban and natural terrain surveys can be find in 2003, when Thrun (2003) described the results of the combination of helicopter mapping system, Honeywell 3D compass, Garmin Global
23 Position System (GPS) and Nikon D100 digital SLR camera. However, He didn’t take into account the accuracy and orientation of the flight trajectory. The researchers started to move in that direction in 2004 at the ISPRS congress, where a system, including a LIDAR system and CCD-cameras with GPS, for digital surface model generation was presented by Nagai et al (2004). Even if the complete workflow for the digital surface model generation was introduced by Nagai et al., (2008). In this study, the results were obtained by an indirect georeferencing method, which needed the position and orientation at the acquisition time of pictures. So, the images orientation ensued from the use of GPS data and Ground Control Points (GCPs). Recent technical electronic and optical development for aerial platforms and the devices mounted on them have improved the accuracy of UAV trajectory for 3D modelling.
Currently, UAVs are mainly employed in archaeological applications (Remondino et al., 2008) or in environmental problems monitoring, such as traffic supervision (Puri et al., 2007), emergency management (Molina et al., 2012), pollution detection (Capolupo et al., 2014; Capolupo et al., 2015), or in agriculture supporting, like precision farming (Newcombe, 2007).
3.3 Regulation
The necessity to define some security criteria of UAV flights has been warned as essential in order to avoid damage to people and/or things due to the widespread of UAV application in civil context. The regulations for UAV platforms and flights were originally introduced by the cooperation of NATO and EURO control in 1999. This work has not been adopted as standard by the aviation authorities of different countries; indeed, each of them issued a typical guideline according to the characteristics of own Nation. Nevertheless, all regulations have a common thread: the rules are strongly different depending on the size, weight, on board technology of aircraft and their employment.
In particular, in December 2015, the Italian Civil Aviation Authority (ENAC) released the last version of guideline regarding UAVs under 150 Kg. Like the other European countries, it makes a distinction between two types of drones: UAVs characterized by a take-off weight below 25 Kg and UAVs with a take-off weight above 25 Kg and below 150 Kg. This classification is linked to devices critically. On the base of pilot capacity to visually track the drone, the operational condition are organized in Beyond Visual Line Of Sight (BVLOS), Visual Line of Sight (VLOS) and
Extended Visual Line Of Sight (EVLOS). BVLOS comprises the operations in which the pilot cannot
24 which the pilot visually tracks the drone; instead, EVLOS indicates the situations in which the pilot can visually monitor the drone thanks the help of some devices. On the base of location, the procedures are classified in non critical and critical. The firsts are referred to VLOS operations on non congested areas; all the others situations are considered critic. Flying over groups of people is prohibited in any case. The criticality must be assessed by the pilot.
The specific rules for every unmanned aircraft of less than 25 kg of take-off mass impose that they have to been equipped with an electronic identificative device able to the transmit and record each data related to the operation in real time. Moreover, both vehicles and ground station need a licence plate in order to indentify the system and the operator. It is also necessary a declaration of compliance undersigned by the pilot and submitted to ENAC. For the critic conditions further equipments are needed in order to ensure an acceptable level of safety. Indeed, a system to maintain the aircraft control in the case that data link is lost the aircraft, is required.
The other type of UAV follow the same rules of the aircraft of less than 25 kg of take-off mass. In addition they must be registered with ENAC and they can fly just with an ad hoc flying permit.
In this guideline, it’s also identify a third category: aircraft used for recreational and sport purposes. In this case, in order to avoid asking ENAC for temporary reserved airspace are, they don’t have to fly over urban areas and infrastructure, it is necessary that the aircraft weights maximum 25 kg, has a maximum wing surface of 500 dm², maximum wing loading of 250 g/dm², maximum piston engine size of 250 cm³, maximum electric engine power of 15 kW, maximum turbine engine thrust of 25 kg (250 N), maximum turboprop engine power of 15 kW. Moreover, it is not needed any declaration or authorisation.
The pilot needs a particular permit on the base of the aircraft that he wants to drive: a ‘Remote Pilot Certificate’ is required for manoeuvring a system under 25 Kg; while, a ‘Remote Pilot License’ is obligatory for operating heavier aircrafts and BLOS operations. A special aeronautical certificate for UAVs pilot have been introduced, which is ensued by some authorized centres after a training period and having an exam.
According to EU Regulation 785/2004, the Regulation also imposes to ensure any kind of drone for any type of operation.
25
3.4 UAVs classification
The UAV systems, generally used as photogrammetric platforms, are classified on the base of the main characteristics of the aircrafts, like their engine/propulsion system (unpowered or powered), or their aerodynamic features (lighter than air or heavier than air) and their physical traits (flexible, fixed and rotary wings) (Table 3.1) (Eisenbeiss, 2009).
Table 3.1 – Photogrammetric UAV systems categorization (source: Eisenbeiss, 2009)
Lighter than air Heavier than air
Flexible wing Fixed wing
Rotary wing
Unpowered Balloon Hang glider Gliders Rotor-kite
Paraglider Kites
Powered Airship Paraglider Propeller Single
rotors Jet engines Coaxial Quadrotors Multi-rotors
As shown in Table 3.1, the rotary wing platforms are catalogued in single rotors, coaxial (also known as double-rotor systems), quadro-rotors, multi-rotors. Single-rotor systems consist of one main rotor and one tail rotor: the first is responsible of lift and thrust; while the tail rotor is used to correct the yaw motion and the torque. Contrary to the single rotor systems, the coaxial platforms use two main rotors. This is reflected in an increase of the complexity of the mechanical structure, of the flight altitude, of the payload that they can lift up and of the stability of the system. In addition, the single and coaxial systems have more power than four- and multi-rotor systems. Consequently, they are able to raise up more payloads, which influences the size, number and weight of the sensors that can be mounted on the drone (Eisenbeiss, 2011). Therefore, quadrorotors are usually equipped with light sensors, so that they can be flown indoors as well as outdoors (Hoffmann, et al., 2004). The application of these systems is strongly influenced by the climatic conditions, like the wind. So, its use is limited to really small areas. This problem can be eliminated by applying multi-rotors. Indeed, their size and weight is similar to
26
quadro-rotors, but the redundancy of multiple rotors allows to improve the stability and security against systems crashes (Niethammer et al., 2009, Vito, 2009). Gliders, included among the unpowered fixed wing systems, utilize the airstream for the forward motion and uplift; on the contrary, the powered fixed wing use propellers and jet engines for the forward motion. Bendea et al., (2007) have shown that rotary wing systems can be adopted to operate closer to objects than fixed wing UAVs, due to larger flexibility in their control, even if they can stay for less time in the air, covering smaller areas. Balloons and gliders are controlled by ropes, which limit the flight altitude and distance from the operator. In addition, they are strongly influenced by wind, more than rotary and fixed wing UAVs. Like these systems, also the airship application is limited by the climatic conditions, but this platform can stay longer in the air than the fixed and rotary wing platforms.
Alternatively, they could be classified according to the size, the weight, the endurance, the range and the flight quote in
Tactical UAVs: this category includes micro and mini UAV (their mass range is by 1000 kg), with a close-, short-, medium-range in distance (the range is comprised between few km and 500 km) and a flight altitude between few hundred meters to 5 km and the endurance from some minutes to 2-3 days;
Strategical UAVs: this class comprises by platform able to fly higher than 20000 m and with an endurance of 2-4 days;
Special UAVs: this group incorporates unmanned autonomous vehicles.
Therefore, joining the two classifications and evaluating the physical traits of UAV platforms, it is possible to quantify the pros and cons of different UAV platforms. In Table 3.2, the numeration is between 0 (low) and 5 (high).
Table 3.2 - Evaluation of UAVs traits
Kite/ Balloon Fixed Wing Rotary Wings
electric ICE engine electric ICE engine
Payload 3 3 4 2 4
Weather and wind dependency 4 2 3 2 4
Range distance 2 5 5 3 3 Landing distance 4 3 2 4 4 Minimum speed 4 2 2 4 4 Endurance 3 3 3 4 3 Maneuverability 2 3 3 4 4 Flying autonomy - 3 5 2 4
27
Portability 3 2 2 3 3
Moreover, UAVs can be classified on the base of the flight performance in manual, assisted or autonomous flight, or according the quality of the navigation system in NO GPS, GPS and DGPS. The quality of the navigation system influence the accuracy of the application: the first allow to have a really low accuracy (m), the second has a moderate accuracy (dm) and the third has an high accuracy (cm).
3.5 Aircraft configuration used in the two case study
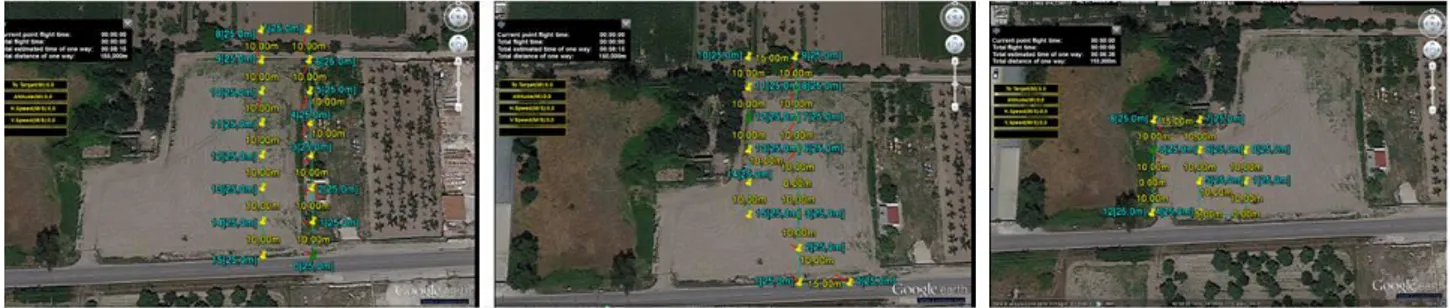
In the first case study, “UAVs and photogrammetric technique for detecting copper contaminated soils”, a novel prototype UAV, projected and designed by our research group (Figure 3.1), was employed. Although the quadric-rotors is the ‘gold standard’ for this kind of investigations, we preferred using a hexacopter due to the reasons explained in the previous section, it has a greater stability and power to lift heavier loads. As hexacopter frame, we chose the carbon fibre Tarot FY690s. Its interaxis is of 690 mm and if the entire chassis weighs below or equal to 600 g, it can raise up a load of 3 kg. The vehicle configuration was optimized on the base of the frame and loads. So, six FullPower 4006M engines, six APC M 12 x 4,5 propellers, six 30A OPTO regulators and one Lipo 4s 5000 mAh battery were chosen so that the aircraft can fly for about 10 minutes (the time is strongly influenced by loads and weather conditions) and lift a digital camera.
Figure 3.1 - The Tarot 690s UAV
Moreover, it was equipped with all indispensable hardware elements and software tools necessary for its control, programming and planning of the flight according to Italian Regulation. Therefore, a compact multi-rotor autopilot system, DJI NAZA – M V2, was mounted on for providing good self levelling and altitude holding. It is composed by a main controller, an
28 independent Power Management Unit (PMU), a global positioning system (GPS) unit and a LED able to identify the UAV health status.
For photographic recording, also a small digital camera, a Canon Powershot S100, was mounted on it. It was chosen for its high resolution (12.1 megapixels), having a built-in global positioning system (GPS) unit, the possibility to acquire RAW format images, its small size (98,9 x 59,8 x 26,7 mm) and weight (200 g). In addition, It was equipped with a 7.44 x 5.58 mm sensor with 5.2 mm focal length and consequently, its pixel size is of 0,00186 x 0,00186 mm.
In the second case study, “Estimating biochemical and physical grassland traits From UAV acquired hyperspectral images”, an octocopter UAV, Aerialtronics Altura AT8 v1A, was chosen. Like in the other case, it was equipped with a ground station for planning and control of the flight paths and all essential tools for its programming (Figure 3.2). However, the main difference with the previous platform consists in the sensors mounted on it. Indeed, in this case, it was equipped with a global position system, a photogrammetric camera Panasonic GX1 for acquiring RGB photos suitable for 3D modelling of the study area, a Hyperspectral Mapping System (HYMSY), for acquiring hyperspectral images.
Panasonic GX1 is a camera of small size (116 x 68 x 39 mm) and weight (318 g), even if bigger and heavier of Canon Powershot S100, with a really good resolution (16 Mpx). Its pixel size is of 14.1 µm², while the sensor size is of 17.3 x 13 mm.
HYMSY was projected and developed at Wageningen University and Research Centre, specifically for small air vehicles, able to lift a load of 2 Kg. Indeed, It is a lightweight hyperspectral pushbroom system, consisting in a PhotonFocus SM2-D1312 industrial camera and a Specim ImSpector V10 2/3 spectrograph. Its wavelength range is of 400–950 nm with a spectral resolution of 9 nm.
29
Chapter 4
Workflow for processing UAV data
4.1 Introduction
This chapter is focused on the description of workflow commonly used for processing data acquired from UAVs. First, an overview of the overall processing procedure is shown; sub-sequentially, the different steps are described in details. Indeed, the entire method is divided in different modules. Each of them is organized in several steps, which can be diverse according to the task. For this reason, before starting any kind of operation, it’s fundamental to define the subject under investigation and the suitable platform.
4.2 Workflow
Figure 4.1 shows the procedure commonly applied in any kind of task, organized in modules. Firstly, it is essential to plan the project, which means not just to define the subject under investigation, but also to identify the most suitable platform, tools and software for reaching the goal. Therefore, this is the most important step of the entire procedure indeed, even if only a really small detail is not designed in a proper way, the final result can be damaged.
After that, the real processing phases start. They are classified in data acquisition, image analysis, product generation and final applications. The data acquisition step involves both the platform preparation for taking images and the real act of data capture. The image analysis stage is the consecutive step. It includes the pre-processing examination of the pictures, the processing data and the final product generation. Basically, the operations of this step differentiate according to the goals. So, results are generated and applied to solve the initial problem. Each of these steps is been analysed in depth in the following sections.
30
Figure 4.1 - Workflow for UAV data processing
4.3 Data acquisition
After designing the entire project, the data acquisition step starts. As explained in Figure 4.2, It involves several transitions, such as platform and tools preparation; survey planning; flight planning; flight; data acquisition.
Figure 4.2 - Description of data acquisition procedure
Firstly, it is essential to check the operation mode of all the equipments and in particular of UAV platform, because also a really small malfunctioning of the electronic or mechanical tools could entail a failure and, consequently, damaging people or things. After that, the batteries of UAV platform, camera and topographical devices, sub-sequentially employed for detecting the coordinates of Ground Control Points (GCP), like Global Position System and Total station, have to
31 be charged. This step doesn’t involve just mechanical operations but also a technical action: camera calibration.
Camera calibration is a necessary procedure for obtaining a precise and reliable 3D metric reconstruction from 2D images, since it allows to reconstruct the camera interior parameters, using the collinearity and a multi-image approach (Figure 4.3) (Remondino, 2011). Indeed, the calibration procedure allows to analyse and correct the geometric deviations of the physical reality from an ideal system. The calibration is considered concluded when the interior parameters (focal length, principle point offset and additional parameters (APs)) are known.
Figure 4.3 - Camera calibration
In order to calibrate a camera system, the physical model (Brown, 1971) is commonly used (Eq. 4.1 – 4.2). In this model all the elements can be related to physical error sources.
- (Eq. 4.1)
y - (Eq. 4.2) where f is the focal length, , , , (x0, y0) is the principle point offset, Ki is the term for the radial distortion, Pi for the decentering distortion, A for the affinity factor and Sx for correcting the share in the image plane. The radial distortion (Δr) is usually calculated by applying Eq. 4.3:
(Eq. 4.3)
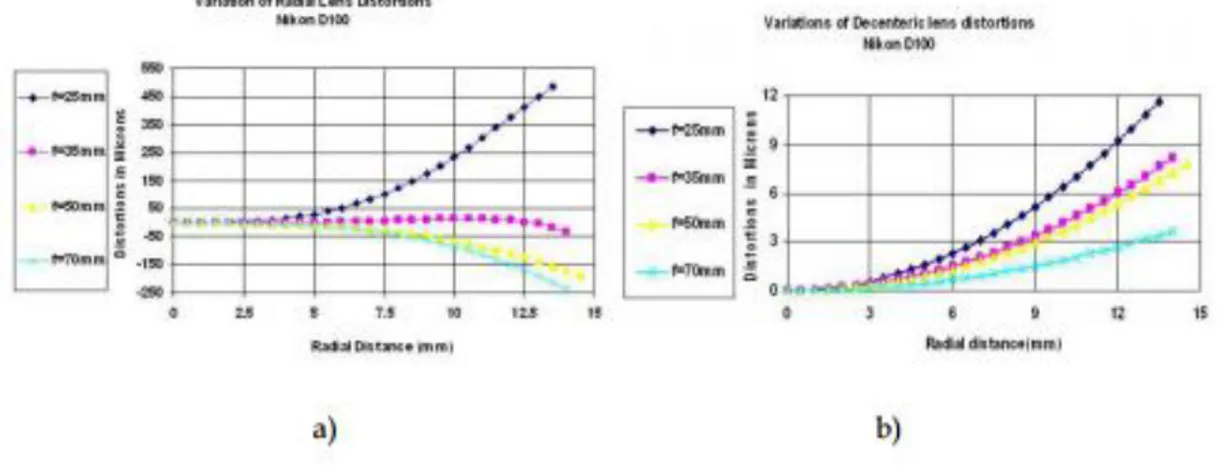
where r is the radial distance from the image centre. In Figure 4.4 are shown the typical trend of the radial and decentering distortion according to the variation of image radius and focal length. Ki are usually highly correlated. The coefficient K2 and K3 are usually included in
32 application requiring a higher accuracy, like photogrammetry. The decentering distortion is due to a lack of centering of elements along the optical axis. It is usually an order of magnitude bigger than radial distortion and in general it increases with increasing the focal length.
Figure 4.4 - Radial and decentering distortion profile for a digital camera set at different focal length.
Several calibration procedures have been developed over the years, some of them are object based calibration, while others use images taken in a static scene. Zhang (2004) identified three different calibration categories according to the dimension of the object chosen as reference for the calibration procedure:
3D reference object based calibration; 2D plane based calibration
1D line based calibration.
3D reference object based calibration involves the knowledge of the geometry in the 3D space of an object, chosen as reference. This object is usually composed by two or three planes orthogonal to each other. This kind of calibration is quite expensive since it needs a costly calibration equipment and a complex setup. Instead, the 2D plane based calibration, requires a planar pattern as reference (Sturm & Maybank, 1999; Zhang, 2000). It has to be oriented in few different directions. It is easier and less expensive than the first one. The third category is characterized by an object, compose by a set of collinear points (Zhang, 2002). It is realized by observing a moving line around a fixed point. Comparing these three methods, the 3D reference object based calibration is the most accurate but also the most expensive (Zhang, 2004). So, the first one is indispensable in all cases in which an high accuracy is required.
33 Other techniques, without using any calibration object, exist. In this case, just taking three pictures moving the camera in a static scene, it is sufficient to reconstruct both internal and external required for calibration. This technique is based on estimating a large number of parameters.
Moreover, in the case of aerial photos, the calibration procedure is usually performed in laboratory, even if also the in-flight calibration is possible (Colomina et al., 2007). The in flight calibration is performed acquiring pictures at different flight altitude (Nex & Remondino, 2014). Also in the case studies under investigation in this work, it has been preferred the lab calibration because more precise. It is important to underline that the images block taken during the data acquisition phase are not suitable for calibrating the camera and for this reason it is better to separate these two steps.
The calibration method used in the current study is the 1D plane based calibration by applying Agisoft lens software. It involves the printing of a pattern and its attachment to a planar surface or, alternatively, the generation of the patterns made available by software. Sub-sequentially, it has to take few pictures of the model plane under different direction, paying attention to comprise all the scene. After that, the feature points in the images have to be detected and the five intrinsic and external parameters have to be estimated via Agisoft lens. In this way, the lens distortion is minimized. These parameters are consequently employed in the following processing.
Once the preparation tools phase is concluded, the survey planning starts. Analysing the size, configuration and location of the area of interest (AOI), it is possible to identify the proper number and position of Ground Control Points (GCPs) necessary for the topographical reconstruction of the scene, subsequently, surveyed with a GPS or, alternatively, an accurate total station. Moreover, this step allows to have a precise idea of the area and to programme any kind of possible interventions in order to solve any problems that appear.
The trajectory and the different flight parameters are programmed mixing the information acquired during the previous phases, “project definition” and “platform and tools preparation”. Indeed, in order to plan flight parameters (speed, altitude, shooting time), it is indispensable to know data related to the camera sensor traits, type of aircraft, size and configuration of the AOI, applications and flight restrictions, imposed by the Regulation. In general, the camera focal length and the desired image scale and the longitudinal and transversal overlap of the strips are fixed, while the altitude, the speed and the waypoints (distance between two consecutive images) are calculated (Nex & Remondino, 2014). According to Cannerozzo et al. (2012), the flight altitude can be estimated by Eq. 4.4:
34
N f
H (Eq. 4.4)
where, H is the flight altitude, f is the focal length and 1/N the desired scale image.
Each acquired image covers a particular portion of the AOI, the size of which can be calculated by Eq. 4.5:
L (Eq. 4.5)
l is the length of the image side. Known the side of the image and fixed the overlap is possible to compute the distance between two waypoints by Eq. 4.6:
B l N ( - ) (Eq. 4.6)
B is the distance between two waypoints and µ is the longitudinal or transversal overlap. It is recommended to use an overlap of about 60-80% in longitudinal side and 40-50% in transversal side. These parameters can be calculated manually or by a dedicated software.
Also the flight mode have to be chosen. It can be manual, assisted or autonomous. This characteristic strongly influences the image quality (Nex & Remondino, 2014). The manual mode gives generally the worst results, since the image overlap and geometry of acquisition is very irregular. On the contrary, using an assisted or autonomous mode allows to improve the acquisition. Indeed, the autopilot, composed by hardware and software elements, is able to fly according to the trajectory and the selected waypoints, communicating with the platform during the flight mission. Platform, auto-pilot and GCS are essential for the results quality. So, when low cost platform and light weight are employed, it is essential to increase the overlap among the images (Remondino, 2011).
In our case, all the parameters have been computed manually while the flights have been performed using the autopilot assistance. Version 4.0.11 of Ground Control Station software has been selected.
Moreover, in order to improve the image quality and to minimize the influence of shadows on the ground, it is required to perform the flights in good weather condition, without clouds, wind and haze and during the brightest hours of the day. Consequently, the flight is performed and the pictures took. During this step it is fundamental to collocate and to acquire the coordinates of the proper made target, subsequently used as GCPs in the following analysis.
35 In this research activity are designed a properly made target using a cutting board and stoppers for roller shutters, as foot in order to increase the support stability. The different steps needed as shown in Figure 4.5.
Figure 4.5 - Steps of target preparation and final result
4.4 Image analysis
The images analysis phase is composed by pre-processing and processing steps, each of which is characterized by several stages, as shown in Figure 4.6.
36
Figure 4.6 - Image analysis workflow
Initially, the image quality check is essential in order not just to verify how many and which of them should be eliminated, because too blurry or not enough clear, but also to confirm that the images have been acquired in the defined positions (Eisenbeiß, 2009). It is absolutely necessary to acquire the images again, when the conditions are not met, like in one of the following situations:
The image haven’t been acquired in the desired positions; One or more images have been taken;
There isn’t the correct overlap among the acquired pictures.
Therefore, if the images block has a good quality, the orientation procedure starts. This process is based on determining the position and the angles during pictures acquired. In order to increase the accuracy of this procedure, a set of tie points (GCPs) have to be manually or automatically recognized in the images. To minimize the errors, tie points have to be well distributed in all images and, moreover, in the most of the cases, they have to be presented in three different pictures. These points will be then employed to iteratively solve a system of collinearity equations with the Gauss-Markov model of least squares (Guidi & Remondino, 2007), as explained in Chapter 2. The GCPs coordinates have to be measured with an accurate surveying system, like Global position device or a good total station. GCPs coordinates will be used to calculate the rototranslation matrix for orienting the images from the first reference system to the new one.
Once the image orientation is concluded, the 3D scene measurements can be performed. Applying the basic principles of photogrammetric technique and the knowledge of interior and
37 exterior camera parameters, a 3D point cloud is generated. The generation of a dense or alternatively sparse 3D point cloud depends on the area of interest and project requirement. The sparse modelling is usually realized by a manual measurements, and it is suitable for architectural or 3D city applications (Gruen & Wang, 1998; El-Hakim, 2002). On the contrary, the automated procedure is preferred when dense surface measurements and reconstruction, like a DEM deriation (Guidi & Remondino, 2007). Several research works, Pierrot-Deseilligny & Paparoditis (2006), Hirshmuller (2008), Remondino et al. (2008), Hiep et al. (2009), Furukawa & Ponce (2010), have demonstrated the great potentiality of this technique for dense 3D point cloud generation. Therefore, in the last years, different commercial, open source and web-based software have been realized to automate this procedure, such as Photomodeler Scanner, used also in the case studies of this research activity, MicMac, PMVS.
After that, a polygon model, generally called mesh, is generated. This step is realized by applying different stages, which order is different according to the available data. A specific process is adopted according to the kind of matrix, which can be regular and structured or unstructured and irregular. The method to apply is easier in the first case than in the second one. In particular, if the point cloud is characterized by a regular and structured matrix, it firstly involves the research of the neighbour potential mesh connections for each 3D point, and later the mesh generation. This can be done by two different approaches according to the software used: zippering and volumetric algorithm. In the first one, the overlapping areas are selected, the redundant triangles are removed and the neighbour potential mesh connections are merged (Turk & Levoy, 1994). Soucy & Laurendeau (1995) evaluate the redundancy of the mesh on the base of the Venn diagrams. The second approach is based on the triangulation union of the point sets (Bernardini et al., 1999). In this method an imaginary ball is rolled on the point sets and a triangle is created for each triplet points. This methodology gets critical when a large number of overlapped areas is presented. Another method, the volumetric algorithm is based on the subdivision of the model space in voxels. This subdivision is done on the computation of the average position of each 3D point (Curless & Levoy, 1996). This method appears more efficient than the previous one.
Therefore, while the mesh generation is immediate for the structured point clouds, on the contrary, the process is quite complex for the unstructured point cloud, since the identification of the neighbour potential mesh connections for each 3D point is not immediate enough, like the previous proceeding. Indeed, in this case, it have to be employed a specific process like Delaunay, which consists in searching the neighbour for each point re-projecting the 3D points on a level surface or, alternatively, another primitive surface and verifying the shorter distance among them.