Summer Thermal Performance of Ventilated Roofs
with Tiled Coverings
To cite this article: M Bortoloni et al 2017 J. Phys.: Conf. Ser. 796 012023
View the article online for updates and enhancements.
Cryogenic Multilayer Insulation with Silk Net Spacers
W L Johnson, D J Frank, T C Nast et al.
The design of a vehicle-mounted test system for the thermal performance of solar collector
S R Wen, X H Wu, L Zhou et al.
-Numerical investigation to study effect of radiation on thermal performance of radiator for onan cooling configuration of transformer
V Chandak, S B Paramane, W V d Veken et al.
-Recent citations
Solar gain mitigation in ventilated tiled roofs by using phase change materials
Michele Bottarelli et al
-Experimental Study of Thermal Buoyancy in the Cavity of Ventilated Roofs
Nora Schjøth Bunkholt et al
-Summer Thermal Performance of Ventilated Roofs with Tiled
Coverings
M Bortoloni1, M Bottarelli1 and S Piva2
1 Dipartimento di Architettura, Università di Ferrara, via Quartieri 8, 44121 Ferrara, Italy
2 ENDIF - ENgineering Department In Ferrara, Università di Ferrara, via Saragat 1, 44122 Ferrara, Italy,
Corresponding author E-mail: [email protected]
Abstract. The thermal performance of a ventilated pitched roof with tiled coverings is
analysed and compared with unventilated roofs. The analysis is carried out by means of a finite element numerical code, by solving both the fluid and thermal problems in steady-state. A whole one-floor building with a pitched roof is schematized as a 2D computational domain including the air-permeability of tiled covering. Realistic data sets for wind, temperature and solar radiation are used to simulate summer conditions at different times of the day. The results demonstrate that the batten space in pitched roofs is an effective solution for reducing the solar heat gain in summer and thus for achieving better indoor comfort conditions. The efficiency of the ventilation is strictly linked to the external wind conditions and to buoyancy forces occurring due to the heating of the tiles.
1.Introduction
In hot climate reduced building cooling consumption and increased standards of indoor thermal comfort are issues of great relevance. In these regions, the roof plays an important role in reducing the effects of solar radiation when compared to other building elements, due to its extension and exposure to the sun. The common strategies for improving the thermal performance of the building envelope can be summarized in increasing thermal insulation, thermal mass and solar reflectance of the roofs. Other strategies are also available, such as the exploitation of natural convection by adding a ventilated layer below the covering [1]. In cold climates applications of this technology have been studied in depth as strategy to control the vapour [2,3]. Conversely, as will be demonstrated by the following analysis of the literature, in hot climates the performance of ventilated roofs in reducing heat gains is less analysed.
The arrangement of the covering elements over a “batten and counter-batten” system in a traditional pitched roof allows the creation of ventilation ducts under the tiles, Above Sheathing Ventilation (ASV in the following). This volume, where air flows from eaves sections (intake vent) to the ridge, helps to dissipate the excess heat in summer [1]. The efficiency of the ASV is strictly linked to the external wind conditions and to the buoyancy forces induced by the heating of the covering elements. In tiled roofs the air-permeability of the overlapping tiles is an additional and diffused intake/exhaust air-vent system.
Several studies have demonstrated the ASV performance in reducing solar heat gain. Some works
1
International Conference on Recent Trends in Physics 2016 (ICRTP2016) IOP Publishing Journal of Physics: Conference Series 755 (2016) 011001 doi:10.1088/1742-6596/755/1/011001
Content from this work may be used under the terms of theCreative Commons Attribution 3.0 licence. Any further distribution of this work must maintain attribution to the author(s) and the title of the work, journal citation and DOI.
followed an experimental approach. In [4] laboratory tests were carried out to evaluate the airflow and the temperature distribution in ASVs, as a function of the power of the solar radiation and the size and shape of the channel. Full-scale models were prepared to run outdoor tests in [5, 6]. In [5] the summer performance of ASVs in combination with a radiant barrier was analysed. A significant performance improvement over a standard ventilated roof was recognized during the daytime. Different sizes of the ventilation duct were compared in [6]. A correlation between solar radiation and ventilation rate, based on experimental data, was discussed in [7].
Other works used numerical models to analyse the mutual relations between air-flows and heat-transfer in ventilated roofs [8-13]. The thermal behaviour of ventilated roofs was analysed with the code Fluent in [8-9] taking into account the airflow due to buoyancy forces only. In [8] the results showed that the heat fluxes can be reduced up to 50% during summer with ventilated roofs. In [9] buoyancy forces are demonstrated to be efficient in producing significant airflows in the channel.
In [10], simulations were carried out to quantify the thermal benefits of a tiled roof over a shingle one, assuming time dependent heat and moisture levels with steady airflow. The estimated benefit was about 14%. A numerical model was developed and validated against experimental data in [11]. It was observed that the airflow induced by the buoyancy forces within the ventilated space reduces the heat flux penetrating into the attic of a 30% in comparison to a direct-nailed roof. In [12] this result was confirmed by means of a different steady state numerical analysis. Anyway, in all these papers the impact of air-permeability in tiled roofs is not investigated and the waterproof covering over the ventilation layer is schematised as a continuous element.
In the present paper a numerical approach is followed to assess the summer thermal performance of a ventilated pitched-roof. The effect on the ventilation efficiency of the air-permeability due to the tile-to-tile opening of a tiled covering is also investigated. Both the cases are compared with the corresponding unventilated roof. The calculations were performed in steady state and repeated for different times of the day and weather conditions.
2.Methods
The commercial finite-element code COMSOL Multiphisycs V4.4 is used for the simulations, to solve the thermo-fluid steady problem in a 2D computational domain. The effect of the buoyancy forces is considered. For the turbulent flow the standard k-ε model is used. For the environmental conditions, data sets based on experimental data are used for wind, solar radiation and temperature.
2.1.Model domain
The numerical simulation of fluid flow and heat transfer in ventilated roofs is a complicated multi-scale problem, on account of the different length multi-scales to be considered. The large multi-scales, pertaining the interactions between wind and building, are strictly connected to the small scales associated with fluid flow within the ASV and the tiny interstices among the overlapping tiles.
In this phase of the research, more attention was paid to the ventilation channel, at the expense of a simplification to the external fluid flow problem. Hence, a 2D domain was modelled as a section of a one floor building of infinite width, thus neglecting the 3D effects of the interaction between building and wind. The one floor building, covered by a pitched roof composed by two slopes with a tilt angle
(θ) of 15°, is included in a large external environment 100 m long and 20 m high. Each slope is 5.6 m
long; the left one is West-oriented and upwind, whereas the right one is East-oriented and downwind. The scheme of the domain is depicted in figure.1.
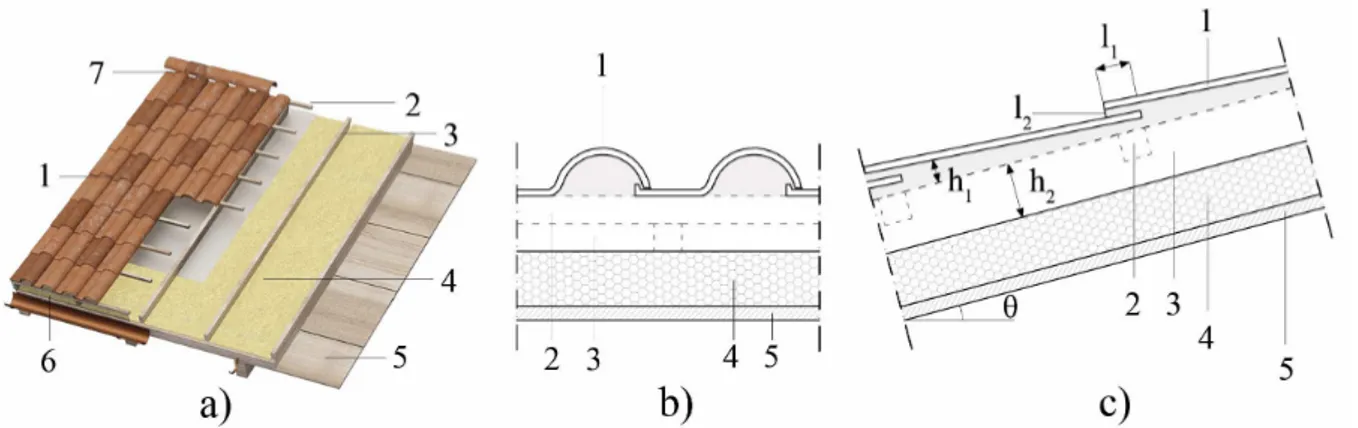
In figure 2 are shown a 3D sketch and a cross-section of the ventilated roof. The roof covering is made of Portuguese roof tiles laid on the underlying structure, a batten and counter-batten system. In this phase of the work the latter is not included in the model, although the batten and counter-batten system gives a 3D nature to the thermo-fluid problem. The ventilation is provided by the air flowing into the channel at the eaves section and through the gaps among the overlapped tiles, and partly leaving out at the ridge.
Figure 1. Schematic of the 2D domain.
Figure 2. 3D sketch: (a) and cross sections of the ventilated roof (b); 1: tiles; 2: batten; 3:
counter-batten; 4: thermal insulation layer; 5: wooden boards; 6) eaves vent comb filler; 7) vented ridge;
l1: length of the tiles overlap; l2: thickness of the gap between the overlapping tiles; h1: thickness of
the air layer under the tile; h2: thickness of the ventilation layer; θ: tilt angle.
figure 2b. In the 2D model, the tile shape is simplified in an inclined slab (figure 2c) laid over the batten space with variable height (max 3cm; min 1.5cm), calculated as the average tile height. With regard of the cross sections shown in figure 2, the roof structure is composed of the following elements:
• terracotta tiles, 1, thickness 1 cm;
• tiles overlap, l1, 5.0 cm long;
• opening gap between the overlapping tiles, l2, 0.6 cm high.
• air layer h1 (variable height 1.5-3.0 cm);
• ventilation layer, h2, (8.0 cm), resulting from the batten (4.0 cm) and counter-batten (4.0 cm)
system;
• thermal insulation layer (8.0 cm) of high-density wood fibre;
• wooden board (2.0 cm).
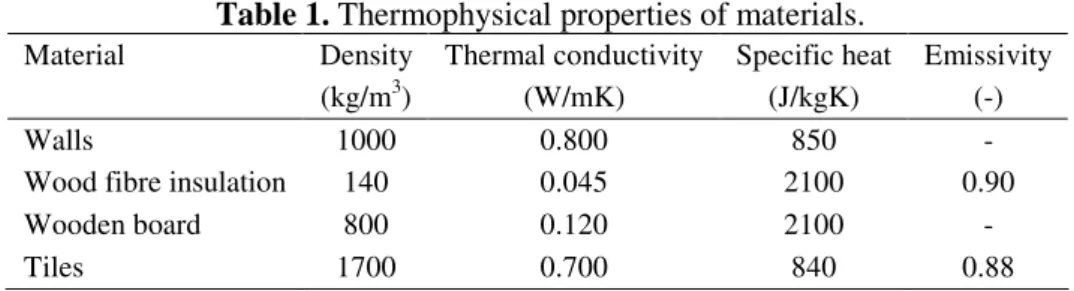
The thermophysical properties are reported in table 1.
Three arrangements of the roof are considered by varying the elements of the base roof structure:
• The ventilated roof (in the following identified as Vperm).
Table 1. Thermophysical properties of materials.
Material Density Thermal conductivity Specific heat Emissivity (kg/m3) (W/mK) (J/kgK) (-)
Walls 1000 0.800 850 -
Wood fibre insulation 140 0.045 2100 0.90
Wooden board 800 0.120 2100 -
Tiles 1700 0.700 840 0.88
• The non-permeable ventilated roof (Vimp), obtained by preventing the airflow through the
tiles, so that the ventilation is limited to the air entering at the eaves section.
• The unventilated roof (Vunv), where eaves and ridge sections are closed.
Commonly in the numerical models the permeability of the roof is neglected [8-13]; however, when it is considered that in true roofs the gap between the tiles even if small is not avoidable, we take Vperm as the reference one.
The whole mesh is composed of triangular linear elements with 1430000 degrees of freedom. To improve the solution, a greater concentration of elements is imposed near and within the ventilation channels, where the minimum size of the triangular elements is set up to 0.2 mm. For each type of roof different mesh resolutions have been tested in order to produce reliable and mesh-independent results.
2.2.Case studies
The analysis is focused on the effects of the wind speed, air temperature and solar radiation on the thermal behaviour of the roof, both in terms of ventilation, heat flux and temperature. The simulations were carried out in steady-state for summer environmental conditions at different time of the day.
A heat flux is applied on the upper surface of the roof tiles, directly exposed to the sun. Based on data available for horizontal surfaces, the solar irradiance on a surface of any orientation and tilt (roof orientation East-West and slope 15°) was calculated according to the method proposed in [14], at hourly scale for the average day of August in Agrigento, a city in southern Italy (37°19' N, 13°30' E). The model is based on daily data of solar radiation. A comparison of the predicted hourly distributions of sun radiation on horizontal surfaces with those measured by the SIAS (Sicilian Information Agro-meteorological Service) at the weather measurement station of Scibica (Agrigento, Italy) shows a very good consistency.
An uniform wind speed profile and an air temperature distribution define the inlet boundary condition in the domain. In the model, wind speed and direction are chosen according to the observations available for the above mentioned location. Wind is supposed entering from the left side (flowing from West to East) of the domain with horizontal direction. The wind speed profile is variable with the altitude, according to the following power law:
α ⋅ = 0 0 z z v v (1)
where v0 is the wind speed at the reference height z0 (10 m), and the parameter α is an empirical
exponent depending on the surface roughness, here representative of an urban area and thus equal to 0.3 [15]. The values of wind speed at reference height and air temperature at the inlet were calculated as the average of the hourly mean values measured in August for three years (2012, 2013, and 2014).
An equivalent convective heat transfer coefficient equal to 1.4 W/(m2K) is applied on the pitched
ceiling; it takes into account both the heat transfer from the ceiling surface and the attic and that from the attic to the room (air at 26 °C).
The data sets for wind and solar radiation used in the simulations are reported in Table 2 for different times of the day (8:00; 12:00; 16:00). Two further cases were simulated at 12:00 (Table 2),
with reduced reference wind speeds: 2m/s for Case 4 and 1.5 m/s for Case 5.
3.Results and Discussion
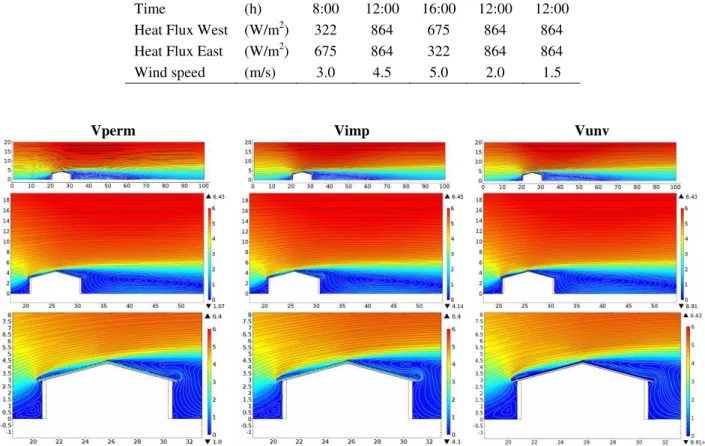
For Case 2 of table 2, examples of velocity field around the building for the three different roof typologies (Vperm, Vimp, Vunv) are shown in figure 3.
The velocity fields are similar for the three roof typologies considered; differences are significant only around and within the ASV, according to the different features of the roof. The wind, blowing from left, hits the building and then recirculates at low speed in the proximity of the vertical left wall. The air rising near the wall is then partially diverted into the batten space. The left roof pitch, west-oriented, is directly exposed to the wind; here, behind the eaves section and above the covering, there is a recirculation zone extended up to half of the left slope. The right roof slope, east-oriented, is downwind and affected by a further air recirculation zone due to the wind blowing over the building. Similar observations are suitable for the other cases (Case 1 and Case 3).
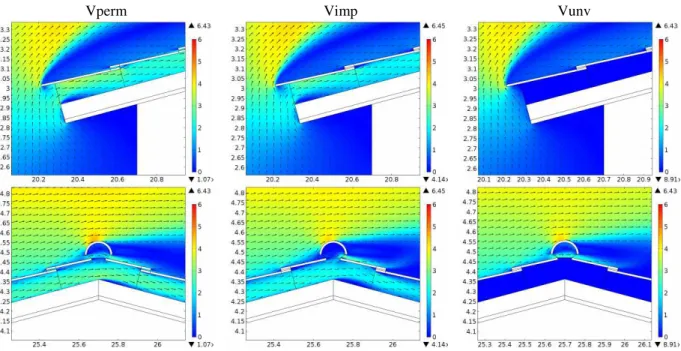
The velocity field around eaves and ridge sections is shown in detail in figure 4 for the three types of roof (Vperm, Vimp, Vunv). As for figure 3, the images in figure 4 refer to Case 2 (12:00) of table 2. The two ventilated roofs (Vperm, Vimp) show a different behaviour near the eaves or in the second half of the roof slopes. Both in the Vperm and Vimp cases, the air flowing into the ASV come only from air rising on the left vertical wall. In the case Vperm a part of it flows out through the interstices among tiles. At the inlet, the air velocity is higher in Vperm than in Vimp. In the second half of the upwind slope of case Vperm, the air flows through the tiles into the batten space. In both the Vperm and Vimp cases only a small part of the air flowing in the batten space flows out through the ridge. A significant flow rate continues along the right-side of the roof.
Table 2. Heat flux on the roof tiles, reference wind speed and air temperature.
Case 1 Case 2 Case 3 Case 4 Case 5 Time (h) 8:00 12:00 16:00 12:00 12:00 Heat Flux West (W/m2) 322 864 675 864 864
Heat Flux East (W/m2) 675 864 322 864 864
Wind speed (m/s) 3.0 4.5 5.0 2.0 1.5
Vperm Vimp Vunv
Figure 3. Velocity magnitude (m/s) for the three different roof typologies (Case 2).
Vperm Vimp Vunv
Figure 4. Velocity magnitude (m/s) at the eaves and the ridge sections (Case 2).
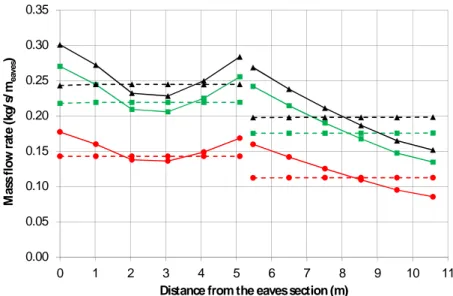
The mass flow rate along the batten space (cases Vperm and Vimp) is shown in figure 5 for all the cases codified in table 2. In figure 5, the ridge is 5.4 m far from the eaves section, at the intersection between right and left roof pitch.
In case Vperm the mass flow rate decreases initially due to the air flowing out through the gaps among the tiles. After the midpoint of the left roof pitch the mass flow rate increases due to the airflow passing through the tiles; it does not recover the inlet value in the whole set of simulated cases. The 5% of the air coming from the upwind part of roof goes out at the eaves, while the remaining flows along the right batten space, going out through the tiles and at the eaves section. The mass flow rate is strongly affected by the external wind conditions. In Case 1 (8:00), characterized by a low wind speed, the mass flow rate at the inlet is 0.18 kg/s (for a width of 1 m); it grows up to 0.3 kg/s in Case 2 (16:00), when higher wind speed occurs.
In case Vimp, the mass flow rate is constant, but different, along the two halves of the roof; the air flowing out at the ridge is about 20%.
In case Vperm the mass flow rate varies along the channels due to the permeability of the tiles. For a comparison with the case Vimp we calculated the average mass flow rate along the channel. The difference between Vperm and Vimp is limited (5.8%, 4.2% and 3.3% in Case 1, Case 2 and Case 3, respectively).
Two further cases are simulated to stress the effect of air permeability in ventilated roofs. These are shown in figure 6. For Case 4 (12:00 and a reference wind speed reduced to 2 m/s), the mass flow rate is 17.6% higher in Vperm than in Vimp. Finally, for Case 5 (12:00 and a further reduction of the wind speed at the reference height to 1.5 m/s), in Vperm the airflow direction is inverted and becomes ascending in the last part of the downwind slope. In Vimp the airflow is ascending in the whole right roof pitch. Moreover, in this case the average mass flow rate is 80% higher in Vperm than in Vimp.
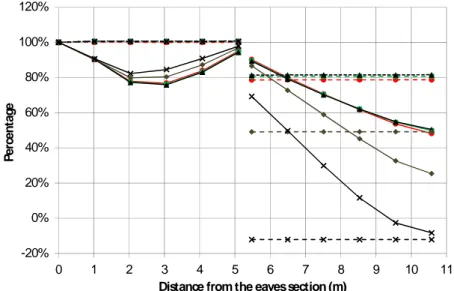
In figure 7 is depicted the ratio between the mass flow along the batten space and that calculated at the inlet. For the permeable roof, Vperm, in the upwind channel an initial decrease of 24% is followed by an increase up to 94% of the inlet mass flow rate. Then, a 5% of the air flowing through the ASV flows out at the ridge. Finally, for the three case1 1, 2 and 3, at the eaves section the airflow is reduced to 50%. In the case Vimp, the leakage at the ridge is about 20%.
If the reference wind speed is reduced, Cases 4 and 5, this behaviour changes significantly. In Vperm, the air flowing out at ridge is 11% and 29% for Case 4 and Case 5, respectively. Moreover,
the decrease of the mass flow rate is more pronounced in the downwind slope under low wind speed conditions. In Vimp an ascending airflow is observed on the left pitch due to the buoyancy forces. In this case, all the air flowing within both the upwind and downwind channels flows out at the ridge.
A reference mass flow rate can be calculated on the basis of the component of the wind speed projected in the direction of the channel and the area of the eaves section. If we compare the mass flow rate calculated at the inlet with the reference one (table 3), a significant decrease is evident in all cases. In Vperm the inlet mass flow rate is an 80% of the reference one, for all the wind conditions. In Vimp the inlet mass flow rate is a 65% of the reference one. However, a more pronounced reduction to 44.2% is observed in Case 5.
With the aim of evaluating the thermal performance of the roof, temperature and heat fluxes on the surface along the roof are calculated for the different cases and roof typologies.
0.00 0.05 0.10 0.15 0.20 0.25 0.30 0.35 0 1 2 3 4 5 6 7 8 9 10 11 M a ss f lo w r a te ( k g /s /m e a v e s )
Distance from the eaves section (m)
Figure 5. Mass flow rate within the ASV. Continuous line: case Vperm; dotted lines: case Vimp.
Symbols:●: Case 1 (8:00); ■: Case 2 (12:00); ▲: Case 3 (16:00).
-0.05 0.00 0.05 0.10 0.15 0.20 0.25 0.30 0.35 0 1 2 3 4 5 6 7 8 9 10 11 M a ss f lo w r a te ( k g /s /m e a v e s )
Distance from the eaves section (m)
Figure 6. Mass flow rate within the ASV. Continuous line: case Vperm; dotted lines: case Vimp.
Symbols: ■: Case 2 (12:00); ♦: Case 4 (12:00); x: Case 5 (12:00).
-20% 0% 20% 40% 60% 80% 100% 120% 0 1 2 3 4 5 6 7 8 9 10 11 P e rc e n ta g e
Distance from the eaves section (m)
Figure 7. Mass flow rate within the ASV with respect to that at the eaves. Continuous line: case
Vperm; dotted lines: case Vimp. Symbols: :●: Case 1 (8:00); ■: Case 2 (12:00); ▲: Case 3 (16:00); ♦: Case 4 (12:00); x: Case 5 (12:00)
Table 3 Comparison between reference and inlet mass flow rate.
Mass flow rate (kg/s)
Vperm Vimp
Case
Reference Inlet Reduction Reference Inlet Reduction 1 0.22 0.18 20.3% 0.22 0.14 35.8% 2 0.33 0.27 19.2% 0.33 0.22 34.9% 3 0.37 0.30 18.8% 0.37 0.24 34.4% 4 0.15 0.12 20.2% 0.15 0.09 36.4% 5 0.12 0.09 22.1% 0.12 0.05 55.8%
In table 4 the average heat fluxes are reported, calculated on the upwind and downwind pitch of the roof and on the lower surface of the ceiling. The air-flow within the ASV reduces the heat fluxes on both roof pitches, regardless of the case considered. In the unventilated roof (Vunv), the heat flux is more than twice of that in Vperm and Vimp. In Case 2 (12:00 and maximum solar radiation), the heat flux calculated on the upwind side is three times higher in Vunv than in Vperm. The heat flux in Vperm and Vimp is always higher downwind than upwind, even for Case 3 (16:00), although the lower solar radiation downwind. In this case, the air is heated up by the tiles while flowing within the upwind roof slope; then heating continues along the batten space in the right-side. On the contrary, for Case 3, in Vunv the heat flux is lower downwind than upwind. The air-permeability is responsible of a significant reduction of the heat fluxes in all the cases. The more the inlet mass flow rate is high, the more Vperm and Vimp show similar values.
In terms of heat fluxes on the ceiling and by taking Vimp as the reference case, the total heat flux (upwind and downwind) in Vperm is about 6.7% and 6% lower than in Vimp, for Case 1 (8:00) and Case 2 (12:00), respectively. For Case 3 (16:00) this difference is reduced to 4% (5.5% upwind, 2.5% downwind), when the average mass flow rate on the downwind roof slope is similar for Vperm and Vimp.
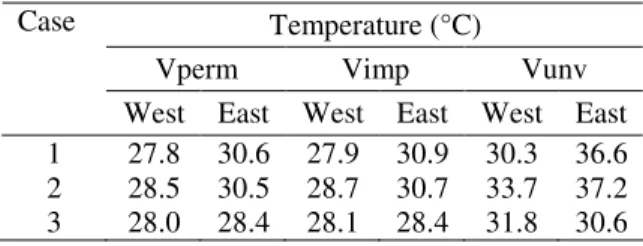
In table 5 the average temperature, calculated on the upwind and downwind pitch of the roof, is reported. The air-flow within the ASV reduces the temperature on both roof pitches, regardless of the case considered. This reduction is higher upwind than downwind, where the mass flow rate decreases. In terms of temperature the effect of the permeability of the roof is not particularly significant.
Table 4. Average heat flux on the ceiling.
Heat flux (W/m2)
Vperm Vimp Vunv
Case
West East Ceiling West East Ceiling West East Ceiling 1 2.5 6.5 4.7 2.7 7.0 5.0 5.8 14.9 10.7 2 3.6 6.3 5.1 3.9 6.7 5.5 10.8 15.8 13.8 3 2.9 3.3 3.2 3.0 3.4 3.3 8.2 6.5 7.6
Table 5. Average temperature on the ceiling.
Temperature (°C)
Vperm Vimp Vunv
Case
West East West East West East 1 27.8 30.6 27.9 30.9 30.3 36.6 2 28.5 30.5 28.7 30.7 33.7 37.2 3 28.0 28.4 28.1 28.4 31.8 30.6
4.Concluding Remarks
A numerical approach was followed to evaluate the summer performance of a ventilated pitched-roof in comparison with an unventilated roof, by means of a finite element numerical code, solving the thermo-fluid problem in 2D and under realistic boundary conditions. The performance was evaluated by taking into account the air-permeability of the tiled covering.
In ventilated pitched roofs the mass flow rate within the ASV is strictly linked to the external wind conditions. The upwind eaves section behaves as an air intake and air flows along the whole batten space. As the wind speed decreases, buoyancy forces due to variation in air density have an increasing effect on the ASV behaviour and in our geometry become dominant for 1.5m/s. In this case a reversed flow in the downwind pitch can be observed.
The air permeability of the tiled covering increases the mass flow rate along the ventilation channel. The airflow is higher in the permeable ventilated roof than in the impermeable one. The difference becomes more relevant when the wind speed is low.
The presence of an ASV reduces the heat flux on the ceiling with respect to an unventilated roof, under the considered boundary conditions and with the same thermal insulation. As a consequence, the temperature of the ceiling surface is lower and a better indoor thermal comfort is experienced. In terms of calculated heat flux, the thermal performance of a ventilated roof is enhanced by the air permeability of the tiled covering (-6% in comparison with a non-permeable ventilated roof). This benefit becomes more pronounced (up to -20%) when wind speed is low. This could lead to the consideration that the permeability loses its effectiveness beyond a certain wind speed.
Anyway, the ventilation layer in pitched roofs is effective in reducing the solar heat gain in summer and an improvement of indoor thermal comfort is thus expected.
Finally, ASV could be regarded as an effective solution for a significant energy saving, allowing short payback period of the additional costs.
5.References
[1] Patania F, Gagliano A, Nocera F, Ferlito A and Galesi A 2011 Energy Analysis of Ventilated
Roof Sustainability in Energy and Buildings eds R J Howlett, L C Jain, S H Lee (Berlin: Springer) pp 15-23
[2] Schunck E, Oster H J, Barthel R and Kießl K 2003 Roof Construction Manual: Pitched Roofs
(Basel: Birkhauser)
[3] Endriukaityte A, Monstvilas E and Bliudzius R 2005 The impact of climate parameters on air
movement in ventilated roofs air gap Improvement of Buildings' Structural Quality by New
Technologies eds C Schauer, F Mazzolani, G Huber, G de Matteis, H Trumpf, H Koukkari, J
P Jaspart, L Bragan (London: Taylor & Francis) 573-578
[4] Lee S, Park S H, Yeo M S and Kim K W 2009 An experimental study on airflow in the cavity
of a ventilated roof Building and Environment. 44 1431-1439.
[5] Dimoudi A, Androutsopoulos A and Lykoudis S 2006 Summer performance of a ventilated roof
component Energy and Buildings 38 610-617.
[6] D’Orazio M, Di Perna C, Principi P and Stazi A 2008 Effects of roof tile permeability on the
thermal performance of ventilated roofs: Analysis of annual performance Energy and
Buildings 40 911-916.
[7] Sandberg M and Moshfegh B 1998 Ventilated-solar roof airflow and heat transfer investigation
Renewable Energy 15 287-292.
[8] Gagliano A, Patania F, Nocera F, Ferlito A and Galesi A 2012 Thermal performance of
ventilated roofs during summer period Energy and Buildings 49 611-618.
[9] Bianco V, Diana A, Manca O
and Nardini S 2016
Thermal Behavior Evaluation of Ventilated Roof under Variable Solar Radiation Int. J. Heat Techn. 34 S346-S350.[10] De With G, Cherry N and Haig J 2009 Thermal Benefits of Tiled Roofs with Above-sheathing Ventilation Int. J. Building Physics 33 171-194.
[11] Miller W, Keyhani M, Stovall T and Youngquist A, 2007 Natural Convection Heat Transfer in Roofs with Above-Sheathing Ventilation Thermal Performance of the Exterior Envelopes of
Buildings: Proc. of ASHRAE THERM X, Clearwater, FL, Dec. 2007, ASHRAE.
[12] Ciampi M, Leccese F and Tuoni G 2005 Energy analysis of ventilated and microventilated roofs
Solar Energy 79 183-192.
[13] Villi G, Pasut W and De Carli M 2009 CFD modelling and thermal performance analysis of a wooden ventilated roof structure Building simulation 2 215-228.
[14] Duffie F and Beckman W, 1991 Solar engineering of thermal processes (New York: John Wiley and Sons).
[15] Masters G M 2004 Renewable and Efficient Electric Power Systems (New York: John Wiley and Sons).
6. Acknowledgments
The meteorological data used was kindly furnished by S.I.A.S. Servizio Informativo Agrometeorolo-gico Siciliano, viale Regione Siciliana, 4600, 90145 Palermo.