GEOBASI: The geochemical Database of Tuscany Region (Italy)
GEOBASI: Il Database geochimico della Regione Toscana
Brunella Raco, Antonella Buccianti, Manuela Corongiu, Guido Lavorini, Patrizia Macera, Francesco Manetti, Riccardo Mari, Giulio Masetti, Stefano Menichetti, Barbara Nisi, Giuseppe Protano, Stefano Romanelli
Ricevuto: 15 dicembre 2014 / Accettato: 3 marzo 2015 Pubblicato online: 31 marzo 2015
This is an open access article under the CC BY-NC-ND license: http://creativecommons.org/licenses/by-nc-nd/4.0/
© Associazione Acque Sotterranee 2015 Antonella BucciAnti
Università Firenze, Dip. Scienze della Terra via La Pira 4, Firenze - tel.0552757493 [email protected]
Brunella RAco, Giulio MAsetti Barbara nisi
CNR-IGG, Ist. Geoscienze e Georisorse via Moruzzi 1, Pisa - tel.0506212320 [email protected] [email protected] Manuela coRonGiu, Francesco MAnetti stefano RoMAnelli C. LaMMA
via Madonna del Piano 10, Sesto Fiorentino - tel.0554483075 [email protected]
Riccardo MARi C. LaMMA, CNR Ibimet
via Madonna del Piano 10, Sesto Fiorentino - tel.0554483029 [email protected]
stefano Menichetti ARPAT SIRA
via N. Porpora 22, Firenze - tel.0553206333 [email protected]
Giuseppe PRotAno Università Siena, DSFTA
via Laterina 8, Siena - tel.0577233950, [email protected]
Guido lAvoRini Regione Toscana, SITA
via di Novoli 26, Firenze - tel.0554383955, [email protected] Patrizia MAceRA
Università Pisa, Dip. Scienze della Terra via Santa Maria 53, Pisa - tel.0502215792 [email protected]
Parole chiave: dati geochimici, database, analisi statistica, sistema
informativo geografico, geostatistica.
Keywords: geochemical data, database, statistical analysis, geographical information system, geostatistics.
Riassunto: In questo lavoro sono illustrate le varie fasi di atti-vità svolte da un gruppo di lavoro costituito da ricercatori e fun-zionari delle università toscane (Firenze, Pisa e Siena), del CNR di Pisa (Istituto di Geoscienze e Georisorse), dell’ARPAT (Agen-zia Regionale per la Protezione dell’Ambiente della Toscana), del Consorzio LAMMA (LAboratory for Monitoring and Environmental
Modeling for the Sustainable Development) e del Sistema
Informati-vo Territoriale e Ambientale della Regione Toscana; il laInformati-voro ha avuto come obiettivo la realizzazione del Database Geochimico Regionale (DBGR), chiamato GEOBASI.
GEOBASI si propone come uno strumento in grado di raccoglie-re tutta l’informazione di natura chimica (composizionale e iso-topica) di differenti matrici geologiche, solide, liquide o gassose campionate nel territorio toscano. L’obiettivo è di contribuire ad uno sviluppo strutturato delle conoscenze dei processi geochimi-ci alla base della variabilità chimica dei materiali geologigeochimi-ci. Nella prima fase del progetto le attività sono state orientate a favorire la piena fruizione di dati disaggregati già disponibili tramite una potente interfaccia Web-GIS e ad implementare l’u-tilizzo di strumenti grafico-numerici di analisi statistica esplora-tiva mediante i quali: 1) comprendere la variabilità del fenomeno oggetto di studio; 2) individuare la posizione geografica di classi di valori o di singoli campioni; 3) confrontare gli esiti di diver-se metodologie analitiche sperimentali per uno stesso analita; 4) estrarre dati relativi ad un determinato periodo temporale e/o area e 5) verificare l’impatto della presenza di informazione nu-merica con valore inferiore al limite di rilevabilità strumentale. Lo sviluppo del progetto prevede la definizione di regole e stru-menti finalizzati a una continua e progressiva implementazione controllata del database, al fine di evitare il danneggiamento dell’informazione già presente, anche in previsione di un utilizzo interattivo della risorsa da soggetti esterni.
E’ inoltre in corso uno studio di dettaglio dell’area di Scarlino-Follonica con l’obiettivo di potenziare i metodi grafico-numerici di analisi statistica e geostatistica, avvalendosi di software open
source (QGIS e R), al fine di supportare il processo
d’individua-zione della così detta “geochemical baseline” per un dato analita. Abstract: In this study the new Regional Geochemical Database
(RGDB), called GEOBASI, is presented and illustrated in the frame-work of a joint collaboration among the three Tuscan universities (Flor-ence, Pisa and Siena), CNR-IGG (Institute of Geosciences and Earth Resources of Pisa), ARPAT (Regional Agency for the Environmental Protection), LAMMA (Environmental Modelling and Monitoring Laboratory for Sustainable Development) Consortium and S.I.R.A.
(Territorial and Environmental Informative System of Tuscany). The database has permitted the construction of a repository where the geo-chemical information (compositional and isotopic) has been stored in a structured way so that it can be available for different groups of users (e.g. institutional, public and private companies). The information con-tained in the database can in fact be downloaded freely and queried to correlate geochemistry to other non compositional variables.
The first phase of the project was aimed at promoting the use of the geo-chemical data already available from previous investigations through a powerful Web-GIS interface to implement the exploratory statistics graphical-numerical tools used to: 1) analyse the spatial variability of the investigated context, 2) highlight the geographic location of data per-taining to classes of values or single cases, 3) compare the results of dif-ferent analytical methodologies applied to the determination of the same element and/or chemical species, 4) extract the geochemical data related to specific monitoring plans and/or geographical areas, and finally 5) recover information about data below the detection limit to understand their impact on the behaviour of the investigated variable.
Developments of this project will be focused on the definition of rules and standardized methods in a way that external users could also in-teractively pursue the RGDB. Furthermore, a detailed investigation of the Scarlino-Follonica plain will permit the improvement and test of statistical and geostatistical methods, using open source software (QGIS and R) to support the process of evaluation of the geochemical baseline.
Introduction
The identification of the natural geochemical baseline for chemical elements or compounds is a fundamental step to understand how natural processes work and to identify per-turbations due to anthropic factors. This knowledge is useful to guide political decisions concerning the management of environmental problems (e.g. quality of drinkable water, rec-lamation of polluted sites).
Notwithstanding the developments in this field of inves-tigation, due to the pressure on the use of natural resources, a shared protocol from field sampling to statistical analysis, has not yet been clearly adopted. One of the difficulties is to relate the results of the scientific research published on peer-reviewed journals to application studies whose results are reports of public agencies not widely diffused in the sci-entific community. The consequence is that, as discussed in Gałuszka (2005, 2006, 2007), the terms baseline and back-ground do not have a commonly accepted definition. In fact sometimes they are used interchangeably, while at other times background is used to describe only “natural” condi-tions, meaning those that are a result of the local conditions such as geology, climate, hydrology, without reference to the influence of anthropogenic activity (Reimann and Gar-rett, 2005; Rodrigues and Nalini Júnior, 2009). The defini-tion used in the FOREGS (Forum of European Geological Surveys) project refers to the baseline as the concentration at a specific point in time of a chemical element, species or compound in a sample of geological material (Salminen et
al, 2005; De Vos et al. 2006; Johnson and Ander, 2008). Recently several authors have spoken about a baseline study as simply defining the “pre-operation exposure” conditions for the set of indicators that will be used to assess achievement of the outcomes and their impact expressed in the program’s logical framework (Ander et al., 2013; Levitan et al., 2014). When compared with the condition of the same indicators at some point during implementation (mid-term evaluation) and post-operation implementation (final evaluation) the baseline study forms the basis for a “before and after” assessment or a “change over time” assessment. Without baseline data to evaluate pre-operation conditions for outcome and impact indicators it is difficult to establish whether change at the outcome level has in fact occurred.
In the last twenty years public institutions devoted to the monitoring of the surficial Earth have focused their attention of this theme with the aim to recognise, prevent and reduce the pollution of the environment (e.g. US EPA, www.epa.gov; EEA European Environment Agency, www.eea.europa.eu/; FOREGS, Forum of European Geological Survey, http://wep-pi.gtk.fi/publ/foregsatlas/ForegsData.php). In this framework particular attention has been devoted to the protection of hy-drological resources whose chemistry is attributable to natu-ral water-rock interactions. The importance of this research has long been recognised by the Italian authorities so that it has been formalised through specific acts (Law n. 752, 6 Oc-tober 1982). The first formal project dates back to 1996 when the Italian National Research Council (CNR) constituted an ad-hoc Commission for geochemical cartography (ordinance n. 14021, September 1996), followed by strategic long-term plans also financed at Ministerial level. Through the contri-bution of these projects a dynamic National Geochemical Archive (NGA) was created with the aim to associate under the same framework the geochemical properties of elements and compounds with geolithology and any other information about the territory (Ottonello and Serva, 2003). The valida-tion and integravalida-tion of the geochemical data collected under the NGA concerning Tuscany Region has formed the starting point for the development of the GEOBASI project (Bottaini et al., 2011; Buccianti et al., 2011; Buccianti et al., 2014).
At the present time the determined baseline values are often compared with concentrations representing a contami-nation threshold. These reference levels have been defined at national level (D.Lgs. 152/06) and acknowledge European directives adopting USA and Canadian laws. By considering this, it is important to clearly define the concept of baseline and its link with the spatial distribution of the data as well as with the conceptual model of the processes affecting the territory. However, the starting point to achieve good results is related to the completeness of the numerical information about chemical concentrations of elements or compounds in different geological media and to its organisation in a dedi-cated dynamic repository. For this reason Tuscany Region’s S.I.T.A (Territorial and Environmental Information System of the Tuscan Region) has financed and organised a working group constituted by geochemists, geologists and
hydroge-ologists of the Universities of Firenze, Pisa and Siena and of the National Research Council, Institute of Geosciences and Georesources (IGG) with the aim of identifying a protocol for managing the geochemical information. This working group has also been joined by the researchers of the LAMMA Con-sortium thanks to their competence in Informatics and to the adequacy of their dedicated hardware and software resources. The participation of researchers of the Regional Agency for Environmental Protection has also been fundamental to un-derstand the needs of public institutions called upon to han-dle emergencies concerning contamination problems.
In this framework the database GEOBASI was proposed as a direct access user service, accessible to different levels of users, whose contents could be freely queried and downloaded (http://www506.regione.toscana.it/geobasi/index.html). The aim was to give reference knowledge on the geochemical com-position of different geological media, solid (soils and stream sediments), liquid (stream and ground waters, springs, lakes) and gaseous (natural emissions). In a first phase the work was oriented towards the aggregation of the information already available, but fragmented in several files, through a power-ful Web-GIS interface and subsequently towards the use of univariate methods of statistical analysis to explore data behaviour. Following a guided path it is possible to imme-diately analyse the variability of a given element/species. In the database the different experimental procedures related to the determination of the same chemicals represent the most important source of heterogeneity, and box-plots are used to visualise the variability of the different analytical methods. In fact only after having chosen a specific analytical method, a histogram or a cumulative curve can be obtained and the spatial location of classes of values or single cases visualised. The procedure can be repeated transforming the data by us-ing the logarithm function or choosus-ing a delimited portion of the Region or a defined interval of time.
The project illustrated herein is the actual development of the NGA and the GEOBASI PRAA 2009, the latter financed by Tuscany Regional Government (Regional Plain of Envi-ronmental Action, Target E, Preservation of the hydrological resources, Buccianti et al., 2011). Starting from the obtained results it aims to organise and structure the geochemical in-formation so that it can be used for several purposes. While updating and populating the database with old and new data from different sources at the regional scale, an area has been chosen as a case study for geochemical characterisation, im-plementation of the graphical-numerical tools and definition of a protocol to support the identification of the geochemical baseline. In this case study sampling, experimental analysis and statistical treatment were under control and followed shared paths among all the participants in the project. The area chosen by the working group is the coastal plain and the hydrographical basin of Follonica-Scarlino (southern Tusca-ny). For this portion of the regional territory both the old and the newly produced geochemical information were inserted into the database and associated with geological, hydrological and land use information, thus implementing the conceptual
(and numerical) model of the system as a whole. Comparisons with the regional context for the same geochemical variables have also been planned. The inclusion of old well-structured information in the repository has permitted an adequate new sampling strategy, with efficiency in time and costs
Materials and methods
Compilation of existing data and multi-source updating
One of the main requirements that we had to take into account was to obtain a complete collection of existing geo-chemical information. Old data collections were specifically recorded as metadata fields. Basically, the reference archives were:
• The National Geochemical Archive (NGA);
• The Geobasi project – Tuscany, Regional Plain of Envi-ronmental Protection - PRAA 2009 following Target E devoted to the safety of hydrological resources;
• Surficial and ground waters monitoring and sampling (MAT – Monitoring groundwaters and aquifers, and MAS – Monitoring internal surficial waters) carried out by ARPAT, the Regional Agency for the Environmental Protection.
As a first step all the different kinds of existing data were re-organised into the new database even though at the moment it is not completely available for further analysis, as the col-lection of more information about origin/generation of some samples is still pending. The problems arising from work-ing with the incorporation of data from different archives has opened the question about how to plan the continuous updat-ing of the dataset with new information if diverse sources are expected (Fig. 1). To answer this issue, integration methods and semantic test evaluation functions have been constructed in order to verify data compatibility between existing and new updated information. More specifically, the same ap-proach followed for the download of a selection of the dataset has been applied, implemented with a graphical-numerical comparison procedure between the new information and that already contained in the GEOBASI repository.
The uploading procedure of a new dataset, currently being developed, is possible thanks to a format of interchange (CSV, Comma Separated Value) similar to that of the download-ing, currently operational. Its implementation will be realised through the same interface, open source software and services of the Lamma Consortium geoportal (Giannecchini et al., 2013).
Data accessibility, analysis of the information and interoperability
The validation process and accessibility requirements work in a similar way during the query formulation phase on the web interface. With the aim of taking this duality into ac-count, a specific design of the web interface was developed to handle the requirements of clients and non-database adminis-trators on different access levels. Functions for using temporal and spatial dimensions were also implemented, thus allow-ing the analysis of the geochemical information in relation to
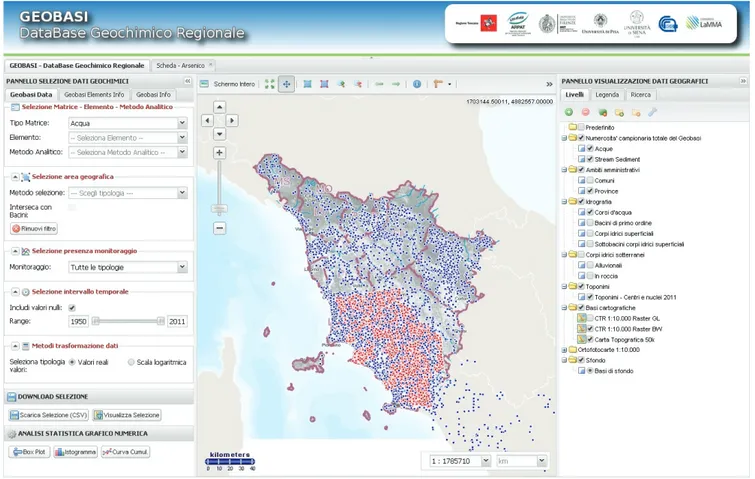
Fig. 1 - Visualizzazione dell’interfaccia utente. I punti blu e rossi rappresentano rispettivamente i campioni disponibili per acque e sedimenti fluviali. Fig. 1 - Visualisation of the user interface. Blue and red dots represent the available samples for water and stream sediment compositions.
geology, land use, and the hydrological network, considering also accuracy and scalability requirements.
The web interface was constructed and implemented ac-cording to the Open Geospatial Consortium (OGC) stan-dards (www.opengeospatial.org) focusing on research, query and view, then integrating these into a complex system where the comparison of the old information with the new uploaded one can be performed by the use of trigger procedures.
The analysis of the regionalised variables is in progress, eval-uating the feasibility in a Web Processing Service (WPS) of analysing the uploaded information with the aim to discover errors and omissions in coordinates and in the metrical units of the geochemical data. In all phases particular attention was dedicated to underlining the presence of zero values (or nega-tive values) instead of the respecnega-tive analytical detection limit, to making comparisons among different analytical methods used to determine the same chemicals, to verifying the spatial coverage for the different geological media, and to integrat-ing and linkintegrat-ing together different information sources. As an additional feature, the surveyed data were distinguished from those derived from different geographical datasets.
On the whole, the core of the database is made up of prima-ry chemical analysis, while derived information is useful for qualitative and functional evaluation in a territorial context.
It is important to stress here that all the problems encoun-tered in the organisational phase of the database structure, as well as the strategies adopted for their solution, have allowed us also to define new tactics for future development (Fig. 2).
The web interface is compliant with the Inspire System which establishes an infrastructure for spatial information in Europe to support Community environmental policies, and for policies or activities which may have an impact on the environment (Fig. 3, http://inspire.ec.europa.eu/). As a matter of fact, the Geobasi interface adopts the Tuscany Regional Government OGC web services and uses this application for its own necessities and statistical processing, based on the Geoscopio, the Web-GIS tool by which the geographical data of Tuscany Region can be queried and visualised (http://www. regione.toscana.it/-/geoscopio). Thus orthophotos, topograph-ic maps, geographtopograph-ical boundaries of administrative units, information about hydrological network, geology, land-use, pedology and all the other layers that constitute the Regional Database of Geographical Information are available. This op-erating schema highlights how the Geobasi project fits well into the general strategy of the Tuscany Regional Govern-ment to use an open data – open knowledge approach.
In figure 4 a general schema of the DB repository and the Web-GIS services interconnections is reported.
Fig. 2 - Schema della struttura del database. Fig. 2 - Schema of the database model.
Fig. 3 - Sistema federato di accesso all'infrastruttura geografica della Regione Toscana.
Fig. 3 - Federated data-less system of the Tuscany Regional Government.
Fig. 4 - Schema delle interconnessioni tra GEOBASI e input attraverso Web-GIS. Fig. 4 - Interconnections between GEOBASI and Web-GIS input.
The integration between the geographical database and statistical analysis tools
Starting from the information store in the repository DB it is possible to query the behaviour of a chemical element or compound for a given geological media by the use of vari-ous univariate statistical graphical and numerical univariate tools. The results can be related to the regionalisation of the analysed data. Thus it is possible to link the chemical abun-dance of a chosen element in the different geological media with the geology, the land cover or the soil nature. Moreover, any other useful information about the behaviour of a given chemical element and sources (natural and anthropical as well as hazardous limits) is reported in a pdf file easily visualised or downloaded. Furthermore, the distribution of the element on a Europe scale can also be visualised thanks to a link with the maps of the FOREGS database (Salminen et al., 2005; De Vos et al., 2006) so that a comparison between the range of values reported in GEOBASI and those registered in Europe can be performed. At the moment this facility is activated for a limited number of elements but work is in progress.
When the GEOBASI portal is visited, it is possible to choose the appropriate geological material discriminating among solid (stream sediments) or liquid (waters and/or type of water) and, according to the selected variables, to generate comparative box-plots to identify the amount of variability attributable to different analytical methods, the most impor-tant source of heterogeneity of the repository. Then, after hav-ing chosen a specific analytical method a frequency histogram or a cumulative curve can be plotted visualising the spatial position of classes of values or single cases. The analysis can be repeated after having transformed the data by using the
logarithm function or after having selected a specific portion of the Region or a defined time interval.
Examples for Ca2+ (mg/L) in water are reported in figure
5a. If the pdf file containing information about Ca is opened and visualised it is possible to see that this element belongs to group 2 of the periodic table, along with Be, Mg, Sr and Ba. It has an atomic number of 20, an atomic mass of 40, one oxida-tion state (+2) and six naturally occurring isotopes. Calcium generally has a high mobility and, except under strongly al-kaline conditions, occurs in solution as dissociated Ca2+ ions.
Concentrations generally grow with stream order as a result of increasing contact time between water and soil or rock. The main anthropogenic activity that would lead to an increase
of Ca in the drainage system is the long-established agricul-tural practice of liming land to correct for soil acidity. Other anthropogenic sources of calcium include cement factories, fertilisers and dust, although geogenic sources are much more important than anthropogenic ones in the environment (Rei-mann and de Caritat 1998). Calcium values in stream water of Europe range over three orders of magnitude, from 0.02 to 592 mg/L, with a median value of 40 mg/L (http://weppi.gtk. fi/publ/foregsatlas/ForegsData.php, Salminen et al., 2005; De Vos et al., 2006) while in the GEOBASI values range from 0.7 to 952 mg/L up to 2000 mg/L if anomalous values are considered (median equal to 102 mg/L).
The diagrams of figure 5 have been implemented thanks
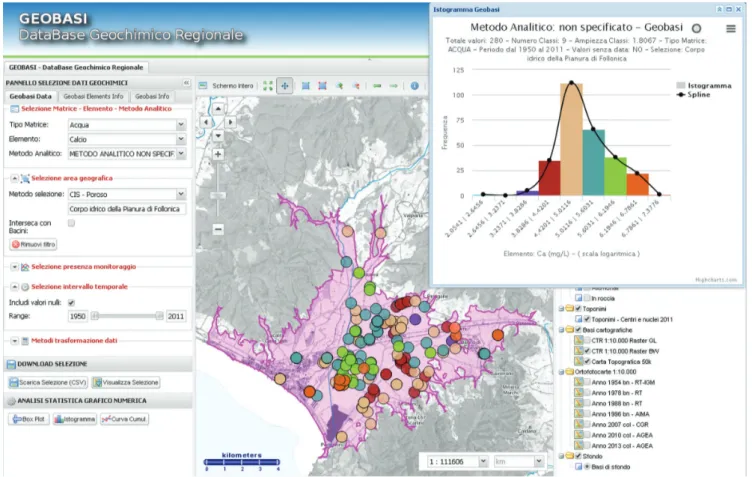
Fig. 5a - Interazione tra strumenti statistici grafico-numerici ed interfaccia Web-GIS. Diagrammi a scatola, istogrammi di frequenza e curve cumulative sono strumenti fondamentali per studiare il comportamento di una variabile geochimica. La posizione spaziale dei dati appartenenti ad ogni classe dell’istogramma può essere interattivamente visualizzata sulla mappa. L’esempio riguarda il contenuto di Ca2+ (mg/L) nelle acque naturali.
Fig. 5a - Interaction between statistical tools and Web-GIS interface. Box-plot, frequency histogram and cumulative curve are the fundamental tools to investigate the behaviour of a geochemical variable. Interactively the spatial position of the data pertaining to each class of the histogram can be visualised with dots of the same colour as the bars. Examples concern the abundance of Ca2+ (mg/L) in water.
Fig. 5a - Figura destra.
Fig. 5a - Figura centrale.
Fig. 5a - Figura sinistra.
Fig. 5a - Right figure.
Fig. 5a - Central figure.
to the use of the open source libraries of Highcharts (http:// www.highcharts.com) written in pure JavaScript, offering an easy way of adding interactive charts to web site or web appli-cation. As we can see, when a chemical variable and a geologi-cal media is chosen, comparative box-plots (Fig. 5a, left) give us information about which type of analytical methods were used, the total number of available observations, the metric unit and the median for the whole data set. If some detailed choice was previously performed selecting an area of the re-gional territory or a specific time interval, the plot report will include these indications. When an analytical method is selected, a frequency histogram can be plotted (Fig. 5a, central). As we can observe, the classes of the histogram, ob-tained following Sturge’s rule, are coloured differently, and by maintaining this colour discrimination their geographical visualisation is obtained. In this way it is possible to see im-mediately if the modal class is diffused or spatially clustered
Fig. 5b - La posizione spaziale dei valori anomali bassi per il contenuto di Ca2+ (mg/L) relativi ad uno specifico metodo analitico e identificati mediante
il diagramma a scatola (sinistra, scala logaritmica) può essere visualizzata su una mappa.
Fig. 5b - Anomalous low values for Ca2+ (mg/L) in water identified on box-plot for a
specific analytical method (left, logarithmic scale) and their position on the map. and if the less populated classes of the tails are related to spe-cific portions of the regional territory. Dispersed and localised spatial processes can be consequently identified. A spline con-nects the mean value of each class giving us an idea about the continuous changes in the frequency density thus helping in the identification of complex multimodal phenomena.
The cumulative curve on the right of figure 5a-right is use-ful to identify the presence of anomalous data, comparing their values with the 95th percentile line reported above (red
line). The analysis of the slope changes in the curve is also useful to verify if the behaviour of the investigated chemicals is fragmented and if multimodality better represents the in-vestigated phenomena.
The previous graphical-numerical analysis can also be per-formed after having transper-formed the data by using the nat-ural logarithm conversion in order to better visualise their structure. The identification of anomalous values as well as their spatial location is thus facilitated (Fig. 5b).
In the future the same graphical analysis will be imple-mented by using libraries of the open source R software (http://www.r-project.org) since these also contain fundamen-tal tools for the development of geostatistical analysis. Inno-vative graphical and numerical tools will also be developed by taking into account the nature of compositional data as reported by Aitchison (1986). Compositional data are in fact vectors of positive values quantitatively describing the con-tribution of D parts of some whole, which carry only relative information. Due to these features, the Euclidean geometrical approach to the statistical analysis of compositions may give misleading results since compositional data pertain to the simplex sample space and not to the Real one (Egozcue and Pawlwosky-Glahn, 2006; Buccianti and Magli, 2011; Buc-cianti, 2013). The simplex sample space is governed by the Aitchison geometry, and has all the properties of a (D-1) di-mensional Euclidean space (Egozcue and Pawlowsky-Galhn, 2006). To work in these unconstrained conditions, composi-tions need to be expressed as vectors of values that belong to such a space. To obtain these new vectors a family of log-ratio transformations can be used. Several improvements will have to be made to GEOBASI following this new perspective, as a natural way of representing regionalised compositions. Preliminary results and discussion
With the aim to probe the efficiency and validity of the functions developed in the GEOBASI project for the up-loading of new information from a controlled source, a case study area was selected where ground waters were collected, analysed and new numerical data produced. The Follonica-Scarlino plain was chosen and, in particular, the aquifer of the area as well as the network of surficial waters and stream sediments. The integration of the previously available numer-ical data and the new one was performed in tandem with the production of the experimental data by the IGG-CNR of Pisa (water samples) and Siena University (stream sediments).
It has to be stressed here that the new experimental data was collected within a planned sampling design concerning springs, groundwater, stream waters and stream sediments. In this phase the old knowledge stored in the database permit-ted the evaluation of where to collect new samples using the stored indications on the range of values for different chemi-cals and the area covered. The Follonica-Scarlino plain pres-ents a peculiar interest on a regional scale, due to the presence of both point and diffuse sources of pollution whose origin is attributable to both natural and anthropic factors. Conse-quently, these conditions also make the area potentially rep-resentative of the problems that it is possible to encounter when the baseline of a chemical has to be defined. Finally, since a limited portion of the territory is investigated, the ap-plication of geostatistical methods can be evaluated in terms of verifying the presence of spatial continuity, with the aim to constrain the behaviour of geochemical variables in space and to set the boundary conditions of the conceptual model.
More specifically the area was chosen as the ‘case study’ for the following reasons: 1) the hydrographical basin
dimension-ally limited; 2) a geological context where the water-rock in-teraction processes modifying the water chemistry could be identified; 3) the possibility to calculate the mass-balance for elements and compounds on the basin scale; 4) the presence of important natural and anthropic phenomena able to perturb the most frequent and diffused compositions (hot springs, acid drainage from mines, dispersion of waste products due to pyrite manufacturing, presence of well developed soils); 5) the availability of a significant number of wells for drinkable water; 6) the past knowledge about geological and hydrogeo-logical framework as a starting point.
Based on the derivation of existing geochemical informa-tion (about 500 records stored in the GEOBASI database) and on its chemical variability and spatial dispersion of samples, the sampling strategy was planned to assess the future ap-plication of an appropriate geo-statistical approach for esti-mation. The discussion on this item represented also the oc-casion to define a joint protocol for the management of the experimental phase.
The sampling campaigns permitted the measurement of the phreatic surface level for 128 locations and to collect 105 samples of surficial waters (Pecora river, Allaciante canal, and Gora delle Ferriere stream), 65 of groundwaters and more than 10 from the Fiora aqueduct. Measures of pH, tempera-ture, electrical conductivity (EC), alkalinity, as well as of the abundance of Fe2+ and Fe
tot (with dedicated kit) were
deter-mined on site, repeating the measurements for metals also in laboratory.
In particular, the temperature, pH, and EC were measured using Eutech Instruments PCD650 multiparametric probe. Total alkalinity was determined by acidimetric titration using HCl 0.1 N as titrating agent and methylorange as indicator.
Laboratory analyses have permitted to obtain the concen-trations of the main constituents such as Na+, K+, Ca2+, Mg2+,
SO42-, Cl-, of the nitrogen and minor species, NO2-, NO3-,
NH4+, F-, H4SiO4 and of some metals (As, Cd, Co, Cr, Cu, Fe,
Hg, Mn, Ni, Pb, Sb, Tl, V and Zn). In particular: (i) anions were determined using ion-chromatography (Dionex DX-100), whereas, F- was measured using the specific electrode
method (Orion Research EA920); (ii) major dissolved cations and trace metals were determined by AAS Perkin Elmer mod. 3110 and ICP-OES (Perkin Elmer Optima 2000DV), respec-tively; (iii) silica was analysed by molecular spectrophotom-etry using the heteropoly blue method (spectrophotometer Jasco V-530) and (iv) nitrogen species were analysed by mo-lecular spectrophotometry (spectrophotometer Jasco V-530).
In order to have indications about the hydrological cycle of the water fluxes, the hydrogen (δ2H) and oxygen (δ18O)
isoto-pic ratios were determined through mass spectrometer analy-sis by Delta Plus XP (ThermoFinnigan). Analytical precision was better than 0.10‰ and 1‰ for δ18O‰ and δ2H ,
respec-tively. For a selected number of samples the determination of the tritium content, able to indicate the age of the recharge of the different reservoirs, was also performed. Tritium was analysed through measurement of β− decay events in a liquid
a precision of 7 TU. For tritium contents lower than 20 TU, increased precision is gained through concentration by elec-trolytic enrichment of 3H in the water before counting, thus
reaching a precision better than 0.8 TU.
The availability of a detailed stratigraphy for about 200 lo-cations has allowed us to reconstruct the permeability levels for the multistrata aquifer, by estimating their relative vol-umes thus contributing to constrain the conceptual model of the geochemical system.
In figure 6 the limits of the hydrological body of the Fol-lonica-Scarlino plain are visualised. The coloured dots cor-respond to the different classes of the frequency histogram referring to the Ca abundance (mg/L) in groundwater as re-ported on the right.
In figure 7 some of the other features of the GEOBASI proj-ect are illustrated considering, as an example, the spatial dis-tribution of As (mg/L) in the waters of the Follonica-Scarlino plain for the already available data. Arsenic, along with P, Sb and Bi, is a chemical element belonging to group 15 of the periodic table. The element has an atomic number of 33, an atomic mass of 75, three main oxidation states (-3, +3 and +5) and one naturally occurring isotope (75As). The chemistry and geochemistry of As is most similar to that of Sb. Arse-nic is strongly chalcophile, and is partitioned into a variety
Fig. 6 - Caso studio dell’area della piana di Follonica-Scarlino. I punti con differenti colori sono associati alle diverse classi dell’istogramma di frequenza per il contenuto di Ca2+ (mg/L) per i dati disponibili per le acque naturali.
Fig. 6 - Case study area of Follonica-Scarlino plain. Dots in different colours are related to the different classes of the frequency histogram for Ca2+ abundance (mg/L) for the
available water data.
of sulphide and sulpharsenide minerals, notably arsenopyrite FeAsS, but also realgar AsS and orpiment As2S3. Even if As
minerals and compounds are readily soluble, As migration is greatly limited, because of strong sorption by clays, hy-droxides and organic matter; the latter may have a marked influence on the measured As concentration (Reimann et al. 2003). Arsenic values in stream water of Europe range from <0.01 to 27.3 µg/L, over three orders of magnitude, with a median value of 0.63 µg/L (http://weppi.gtk.fi/publ/foregsat-las/ForegsData.php). The arsenic distribution in Europe re-sembles generally the distributions of Mo, Sb, Se, U and V, although concentrations in alkaline stream water in the Medi-terranean region tend to be enhanced. The distribution of As in stream water is most similar to patterns of major ions and associated elements, controlled mostly by exogenic and less geogenic factors, but also to felsic element patterns explained by geogenic sources of As in central and southern Europe.
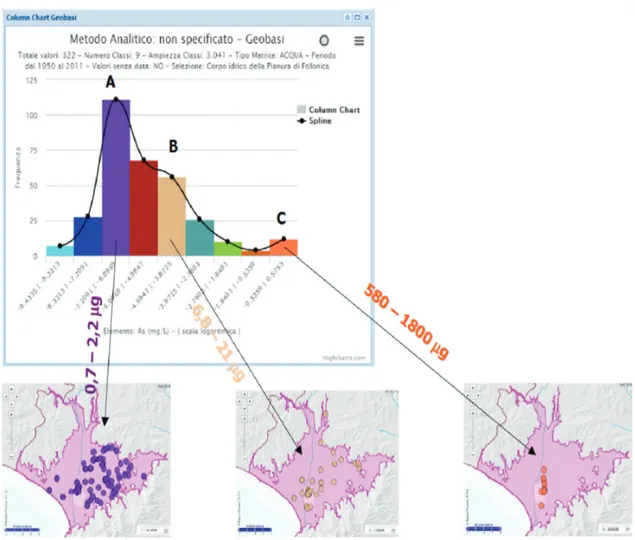
As we can see (Fig. 7), the spatial visualisation of selected classes of a complex frequency distribution, for example A, B and C, can be performed. Moreover, it is possible to evaluate if the classes of the histogram contain or not some reference values, as for example those proposed by ARPAT for the As natural background (VNF = valori fondo naturale) and the admissible background (VFA = valori di fondo ammissibili)
values. For example in figure 7 the upper values of classes A and B are lower than VNF = 5.5 µg/L and VFA = 23 µg/L, respectively, and the samples are spatially distributed. On the other hand, class C apparently contains point sources to be related with local phenomena.
As a further step, methods to analyse the spatial dimen-sion of geochemical phenomena will be developed and imple-mented creating and/or executing R scripts for geostatistical analysis in QGIS, a free Open Source Geographic Informa-tion System (www.qgis.org). The aim is to focus the attenInforma-tion on the identification of a possible baseline whose significant identification cannot be performed without the analysis of the spatial continuity of the investigated phenomena.
Conclusions and future developments
The widespread use of hazardous substances in several anthropic processes (e.g. industry and agriculture), legal or illegal, has compromised the use of the territory and of its resources both in developed and underdeveloped countries
Fig. 7 - Applicazione degli strumenti del GEOBASI per l’area pilota della piana di Scarlino-Follonica. E’ analizzata la distribuzione di frequenza dell’As (mg/L) e visualizzata la distribuzione spaziale dei dati presenti nelle varie classi dell’istogramma. I valori superiori delle classi A e B sono inferiori ai valori di fondo naturale (VFN = 5.5 mg/L) e di fondo ammissibile (VFA = 23 mg/L) come proposti da ARPAT.
Fig. 7 - Application of the GEOBASI tools for the pilot area of the Follonica-Scarlino plain. The frequency distribution of As (mg/L) in waters is analysed and the spatial distribu-tion of data of selected classes visualised. The upper values of classes A and B are lower than the ARPAT proposed VNF = 5.5 µg/L and VFA = 23 µg/L values (VFN = natural background values; VFA = admissible background values). .
of the world. For this reason knowledge about the distribu-tion of dangerous elements or compounds is fundamental and different public institutions on international and national scale have attempted to control this problem through spe-cific acts and laws. The starting point is however related to the organisation and management of the available geochemi-cal information and to the possibility of integrating it with geographical, geological and hydrogeological complements. Several types of geological media (e.g., waters, soils, stream sediments, gases) are in general the subjects of a great number of research products or public monitoring plans, on different scales. Often the quality of the measurements may be differ-ent but all the works have as a common aim to give a picture of the state of the investigated environment. If this available information can be integrated and validated in a dedicated dynamical repository, as well as updated in time, our knowl-edge about geochemical processes, their frequency and spatial distribution will increase. Furthermore, if the repository is constructed in order to correlate the geochemical records with
other types of information paralleling and standardising the statistical and geostatistical analysis, the possibility to define baseline values will be facilitated giving us a concise and real-istic reading of what is occurring in the environment.
By taking into account all the previous indications, the main aim of the development of the GEOBASI database has been to have a dedicated informatics support to manage all the present validated geochemical knowledge available for Tuscany Region, giving the opportunity to integrate it with other geographical, geological and hydrogeological informa-tion on different scales, regional and/or limited to a specific portion of the region. Most of the information was obtained from research works and monitoring plans of universities and public institutions initially collected, structured and organ-ised inside the National Geochemical Archive (NGA) project.
At the current phase of development it is possible to query the database with the aim to receive information about the available geochemical knowledge of the regional territory for different geological media and compounds, including hazard-ous ones. An initial spatial distribution of the data as well as relationships with geology, land use and the hydrologi-cal network can be already obtained, as well as information about the different analytical methods used for the available experimental data. Plans are scheduled to associate explica-tive notes to each element or compound so that indications about the geochemical behaviour, source materials, reference law terms and effects on health can be obtained and down-loaded. This work is in progress as well as the uploading of the new experimental data of the samples drawn from the pilot area of the Follonica-Scarlino plain, when the analytical phase is concluded. Their statistical and geostatistical analysis within the database will be the test-bed for the integration of old and new information but it will also permit the identifica-tion of the problems that it is possible to encounter when the geochemical baseline for some chemicals has to be defined. The problem-solving procedure will be useful to finalise the upcoming work and to draw up a shared protocol to map geo-chemical variables and to evaluate their baseline.
Summarising it is possible to say that the two main ambi-tious targets of GEOBASI are: 1) to collect all the geochemical information available for the Tuscany region under the same structured framework for free public access, and 2) to define a shared protocol among all the participants of the project, starting from the sampling design and the analytical meth-ods for experimental data to the statistical and geostatistical analysis of the numerical information (Isaaks and Srivastava, 1989; Cressie, 1993). The basic idea is that geochemical maps can be used to evaluate natural phenomena and baseline con-centrations only if some main directives have been followed starting from the field phase to the restitution of the results.
In the design of a before and after evaluation, baseline stud-ies are a critical element in the formula for measuring change over time. A baseline study is required for every type of op-eration in an environmental context. However, the rigor of the methods used to establish baseline conditions varies ac-cording to the type of operation being implemented. A
com-promise must be reached between the need for robust, precise data to establish pre-operation exposure conditions and the cost of collecting such data in terms of resources (financial, human and time). National Programs that are focused on development should invest more resources and, as a result, conduct more rigorous baseline studies. However, initiatives like GEOBASI could provide significant assistance and reduce the associated costs by furnishing an integrated platform for the utilisation of the entire body of existing data and the op-timised design and planning of new measurement campaigns.
Acknowledgement: Tuscany Region (Settore Sistema Informativo
Territoriale ed Ambientale) is thanked for supporting and taking part to the development of the Geobasi project.
RefeRenCes
Aitchison J. (1986). The statistical analysis of compositional data, Re-print by The Blackburn Press,New Jersey, USA, 2003.
Ander E.L., Johnson C.C., Cave M. R., Palumbo-Roe B., Nathanail C.P., Murray Lark R. (2013). Methodology for the determination of normal background concentrations of contaminants in Eng-lish soil. Science of the Total Environment 454-455(1): 604-618. DOI:10.1016/j.scitotenv.2013.03.005.
Bottaini N.J., Buccianti A., Di Lella L.A., Macera P., Marini L., Nan-noni F., Protano G., Raco B. (2011). Testing of innovative ap-proaches in geochemical mapping: the experience of the Geobasi Toscana project, VIII forum Italiano di Scienze della Terra, Geoita-lia 2011, Torino, 19-23. Poster. Epitome 4, 04-0330, pg. 90. Buccianti, A., Magli, R. (2011). Metric concepts and implications
in describing compositional changes for world river’ chemistry. Computer & Geosciences 37(5): 670-676. DOI:10.1016/j.ca-geo.2010.04.017
Buccianti A., Macera P., Marini L., Protano G., Raco B. (2011). Pro-getto: GeoBasi - Toscana Piano Regionale di Azione Ambientale - PRAA 2009 Obiettivo E – Tutela della Risorsa Idrica, Relazione Finale, Dicembre 2011: 1-176 pp.
Buccianti, A. (2013). Is compositional data analysis a way to see beyond the illusion? Computer & Geoscences 50: 165-173. DOI:10.1016/j. cageo.2012.06.012
Buccianti A., Nisi B., Raco B. (2014). Compositional background for groundwater chemistry: the experience of the Geobasi project, Tus-cany region (central Italy), GeoMap Workshop proceeding 17th -20th June, Olomouc, Czech Republic.
Cressie N.A.C. (1993). Statistics for Spatial Data. Revised version, Wi-ley series in Probability and Mathematical Statistics, John WiWi-ley & Sons, New York, 900 pp., isbn: 0-471-00255-0.
De Vos W., Tarvainen T., Salminen R., Reeder S., De Vivo B., De-metriades A., Pirc S., Batista M. J., Marsina K., Ottesen R. T., O’Connor P. J., Bidovec M., Lima A., Siewers U., Smith B., Taylor H., Shaw R., SalpeteurI., Gregorauskiene V., Halamic J., Slaninka I., Lax K., Gravese P., Birke M., Breward N., Ander E.L., Jordan G., Duris M., Klein P., Locutura J., Bel-Lan A., Pasieczna A., Lis J., Mazreku A., Gilucis A., Heitzmann P., Klaver G. and Petersell V. (2006). Geochemical Atlas of Europe. Part 2. Interpretation of Geochemical Maps, Additional Tables, Figures, Maps, and Relat-ed Publications. Geological Survey of Finland, Espoo, 690 pp. – isbn: 951-690-956-6.
Egozcue J.J., Pawlowsky-Glahn V. (2006). Simplicial geometry for compositional data, in: Buccianti, A., Mateu-Figuera G., Paw-lowsky-Glahn V. (Eds.), Compositional Data Analysis in the sciences: from theory to practice. Special Publications n. 264, Geo-logical Society, London, 12-28.
Gałuszka A. (2005). The chemistry of soils, rocks and plant bioin-dicators in three ecosystems of the Holy Cross Mountains, Po-land, Environmental Monitoring and Assessment 110: 55–70. DOI:10.1007/s10661-005-6290-1
Gałuszka A. (2006). Methods of determining geochemical background in environmental studies. Problems of landscape ecology, Polish Association of Landscape Ecology, Warsaw (in Polish with English summary) XVI/1: 507–519.
Gałuszka A. (2007). A review of geochemical background concepts and an example using data from Poland, Environmental Geology, 52: 861–870. DOI:10.1007/s00254-006-0528-2.
Giannecchini S., Mari R., Corongiu M., Bottai L., Fibbi L., Pasi F. (2013). Geoportale del Consorzio LaMMA, Rivista Geomedia: 5: 12-16 – issn: 1128-8132.
Isaaks E.H., Srivastava R.M. (1989). Applied Geostatistics, Oxford University Press, 561 pp., isbn: 0-19-505013-4
Johnson C. J., Ander E. L. (2008). Urban geochemical mapping: How and why we do them. Environmental Geochemistry and Health 30: 511–530. DOI:10.1007/s10653-008-9189-2.
Levitan D.M., Schreiber M.E., Seal R.R., Bodnar R.J., Aylor J.G. (2014). Developing protocols for geochemical baseline stud-ies: an example from the Coles Hill uranium deposit, Virginia, USA. Applied Geochemistry 43: 88-100. DOI:10.1016/j.apgeo-chem.2014.02.007.
Ottonello G., Serva L. (2003). Geochemical Baselines of Italy, Pacini Editore, Pisa, 294 pp., isbn: 88-7781-532-9.
Reimann C, de Caritat P. (1998). Chemical elements in the environ-ment-factsheets for the geochemist and environmental scientist. Berlin, Germany Springer-Verlag, isbn: 3-540-63670-6.
Reimann, C., Siewers, U., Tarvainen, T., Bityukova, L., Erikson, A., Gilucis, V., Gregorauskiene, V., Lukasev, V.K., Matinian, N.N., Pasieczna, A. (2003). Agricultural Soils in Northern Europe: a Geochemical Atlas. Geologisches Jahrbuch Sonderhefte Reihe D Heft 5 Stuttgart.
Reimann C., Garrett R.G. (2005). Geochemical background-concept and reality. Science of the Total Environment, 350(1-3): 12-27. DOI:10.1016/j.scitotenv.2005.01.047.
Rodrigues A.S.L., Nalini Júnior H.A. (2009). Geochemical back-ground values and itsimplications in environmentalstudies. REM (Revista Escola de Minas, Ouro Preto 62(2): 155-165.
Salminen, R., Batista M. J., Bidovec M., Demetriades A., De Vivo B., De Vos W., Gilucis A., Gregorauskiene V., Halamic J., Heitzmann P., Lima A., Jordan G., Klaver G., Klein P., Lis J., Locutura J., Marsina K., Mazreku A., Mrnkova J., O’Connor P. J., Olsson S., Ottesen R..-T., Petersell V., Plant J. A., Reeder S., Salpeteu I., Sandström H., Siewers U., Steenfelt A. and Tarvaine T. (2005). FOREGS Geochemical Atlas of Europe. Part 1. Background In-formation, Methodology, and Maps. Geological Survey of Finland, Espoo. 525 pp., isbn: 951-690-913-2 (Electronic publication, URL address: http//gtk/publ/foregsatlas, March 15, 2005).