Systems/Circuits
Representation of Muscle Synergies in the Primate Brain
X
Simon A. Overduin,
1Andrea d’Avella,
4,5Jinsook Roh,
6,7Jose M. Carmena,
1,2,3* and Emilio Bizzi
8*
1Department of Electrical Engineering and Computer Sciences,2Helen Wills Neuroscience Institute, and3University of California Berkeley–University of California San Francisco Joint Graduate Group in Bioengineering, University of California, Berkeley, California 94720,4Department of Biomedical Sciences and Morphological and Functional Images, University of Messina, 98125 Messina, Italy,5Laboratory of Neuromotor Physiology, Santa Lucia Foundation, 00179 Rome, Italy,6Department of Kinesiology, Temple University, Philadelphia, Pennsylvania 19122,7Department of Physical Medicine and
Rehabilitation, Northwestern University, Chicago, Illinois 60611, and8Department of Brain and Cognitive Sciences and McGovern Institute for Brain Research, Massachusetts Institute of Technology, Cambridge, Massachusetts 02139
Evidence suggests that the CNS uses motor primitives to simplify movement control, but whether it actually stores primitives instead of
computing solutions on the fly to satisfy task demands is a controversial and still-unanswered possibility. Also in contention is whether
these primitives take the form of time-invariant muscle coactivations (“spatial” synergies) or time-varying muscle commands
(“spatio-temporal” synergies). Here, we examined forelimb muscle patterns and motor cortical spiking data in rhesus macaques (
Macaca
mu-latta) handling objects of variable shape and size. From these data, we extracted both spatiotemporal and spatial synergies using
non-negative decomposition. Each spatiotemporal synergy represents a sequence of muscular or neural activations that appeared to
recur frequently during the animals’ behavior. Key features of the spatiotemporal synergies (including their dimensionality, timing, and
amplitude modulation) were independently observed in the muscular and neural data. In addition, both at the muscular and neural
levels, these spatiotemporal synergies could be readily reconstructed as sequential activations of spatial synergies (a subset of those
extracted independently from the task data), suggestive of a hierarchical relationship between the two levels of synergies. The possibility
that motor cortex may execute even complex skill using spatiotemporal synergies has novel implications for the design of neuroprosthetic
devices, which could gain computational efficiency by adopting the discrete and low-dimensional control that these primitives imply.
Key words: cortex; grasp; hand; motor; movement; muscle
Introduction
The CNS may construct complex behaviors through more basic
building blocks or “motor primitives” (
Flash and Hochner, 2005
;
Bizzi et al., 2008
;
Giszter, 2015
). Both the evidence and definition
of these primitives remain tentative. In many studies, they have
been defined as time-invariant, “spatial” synergies of
simultane-ous cocontraction across muscles in frogs (
Tresch et al., 1999
),
cats (
Ting and Macpherson, 2005
;
Yakovenko et al., 2011
), rats
(
Kargo and Nitz, 2003
), monkeys (
Brochier et al., 2004
;
Overduin
et al., 2012
), and humans (
Klein Breteler et al., 2007
;
Torres-Oviedo and Ting, 2007
;
d’Avella et al., 2008
;
Roh et al., 2012
;
Berger et al., 2013
). An alternative “spatiotemporal” synergy
model (
d’Avella et al., 2003
) may relate more closely to the
clas-Received Oct. 17, 2014; revised July 8, 2015; accepted July 15, 2015.
Author contributions: S.A.O., A.d.A., J.R., and E.B. designed research; S.A.O., A.d.A., and J.R. performed research; S.A.O., A.d.A., and J.M.C. analyzed data; S.A.O. and A.d.A. wrote the paper.
This work was supported by a fellowship from the Dystonia Medical Research Foundation (S.A.O.), the National Institute of Neurological Disorders and Stroke–National Institutes of Health (Grant NS44393 to E.B.), and the Na-tional Science Foundation (Grant EFRI-1137267 to J.M.C.). We thank Margo Cantor and Charlotte Potak for assis-tance.
The authors declare no competing financial interests. *J.M.C. and E.B. are co-senior authors.
Correspondence should be addressed to Simon A. Overduin, PhD, Department of Electrical Engineering and
Computer Sciences, University of California, 185, Li Ka Shing Center, Berkeley, CA 94720. E-mail:[email protected].
DOI:10.1523/JNEUROSCI.4302-14.2015
Copyright © 2015 the authors 0270-6474/15/3512615-10$15.00/0
Significance Statement
We studied the motor cortical and forearm muscular activity of rhesus macaques (
Macaca mulatta) as they reached, grasped, and
carried objects of varied shape and size. We applied non-negative matrix factorization separately to the cortical and muscular data
to reduce their dimensionality to a smaller set of time-varying “spatiotemporal” synergies. Each synergy represents a sequence of
cortical or muscular activity that recurred frequently during the animals’ behavior. Salient features of the synergies (including their
dimensionality, timing, and amplitude modulation) were observed at both the cortical and muscular levels. The possibility that the brain
mayexecuteevencomplexbehaviorsusingspatiotemporalsynergieshasimplicationsforneuroprostheticalgorithmdesign,whichcould
become more computationally efficient by adopting the discrete and low-dimensional control that they afford.
sical idea of motor programs (
Keele, 1968
;
Polit and Bizzi, 1979
;
Georgopoulos et al., 1983
;
Kargo and Nitz, 2003
). A ccording to
this scheme, synergies would encode a brief profile of
time-varying activity in each of several muscles. Each spatiotemporal
synergy can capture an asynchronous, but nonetheless invariant,
pattern of intermuscular coordination. The synergies themselves
may be recruited asynchronously by the CNS in constructing
more complex behaviors, which seems to be needed to account
for multiple-phase motions such as object reach, grasp, and carry
movements (
d’Avella et al., 2006
;
Overduin et al., 2008
).
Spatio-temporal synergies could substantially lessen the computational
burden on the CNS during motor control because it could reuse
synergies across different task conditions and need only specify
when and how much to recruit each synergy within each
individ-ual movement segment (
Ru¨ckert and d’Avella, 2013
). These
synergy-encoding schemes pose a much simpler control problem
than commanding each muscle continuously throughout a
movement (cf. spatiotemporal synergies) and independently of
other muscles (cf. either spatiotemporal or spatial synergies).
Whether the CNS stores discrete motor primitives in the form
of spatiotemporal synergies is an open question. Studies using
microstimulation support the idea of simple, discrete movement
encoding, although generally at the kinetic and kinematic level
rather than the muscular level. For example, intraspinal
micro-stimulation generates forces by which a limb is driven through
one or more postures in frogs (
Giszter et al., 1993
) and mammals
(
Tresch and Bizzi, 1999
;
Lemay and Grill, 2004
). Within the
brain, intracortical microstimulation (ICMS) trains of sufficient
duration within mammalian motor cortex (
Graziano et al., 2002
;
Ramanathan et al., 2006
;
Griffin et al., 2011
,
2014
;
Stepniewska et
al., 2014
) can elicit complex, multijoint, multiphase forelimb
behaviors (e.g., a reach, grasp, and retraction). The convergent
forces (
Giszter et al., 1993
) and invariant end points (
Graziano
et al., 2004
) evoked by microstimulation tend to coincide with
movements and postures seen in subjects’ spontaneous
behav-ior, suggesting that the evoked movements are not artifactual.
Here, we investigated whether populations of motor cortical
neurons reflect recruitment of motor primitives in the form of
spatiotemporal synergies. We studied a manual behavior
per-formed by two rhesus macaques (Macaca mulatta) (
Overduin et
al., 2008
). The subjects had to reach for an object presented in a
well, grasp it, and then carry it to an opposing well. To elicit a
variety of hand postures and forces, the objects included 25
spheres, cubes, and cylinders of different dimension. As we have
reported previously, the EMG data recorded from forelimb
mus-cles could be decomposed into a small number of spatiotemporal
(
Overduin et al., 2008
) or spatial (
Overduin et al., 2012
)
syner-gies. We performed these decompositions using iterative
factor-ization algorithms suitable for non-negative data such as muscle
activations (
d’Avella et al., 2003
). We now apply the same
decom-position algorithms to simultaneously recorded cortical data
from primary motor cortex (MI) and the dorsal (PMd) and
ven-tral (PMv) premotor cortex. We hypothesized that, if
spatiotem-poral muscle synergies are represented in motor cortex, motor
neuronal firing patterns should decompose into the same
num-ber of dimensions as observed for EMG-derived synergies and
with the same pattern of modulation over object conditions. We
also examined spatial synergies extracted from the same muscle
and neural data to contrast spatiotemporal and spatial
synergy-encoding schemes.
Materials and Methods
Subjects. Cortical, muscular, and behavioral data were recorded from two rhesus monkeys: G1 (an 8-year-old, 5.9 kg female) and G2 (a 4-year-old, 6.5 kg male). Procedures all had the approval of the Massachusetts Insti-tute of Technology Committee on Animal Care.
Behavior. Subjects pressed a start button and then reached for, grasped, and carried objects between two wells. The 25 objects included 15 cylinders, of which 5 each spanned 1 of 3 dimensions (inner diameter, 0.6 –3.2 cm; uniform diameter, 1.3–3.8 cm; height, 0.6 –5.7 cm), 5 cubes of variable width (1.5–3.6 cm), and 5 spheres of variable diameter (range 1.6 –3.6 cm). To study object-related rather than sparser position-related modulation of motor activity, we focused exclusively on one carry direc-tion (as in earlier reports such asOverduin et al., 2008,2014). Of the two carry directions, we have continued to focus on leftward-carry trials because these involved larger-amplitude reaching movements (the start button being located further from the object) and more opportunity to observe grasp-related activity during reaching. Head movements were constrained by a cranial post during recording. Behavioral event data collection and processing have been described previously (Overduin et al., 2008).
Sessions. The recordings from monkey G1 comprised 7798 successful trials performed over 20 recording sessions spanning 45 d; those from G2 comprised 775 trials performed over 6 sessions spanning 6 d. Muscle recording was done in each of these sessions. Neural data were only collected in a subset of the sessions, but when collected, they were ac-quired at the same time as the muscle data. The muscle data thus include some trials (as well as entire, interspersed sessions) when neural data were not collected and the EMG decomposition results (seeFigs. 1,4) are based on trials recorded both with and without simultaneous neural data (Overduin et al., 2008). The ensemble-level neural activity was restricted to the subset of data (3466 trials over nine sessions from G1 and 257 trials over four sessions from G2) over which the ensemble units were recorded (while the animals were exposed to a common set of object conditions, as described under “Cortical ensembles” below).
Surgery. Craniotomies occurred after (G1) or along with the first of (G2) the muscle implantation surgeries (described inOverduin et al., 2008). These sterile surgeries were performed under general anesthesia (10 mg/kg ketamine and 0.05 mg/kg atropine injected intramuscularly, followed by 5 mg/kg sodium pentobarbital intravenously in G1 or by inhalation of 1–2% isoflurane with 2 L of O2in G2) and then adminis-tration of analgesics and systemic antibiotics. Using bone screws and cement, custom stainless steel wells (width: G1, 28 mm; G2, 20 mm) were secured around craniotomy sites centered over right motor cortex.
Muscle data. EMG recordings were made via 15 (G1) or 19 (G2) elec-trodes chronically implanted in muscles of the left forelimb. Intrinsic hand muscles included the opponens digiti quinti manus (Op5), flexor digiti quinti brevis manus (F5B), opponens pollicis (OpP), adductor pollicis (AdP), and abductor pollicis brevis (AbPB). Wrist and extrinsic hand flexors included the flexor carpi ulnaris (FCU), radial and ulnar flexor digitorum profundus (FDPR and FDPU, respectively), flexor digi-torum superficialis (FDS), and flexor carpi radialis (FCR). Wrist and extrinsic hand extensors included the extensor carpi ulnaris (ECU), ex-tensor digiti quarti and quinti proprius (ED45), exex-tensor digiti secundi and tertii proprius (ED23), extensor digitorum communis (EDC), exten-sor carpi radialis brevis (ECRB), and abductor pollicis longus (AbPL). Proximal muscles acting on the elbow and shoulder included the bra-chioradialis (BR), biceps brachii longus (Bic), radial and ulnar short heads of the triceps brachii (TriR and TriU, respectively), pectoralis ma-jor (Pec), and deltoideus (Del). EMG data were recorded simultaneously from all 15 (G1) or 19 (G2) muscles on a trial-by-trial basis (between button press and reward events). EMG data collection (including cross-talk analysis) has been described previously (Overduin et al., 2008).
Cortical areas. Units were recorded from PMd, PMv, and MI as iden-tified from MRI and sensorimotor mapping (somatosensory responses, ICMS-evoked movements, and thresholds). Unit somatosensory re-sponse fields were estimated at the beginning of sessions by touching the monkey’s skin and passively moving its limbs. At the end of sessions, ICMS was applied through tungsten microelectrodes (FHC; 250-
m-diameter shaft tapered to a 3-m-wide tip; 0.3–3-M⍀ impedance). In each session,ⱕ10 electrodes were introduced into the brain via manual microdrives (depth resolution: 30m). These custom microdrives were mounted on a grid that was secured to the recording well and that con-strained the interelectrode spacing to 1 mm. Stimulation parameters included 0.05 s train duration, 330 Hz pulse frequency, 10 –150A cur-rent, and 2⫻ 0.2 ms pulse duration (cathodal leading).
Cortical units. The electrodes used for ICMS were also used to acutely record extracellular voltages. We considered only those units lying within cortical regions convexly bounded by sites that demonstrated sensorimo-tor responses restricted to the left forelimb. Signals were preamplified (1⫻ gain, by a head stage ⬃5 cm from the electrodes) and then amplified (10,000⫻), band-pass filtered (600–6000 Hz, second-order filter with roll-off on both ends) and digitized (Neuralynx). Spikes (1.1 ms wave-forms sampled at 30 kHz, with the threshold-crossing point at 0.26 ms) were stored to disk whenever electrode voltages exceeded a manual threshold. Single units were identified offline using MClust (MClust-3.4) and custom algorithms in MATLAB (The MathWorks) for this and the following analyses. Accepted units were found to have mean firing rates between 1 and 58 Hz, and 1% of interspike intervals (ISIs) were⬍1 ms. A total of 202 units were identified (168 of these in G1 and 34 in G2).
Cortical ensembles. These consisted of the largest number of units (54 units in G1, 17 in G2) which were recorded overⱖ4 trials (in any session) with each of a set of at least 2 objects from each of the 5 shape classes (13 objects for G1, 11 for G2). Ensembles included 11, 12, and 31 (G1) and 4, 3, and 10 (G2) units in areas PMd, PMv, and MI, respectively. We pooled data from units recorded on different days (Poliakov and Schieber, 1999;
Morrow and Miller, 2003;Schieber and Rivlis, 2007) given that the same objects were presented on those days and that the animals’ behavior was relatively stereotyped in handling these objects. The neural data matrix comprised the unit firing rate averages over theⱖ4 trials in each of these 11 or 13 object conditions.
Cortical subensembles. For single-trial comparisons of spatiotemporal muscle and neural synergies, we also defined “subensembles” consisting of the largest number of units that had been recorded simultaneously within the above 54- and 17-unit ensembles. For both monkeys, these subensembles included 6 units, spanning either 247 (G1) or 56 (G2) trials. For monkey G1, there were two such subensembles; we focused on the one having better average clustering metrics, including higher L-ratio and lower isolation distance (Schmitzer-Torbert et al., 2005), and fewer ISIs⬍1 ms, as well as higher spike rates.
EMG preprocessing. The data in each muscle channel were integrated over short bins (G1: 9 ms, G2: 11 ms) and normalized to the maximum EMG over the 25 object conditions. As described previously (Overduin et al., 2008), 40 trials in each condition were selected, time aligned to the moment of object removal from the first well, cropped to a 100-bin period around this time (G1: [⫺0.35:⫹0.55] s, G2: [⫺0.5:⫹0.6] s), av-eraged over trials, and concatenated over conditions to give the muscle data matrix Dm(“m” indicating “muscle” data). The different integra-tion and window times chosen for the two subjects were based on their unique movement latencies and were set to span the median reach and carry durations of each animal (Overduin et al., 2008).
Unit preprocessing. Each unit’s spikes were summed over the same time bins used for EMG data (G1: 9 ms, G2: 11 ms). All trials fully spanned by a unit were selected, time aligned to the moment of object removal, and cropped to the same time windows as for EMG data minus a fixed 50 ms delay (G1: [⫺0.4:⫹0.5] s, G2: [⫺0.55:⫹0.55] s). This delay maximized (to the nearest 10 ms and within a [⫺0.5:⫹0.5] s range) the number of significant correlations between mean unit firing rates and integrated EMG values over all (168⫹ 34) units and (15 ⫹ 19) EMG channels, pooled over animals. The delay is also consistent with values reported by others (Morrow and Miller, 2003;Schieber and Rivlis, 2007;Stark et al., 2007b). Firing rates were averaged over trials within each object condi-tion, smoothed by convolution with a 50 ms Gaussian kernel, and con-catenated over conditions to give the neural data matrix Dn (“n” indicating “neural” data).
Synergy extraction and fitting. Decomposition algorithms applying non-negative matrix factorization were used to identify a set of both spatiotemporal (d’Avella et al., 2003) and spatial (Tresch et al., 1999;Lee
and Seung, 1999) synergies underlying each monkey’s muscle and neural patterns. The muscle data Dmwere defined over e⫽ 1, 2, . . . , E EMG channels and t time points. The matrix Dmwas decomposed, first as a combination of i⫽ 1, 2, . . . ,Npmdspatiotemporal synergy matricesPim (seeFig. 1A). (The “d” and “p” ofNpmddenote muscle “data”-derived and number of “primitives,” respectively.) The spatiotemporal synergy dura-tion parameter was fixed at 50 time bins (G1: 0.45 s, G2: 0.55 s). These a priori durations were based on several considerations: First, they equaled half of the trial window defined for each monkey, allowing a reasonably small number of spatiotemporal synergies (as few as two) to explain the muscle and neural data. (The reconstruction plots ofFigs. 1C and2C start at two spatiotemporal synergies for this reason.) Second, visual inspection of the data showed this duration to be sufficient to capture typical muscle bursts. Third, the submovement literature supports a spa-tiotemporal synergy duration of⬃0.5 s. In monkeys in particular, sub-movement durations of up to 0.35– 0.5 s were evident in forelimb movements (Roitman et al., 2004;Fishbach et al., 2007). The same dura-tion was chosen in several earlier reports across a range of species (d’Avella and Bizzi, 2005;d’Avella et al., 2006,2011;Overduin et al., 2008). Each spatiotemporal synergy was recruited with an onset delaytim and scaled by a non-negative coefficientcimspecific to each synergy and trial (seeFig. 1B) as follows:
Dm共e, t兲 ⫽
冘
i⫽1 Npmdcim 䡠 Pim共e, t ⫺ tim兲
The activity Dmwas also decomposed as a combination of j⫽ 1 . . .N s md spatial synergy vectorsvjmd(seeFig. 4A, black-to-red bars), each weighted by an amplitude historyajmd共t兲as follows:
Dm共e, t兲 ⫽
冘
j⫽1 Nsmdajmd共t兲 䡠 vjmd共e兲
(The “s” ofNsmdindicates “synchronous” spatial synergies.) From the concatenated set of spatiotemporal synergy matricesPim, we also ex-tracted spatial synergiesvjmp( j⫽ 1 . . .Nsmp), the motivation for which is described in the Results (seeFig. 4A, purple bars). (The “p” ofNsmp indicates derivation from motor “primitives” rather than data.) This allowed the following reconstruction:
Pim共e, t兲 ⫽
冘
j⫽1 Nsmpajmp共t兲 䡠 vjmp共e兲
For a givenNpmd(orNsmdorNsmp), the algorithms iteratively updated the structuresPim(orvjmdorvjmp) and coefficientscimandtim(orajmd共t兲or ajmp共t兲) until the total reconstruction error R2grew by⬍0.001 over 10 iterations. The algorithms were repeated five times for each extraction and the set of spatiotemporal or spatial synergies accounting for the most EMG variation was selected for analysis. Dimensionalities were chosen in a manner consistent with earlier work by applying a threshold of R2⫽ 80% in the case ofNpmd(Overduin et al., 2008; seeFig. 1C) or 95% in the case ofNsmdandNsmp(Overduin et al., 2012; seeFig. 4C). In the case of the spatiotemporal synergy extraction, the procedure was repeated a further 100 times after EMG electrode identity was first randomized over chan-nels within each object condition. The resulting “scrambled” synergies defined baseline levels of R2explained by chance (seeFig. 1C, gray lines). The entire set of spatiotemporal and spatial synergy extraction proce-dures described above was applied to the neural data Dnin the same fashion as for the muscle data Dm(seeFig. 2; the resulting structures and coefficients are superscripted “n” rather than “m.” For comparisons of spatiotemporal muscle synergies and neural synergies fit to the six-unit subensemble data (seeFig. 3), we simply reduced the matricesPinto those six (of 54 or 17) rows corresponding to the subset of units spanned by the subensemble and then fit these units’ data with the reducedPin.
Spatiotemporal and spatial synergy comparisons. Spatiotemporal syn-ergy coefficient comparisons, either with object mass (seeFigs. 1D,2D) or across muscle and neural levels (seeFig. 3), involved Pearson correla-tions corrected for the number of synergies and evaluated at a p⬍ 0.05 significance threshold. In regards to spatial synergy comparisons, “data-derived” spatial synergies (vjmdorvjnd), i.e., those extracted from the task
data (either Dmor Dn), were compared and matched to “primitive-derived” spatial syner-gies (vjmporvjnp), i.e., those extracted from the spatiotemporal synergies (PimorPin). For these comparisons, we used a greedy search proce-dure (Overduin et al., 2012). For allNsmd⫻Nsmp (orNsnd⫻Nsnp) possible pairs of data- versus primitive-derived synergies, we first computed dot products (e.g., 8⫻ 4 ⫽ 32 for G2). The pair of data- versus primitive-derived spatial syner-gies with the highest dot product was defined as the best-matching pair. The pair with the highest dot product among the remaining (NsmD⫺1) ⫻ (NsmP⫺1) pairs (e.g., 7 ⫻ 3 ⫽ 21 for G2) defined the second-best match. This process was repeated until all spatial synergies in one set had been paired (e.g., over min(8, 4)⫽ 4 times for G2). We then used Monte Carlo simulation to assess the significance of each match. We repeated the greedy search al-gorithm 10,000 times for each monkey after first randomly shuffling EMG or neural unit channel identity each time. We then compared the highest (best-matching) dot product be-tween actual data- and primitive-derived syn-ergies with the distribution of highest dot products from the 10,000 comparisons of shuf-fled synergies. If the former value exceeded the 95thpercentile of the distribution of latter val-ues, we took the match as significant at p⬍ 0.05. We then repeated this comparison for the second-best actual synergy pair versus the dis-tribution of second-best shuffled pairs, etc.
Results
The two monkeys, “G1” and “G2,”
per-formed the task over multiple days while
EMG data were recorded from 15–19
elec-trodes chronically implanted in muscles
of the shoulder, arm, and hand. Each of
the spatiotemporal muscle synergies
ex-tracted from the EMG data (
Fig. 1
A)
com-prises a specific pattern of muscle activity
that spanned a particular phase of the
task: reach, grasp, and carry. There were
broad similarities between the two
ani-mals in terms of the incidence of tonic,
phasic, or biphasic muscle recruitment
within these synergies (
Overduin et al.,
2008
).
Figure 1
B illustrates the reconstruction
of average EMG activity in a sample trial
condition by a combination of spatiotemporal synergies. Note
that the reconstruction is achieved by only six scalar parameters:
three scaling coefficients (c) and three onset time coefficients (t),
which together specify a period in which the synergy is active. The
times at which the synergies were active relative to the time when
the object was removed from its origin well in this example are
indicated by the dashed vertical lines in
Figure 1
, A and B. The
curve of the reconstruction R
2(
Fig. 1
C) presents a relatively
sharp bend at a particular number of synergies. The curve
sug-gested a dimensionality of 3, at which most (81%) of the variation
in the EMG data was explained and beyond which minimal
fur-ther variation could be explained by additional synergies.
Were these spatiotemporal synergies actually embodied in the
CNS, they could provide the animal with a mechanism to generate a
rich variety of task-appropriate reaches, grasps, and carrying
move-ments by merely specifying suitable timing and amplitude
coeffi-cients for each of the three synergies. That is, rather than having to
control individual muscles at each point in time throughout a trial,
the CNS could simply output the equivalent of six scalar commands
(three timing and three amplitude instructions). Further,
appropri-ate commands could be learned by experience and potentially
gen-eralized over task variables. Consistent with such a scheme, we
observed various systematic relationships involving synergy
coeffi-cients and object properties (
Overduin et al., 2008
). Most
promi-nently, the amplitude coefficient associated with the grasp-related
synergy was strongly modulated by the mass of the object being
grasped (
Fig. 1
D), as captured by linear correlations for both G1 (r
⫽
0.86, p
⬍ 0.0001) and G2 (r ⫽ 0.90, p ⬍ 0.0001).
D
C
0 0.2 0.4 0.6 0.8 1 2 3 4 5 6 7 8N spatiot. synergies P
mdm
R
of
D
fit by
P
2m 0 20 40 60 80 100 0 0.2 0.4 0.6 0.8 1object mass (g)
coeff
c (a.u.)
2 m r = 0.90**** r = 0.86**** 0.5 sA
0.5 sB
G2 EMG activity (a.u.)
G2 EMG activity
, synergy coef
fs (a.u.)
c1 m c2 m c3 m t2 m t3 m t1m TriR Del Pec TriU AbPL EDC ED23 ED45 BR FCR FDS FDPU FCU AbPB AdP OpP F5B ECU BicP (reach)
1 mP (grasp)
2 mP (carry)
3 m TriR Del Pec TriU AbPL EDC ED23 ED45 BR FCR FDS FDPU FCU AbPB AdP OpP F5B ECU BicG1
G2
ctrl
ctrl
G1
G2
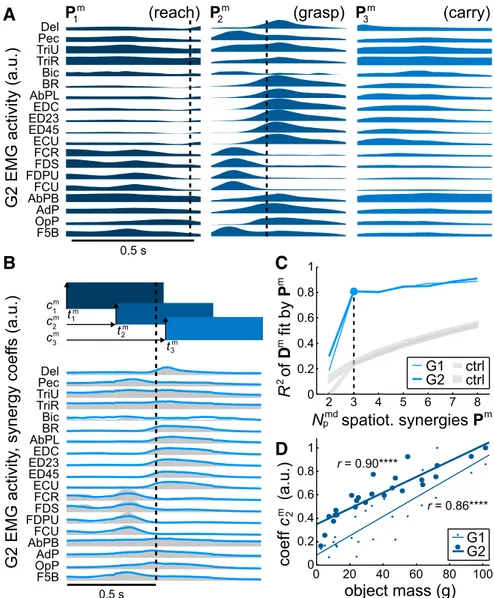
p mFigure 1. Spatiotemporal muscle synergies. A, Three synergiesPimfor G2. The dashed lines show the time when the object was removed from its origin well relative to each synergy for the specific case of the object condition depicted in the next panel. B, By specifying appropriate amplitude coefficientscimand timing coefficientst
i
m, the synergies (rectangular icons) could be linearly combined (blue lines) to reconstruct G2’s EMG activity (gray envelopes), as with this sample object (a 3.6-cm-wide sphere). The dashed line shows the time of object removal, and equivalently the time of alignment across trials. C, Three synergies were able to account for a substantial fraction of the variability in EMG data, with little additional detail captured by furtherPim. The gray lines (“ctrl”) show the level of data reconstruction achieved by chance when EMG channels had first been randomly scrambled within each object condition before synergy extraction (mean⫾ 95% confidence intervals over 100 repetitions of this scrambling). D, In reconstructions across different object conditions, there were systematic variations in synergy coefficients, most prominently the one shown here for the second synergy’s amplitude,c2m, when regressed against object mass. The points show the coefficient for each object condition; the straight lines are significant linear fits (****p⬍ 0.0001).
If motor cortex were truly relying on
spatiotemporal synergies to simplify
motor control, then the
population-level activity should broadly reflect the
low-dimensional patterns by which
these primitives may be recruited. To
investigate this, we pooled the firing
rates of multiple motor cortical units
(G1: 54, G2: 17) recorded over multiple
days of performance with a common set
of objects. We subjected the firing rate
data to the same synergy extraction
al-gorithm as used for the EMG data to
isolate population-wide modes of
varia-tion in neural activity (
Fig. 2
). The data
windows were the same as those
defin-ing the EMG data except they were
shifted back in time by a 50 ms delay to
account for transmission latency
be-tween cortex and muscles (
Morrow and
Miller, 2003
;
Schieber and Rivlis, 2007
;
Stark et al., 2007b
).
As observed for the spatiotemporal
mus-cle synergies, the structure of each neural
synergy appeared complex, with units
par-ticipating in multiple synergies (
Fig. 2
A).
Two features of the spatiotemporal muscle
synergies were particularly salient: the sharp
bend in the reconstruction curve
corre-sponding to three synergies (
Fig. 1
C) and
the strong modulation of the second
syner-gy’s amplitude with object mass (
Fig. 1
D).
Were either of these patterns evident in the
neural data? Indeed, the neural synergies
re-sembled the muscle synergies in these two
salient features.
First, the dimensionality of the
spatio-temporal neural and muscle synergies was
similar. In fitting the spiking data of
indi-vidual trial conditions (
Fig. 2
B), the data
reconstruction curves of the neural
syner-gies, like those of the muscle synersyner-gies,
bent more sharply at three than at any
other number (
Fig. 2
C) even if the actual
R
2values at this point were lower (R
2⫽
70% for both G1 and G2) than the values
for the muscle synergies.
c1 n c2 n c3 n t2n t3 n t1n
D
0.5 sA
C
0 0.2 0.4 0.6 0.8 1 2 3 4 5 6 7 8 0.5 sB
G2 unit activity (a.u.)
G2 unit activity (rasters; a.u.)
N spatiot. synergies P
nd nP (reach)
1 nP (grasp)
2 nP (carry)
3 nR
of
D
fit by
P
2n 0 20 40 60 80 100 0 0.2 0.4 0.6 0.8 1object mass (g)
coeff
c
(a.u.)
2 n r = 0.86*** r = 0.86*** 4 1 2 3 7 8 9 10 6 12 13 14 15 16 17 11 5 PMv PMd MI 0.5 sG2
synergy
coef
fs
(a.u.)
τ
2τ
3τ
1 15LM distance (mm)
20 15 20 10PA distance (mm)
15 20 15 20 PMv MI CS ArS PMd SPcS 10 14 13P (
1τ
) (reach)
nP (
2τ
) (grasp)
nP (
3τ
) (carry)
n 1 2 3E
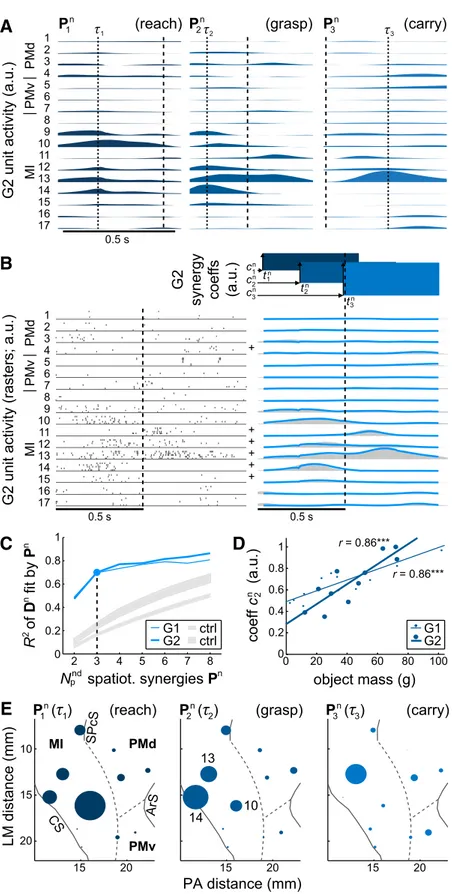
G1 G2 ctrlctrl G1G2 4 1 2 3 7 8 9 10 6 12 13 14 15 16 17 11 5 PMv PMd MI + + + + + + p nFigure 2. Spatiotemporal neural synergies. A, Three synergiesPinfor G2. Units are grouped by area (PMd, PMv, MI). (Dashed lines as inFig. 1A; dotted lines indicate time pointsisampled in E, below, which are different from the synergy onset timestin shown in B.) B, Left, Raster plots of spike times across G2’s units during trials with a sample object (the same as inFig. 1B). For each unit, the spike times in one trial fall within a single horizontal row. Right, By specifying appropriate amplitude coefficientscinand timing coefficientstin, the neural synergies could be combined to reconstruct the trial-averaged spiking activity for the same object condition depicted in the rasters. The plus symbols (⫹)betweentherasterplots(left)andreconstructionplots(right)identifythe units belonging to the subensemble ofFigure 3B. C, Three synergies accounted for much of the variability in unit spiking data. The gray lines (“ctrl”) show the chance reconstruction when units had been randomly scrambled before synergy extraction (mean⫾ 95% confidence intervals over 100 repetitions). D, The most prominent covariation involving synergy coefficients was that
4
between the second synergy’s amplitude,c2n, and object mass. The linear fits are significant (***p⬍ 0.001). E, Section of monkey G2’s right hemisphere as viewed from above pro-jected on lateromedial (LM) and posterior–anterior (PA) axes. Solid lines represent sulci (CS, central; SPcS, superior precen-tral; ArS, arcuate); dashed lines show estimated interareal bor-ders. Filled circles represent recording sites from each of which one or more units were recorded. (Where multiple units were recorded from the same site, responses have been averaged together.) The plot at center identifies the recording sites of three MI units (as enumerated in A and B). The radius of each circle is directly proportional to the firing rate of the site’s unit(s) within the indicated synergyPinat the timesi high-lighted in A.
Second, the spatiotemporal neural and
muscle synergies were related in their
most salient behavioral modulation.
Neu-ral onset times preceded those of the
mus-cle synergies by 0.07
⫾ 0.06 s (range
⫺0.01–0.16 s, averaged over synergies).
(Averaged over object conditions, neural
synergy onset times for G1 were
⫺0.39 ⫾
0.01 s,
⫺0.13 ⫾ 0.02 s, and 0.05 ⫾ 0.08 s;
those for G2 were
⫺0.51 ⫾ 0.06 s,
⫺0.35 ⫾ 0.06 s, and ⫺0.08 ⫾ 0.03 s,
rela-tive to object removal. As reported in
Overduin et al. (2008)
, muscle synergy
onset times for G1 were
⫺0.31 ⫾ 0.11 s,
⫺0.10 ⫾ 0.07 s, and 0.04 ⫾ 0.16 s; those
for G2 were
⫺0.45 ⫾ 0.16 s, ⫺0.19 ⫾
0.10 s, and 0.01
⫹ 0.17 s.) For both sets of
synergies, the second of the three (as
or-dered by mean time of onset) captured
the neural and muscular activity around
the time of object grasp (
Figs. 1
B,
2
B). The
activation coefficients for the second
neu-ral synergy demonstrated a positive, linear
relationship with object mass (r
⫽ 0.86, p ⬍ 0.001; both G1 and
G2;
Fig. 2
D), as was observed for muscle synergies (
Fig. 1
D).
Each of the spatiotemporal neural synergies can be pictured
as a mosaic of activation that waxed and waned at multiple loci
on the cortical surface.
Figure 2
E depicts the degree to which
units at each of monkey G2’s recording sites were activated, on
average, during the time of peak activation of each neural
synergy. Highlighted are the locations of MI units 10, 14, and
13, maximally activated in the first, second, and third neural
synergy, respectively.
As might be expected from their covariations with object mass
(
Figs. 1
D,
2
D), the amplitude coefficients of the grasp-related
spatiotemporal neural and muscle synergies were also
signifi-cantly linearly correlated with each other (G1: r
⫽ 0.90, p ⬍
0.0001; G2: r
⫽ 0.78, p ⬍ 0.01), as shown in
Figure 3
A. We
investigated whether this was true even at the single-trial level
(and not just at the level of synergy coefficients averaged across
each object condition’s trials). To do so, we identified the largest
subensembles of units (from within G1’s 54-unit and G2’s
17-unit ensemble) that had all been recorded at the same time. For
both subjects, these subensembles included six units. For monkey
G2, these units are identified by plus symbols (⫹) in
Figure 2
B.
We then fit the synergies to both the EMG and unit firing data
from the 247 (G1) or 56 (G2) trials spanned by these
suben-sembles after first reducing the neural synergies to the six of 54
(G1) or six of 17 (G2) channels spanned by the subensemble’s
units. Although the correlations are reduced using these much
smaller subensembles, the amplitude coefficients of the
grasp-related synergies remained significantly corgrasp-related between the
muscle and neural levels (G1: r
⫽ 0.16, p ⬍ 0.05; G2: r ⫽ 0.32, p ⬍
0.05), as shown in
Figure 3
B.
The above results concern spatiotemporal (time-varying)
syn-ergies. As we have previously reported for the EMG dataset
con-sidered here (
Overduin et al., 2012
), these data could also be
decomposed into combinations of spatial (time-invariant)
syn-ergies using a related factorization algorithm (
Tresch et al., 1999
;
Lee and Seung, 1999
). In the case of spatial synergies, each
syn-ergy captures a pattern of muscles firing in synchrony.
Figure 4
, A
and B, illustrates the spatial muscle synergies found for G2 and
their reconstruction of the average EMG activity in the same
sample trial condition as in
Figure 1
B. We found that eight (G2)
or 10 (G1) synergies were sufficient to reconstruct
ⱖ95% of the
variability in the EMG data (
Fig. 4
C;
Overduin et al., 2012
). Such
spatial synergies could provide the animal with a mechanism to
control its muscles continuously (if not as efficiently as in the case
of spatiotemporal synergies) by specifying a time course of
task-specific amplitude coefficients for each of the synergies (cf.
Figs.
4
B,
1
B).
Inspection of the spatiotemporal muscle synergies (
Fig. 1
A)
suggested that they themselves, like the data from which they
were derived, could be expressed as a combination of spatial
ergies. Certain subgroups of muscles resembling the spatial
syn-ergies tended to coactivate in a manner unique to each
spatiotemporal synergy. Consider G2’s forearm flexors (FCR,
FDS, FDPU, and FCU): their covariation, for example, in the
second spatiotemporal synergy (
Fig. 1
A), is captured in the
fourth spatial synergy (
Fig. 4
A). The spatiotemporal muscle
syn-ergies could be decomposed directly into just four (G2) or five
(G1) spatial synergies, with R
2ⱖ 95% of the variance in the
spatiotemporal synergy matrices preserved (
Fig. 4
D; R
2⫽ 96%
for both monkeys). Reconstruction of monkey G2’s
spatiotem-poral muscle synergies by four spatial synergies, for example, is
illustrated in
Figure 4
E.
The qualitative results concerning spatial muscle synergies
hold also for spatial neural synergies (data not shown). For this
analysis, the same populations of motor cortical units (G1: 54,
G2: 17) were decomposed into spatial, rather than
spatiotempo-ral, synergies. We set the dimensionality of the spatial synergies
derived from neural data to be equal to that selected for spatial
muscle synergies (i.e., eight for G2, 10 for G1). At this
dimension-ality, spatial neural synergies were able to account for 95% of
firing rate variability in G2’s units (as for the muscle synergies in
Fig. 4
C), but only 80% of G1’s greater number of units (data not
shown). Spatial neural synergies derived from spatiotemporal
synergies (and not directly from the data) could explain 94% of
the spatiotemporal synergies’ firing rate variability for G2 and
85% for G1.
More importantly, when comparing the spatial synergies
de-rived from spatiotemporal synergies with those extracted
inde-pendently from the data, we found that all 5/5 (G1) and 4/4 (G2)
coeff
c
(a.u.)
2 ncoeff
c (a.u.)
2m 0 0.2 0.4 0.6 0.8 1 0 0.2 0.4 0.6 0.8 1B
0 0.2 0.4 0.6 0.8 1coeff
c
(a.u.)
2 n 0 0.2 0.4 0.6 0.8 1coeff
c (a.u.)
2mA
r = 0.90****G1
G2
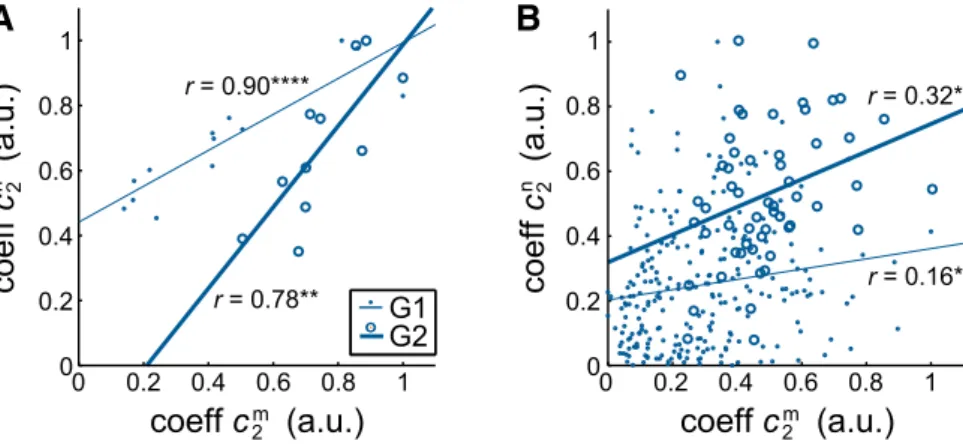
r = 0.78** r = 0.32* r = 0.16*Figure 3. Relationship between spatiotemporal muscle and neural synergies. A, The amplitude coefficient of the second, grasp-related muscle synergy (c2m) was significantly correlated with that of the second neural synergy (c
2
n) for both G1 and G2. As inFigures 1D and2D, each point represents the average coefficient over all trials that were performed by the monkey with the given object and that were spanned by at least one unit within the ensemble. B, The same trends were evident when we restricted the neural data to ensembles of (six) simultaneously recorded units and examined the relationship between muscle and neural synergies at the single-trial (rather than trial-averaged) level. Here, each point represents the synergy coefficient fit to the muscle or neural data of a single trial. The straight lines are significant linear fits (A, G1: ****p⬍0.0001;A,G2:**p⬍0.01;B:*p⬍0.05).
of the former could be uniquely matched
to the latter using a greedy search
proce-dure, with significantly above-chance
( p
⬍ 0.05) dot products. This held both
for muscle data (G1 dot products: 0.73,
0.83, 0.84, 0.86, 0.93; G2: 0.83, 0.85, 0.87,
0.92;
Fig. 4
A) and for neural data (G1:
0.60, 0.70, 0.71, 0.84, 0.96; G2: 0.82, 0.84,
0.85, 0.95; data not shown). These results
suggest that, at both the neural and
mus-cle levels, the spatiotemporal synergies
may be composed of sequences of a subset
of the spatial synergies available to the
animal.
Discussion
The idea that motor primitives may be
en-coded within the CNS remains
controver-sial (
Tresch and Jarc, 2009
). The encoding
of spatiotemporal synergies in particular
would be radically different than
continu-ous control of instantanecontinu-ous motor
vari-ables. In much of the motor control
literature, cortical activity is assumed and
shown to be related to continuously
con-trolled quantities such as the position,
ve-locity, or acceleration of extrinsic effectors
or intrinsic joints, the forces underlying
these kinematics, or the muscle
contrac-tions determining these dynamics (
Geor-gopoulos et al., 1999
;
Carmena et al.,
2003
;
Morrow and Miller, 2003
;
Schieber
and Rivlis, 2007
;
Stark et al., 2007b
;
Hoch-berg et al., 2012
;
Collinger et al., 2013
).
The main novelty of the present results is
our finding that, at the population level,
motor cortical units in the primate brain
also reflect the recruitment of discrete,
spatiotemporal synergies.
Earlier studies of motor cortex during
natural behavior are consistent with its
role in controlling discrete movement
primitives. Motor cortical neurons have
been observed to have temporally
com-plex and heterogeneous response patterns
during primate forelimb movement, with
no apparent stable encoding of movement
v
1 mdv
2 mdv
3 mdv
4 mdv
5 mdv
8 mdv
6 mdv
7 md-
v
1 mp-v
2 mp-v
3 mp-v
4 mpC
4 2 6 8 10 12 14N spatial synergies v
md md 2 6 8 10 12 14 1 0G1
G2
4R
of
P
fit by
v
2 mp mN spatial synergies v
mp mpD
G1
G2
R
of
D
fit by
v
2 mdA
B
G2 EMG activity (a.u.)
G2 EMG, synergy coef
ficients (a.u.)
0.5 s
0.5 s
E
G2 synergy coef
ficients, EMG (a.u.)
TriR Del Pec TriU AbPL EDC ED23 ED45 BR FCR FDS FDPU FCU AbPB AdP OpP F5B ECU Bic a1 (t)md a2 (t)md a4 (t)md a3 (t)md a5 (t)md a6 (t)md a8 (t)md a7 (t)md TriR Del Pec TriU AbPL EDC ED23 ED45 BR FCR FDS FDPU FCU AbPB AdP OpP F5B ECU Bic TriR Del Pec TriU AbPL EDC ED23 ED45 BR FCR FDS FDPU FCU AbPB AdP OpP F5B ECU Bic
P
1 mP
2 mP
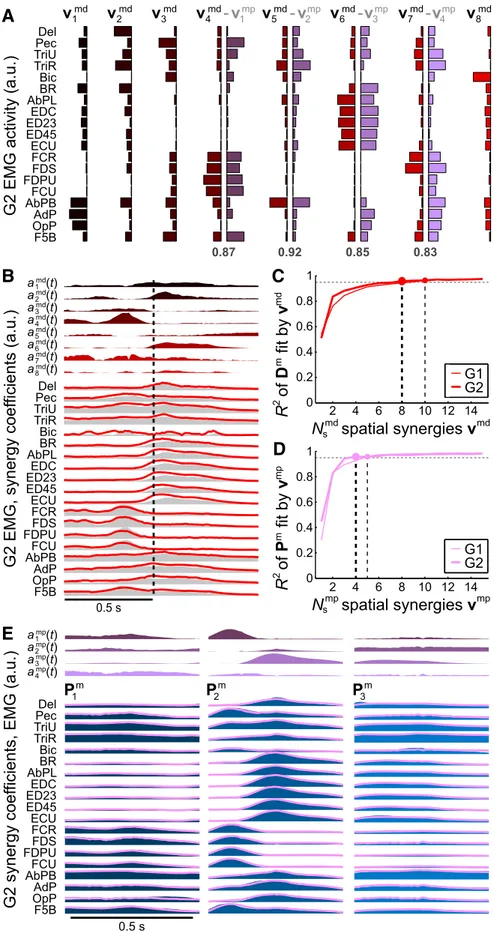
3 m 0.87 0.92 0.85 0.83 a1 (t)mp a2 (t)mp a4 (t)mp a3 (t)mp 0.2 0.4 0.6 0.8 1 0 0.2 0.4 0.6 0.8 m s sFigure 4. Hierarchical relationship between spatiotemporal and spatial muscle synergies. A, Eight spatial muscle synergiesvjmd for monkey G2, colored from black to red. Each spatial synergy vector shows the relative EMG activity of the muscles labeled at left. Four of the synergies could be matched with synergiesvjmp(purple) derived, not from the muscle data directly, but from spatio-temporal synergies derived in turn from those data (i.e., those illustrated inFig. 1A). The numbers below these paired synergies express the dot product between them. B, G2’s EMG activity (gray envelopes), as in trials with this sample object (the same as in
Figs. 1B and2B), could be reconstructed by a linear combination of the synergies (red lines), each given the optimized amplitude 4
time coursesajmd共t兲above (the black-to-red envelopes, col-ored as in A). C, EMG variability over all object conditions was well accounted for by reconstruction using spatial synergies. Either eight (G2) or 10 (G1) synergiesvjmd(circles) could re-construct 95% of the EMG data variability (horizontal dashed line). D, EMG data within the spatiotemporal synergiesPim could be reconstructed with 95% fidelity (as in C) using only four (G2) or five (G1) spatial synergies,vjmp, that had been derived from the spatiotemporal synergies. E, For example, G2’s three spatiotemporal muscle synergiesPim, repeated fromFigure 1A, could be well reconstructed (pink lines) by linear summation of the four spatial synergiesvjmp, for which the corresponding amplitude time courses␣jmp共t兲are shown above.
parameters (
Churchland et al., 2007
). Overall, such neurons do
not appear to be as well tuned to instantaneous motor parameters
as they are to the final multijoint posture terminating a
move-ment (
Aflalo and Graziano, 2006
) or to temporally extended
tra-jectories (
Hatsopoulos et al., 2007
;
Saleh et al., 2012
). Our results
extend these findings to the control of muscles. We show that
population-level activity reflects the presence of spatiotemporal
synergies— ones whose dimensionality, timing, and amplitude
modulation correspond with synergies independently inferred
from muscle recordings.
Although we could not show directly that spatiotemporal
neural synergies caused muscle synergies, the
⬃70 ms difference
in onset times was at least consistent with a causal relationship
between the central and peripheral expressions of the synergies.
Moreover, our analysis of single-trial reconstructions (
Fig. 3
B)
does suggest a relatively direct relationship between a
spatiotem-poral synergy observed in neural activity and then in muscle
ac-tivity around the time of object grasp. Although beyond the scope
of this report, other methods for comparing bases extracted from
spatiotemporal data from different sources, such as bidirectional
independent component averaged representation (
Brown et al.,
2012
,
2013
), could potentially be adapted for the muscular and
neural time series data considered here.
This evidence for a population-level encoding of
spatio-temporal synergies hardly rules out other encoding schemes.
For example, our results are broadly consistent with evidence
that object properties are encoded within forelimb areas of
primate motor cortex. Prior studies have found individual
units that specifically encode objects (
Georgopoulos et al.,
1999
) or the unique digits or grasping movements that they
may activate (
Poliakov and Schieber, 1999
). In other studies,
subsets of cells in PMd (
Stark et al., 2007a
), PMv (
Murata et
al., 1997
), and MI (
Mason et al., 2002
) have all been shown to
be sensitive to object shape, size, and other parameters that
can modulate primate prehension. Here, we did not examine
individual units or cortical areas for evidence that they
pref-erentially encode specific objects, object properties, or
pos-tures. Nevertheless, units controlling the recruitment of
spatiotemporal synergies would also be expected to
modu-late their discharge according to kinematic variables such as
object size.
Another encoding scheme to consider is the representation of
time-invariant spatial synergies. In contrast to spatiotemporal
synergies, many studies have focused on synergies defined as
si-multaneous recruitment of groups of muscles with invariant
lev-els of relative activation. Spinal cord studies have provided much
of the direct evidence for CNS control of spatial synergies. For
example, low-dimensional EMG patterns can be evoked by
chemical microstimulation in spinalized frogs (
Saltiel et al.,
2001
). In a similar preparation, intermediate zone spinal neurons
are less related to the EMG of individual muscles than to
spatial-synergistic premotor drives (
Hart and Giszter, 2010
). In
pri-mates, the spinal cord has been suggested as a substrate for spatial
synergies (
Cheung et al., 2009
) and its premotor interneurons
facilitate multiple muscles, including intrinsic hand muscles
(
Takei and Seki, 2010
).
Spatial synergies may also be encoded supraspinally in the
brainstem (
Roh et al., 2011
) or in the cortex. Within motor
cor-tex, firing rates of forelimb-related cells or ensembles can predict
spatial synergy combinations in rodents (
Kargo and Nitz, 2003
)
and EMG profiles in primates (
Morrow and Miller, 2003
;
Schieber and Rivlis, 2007
), in whom the strongest cell–EMG
cor-relations have also been observed to group into several clusters
that tend to resemble spatial synergies (
Holdefer et al., 2002
).
These “muscle fields” may be relatively hard-wired (
Kargo and
Nitz, 2003
), particularly in the case of corticospinal and
cortico-motoneuronal cells that project through the spinal cord to act on
small groups of muscles (
Fetz and Cheney, 1980
;
Bennett and
Lemon, 1994
;
Rathelot and Strick, 2009
). Recently, we showed
that EMG activity evoked by ICMS in monkeys could be
decom-posed into spatial muscle synergies similar to those seen in
natu-ral behavior (
Overduin et al., 2012
;
Santello et al., 2013
).
Consistent with a role of these spatial synergies in simplifying
motor control, evoked EMG patterns tend to sum linearly when
multiple points in motor cortex are stimulated together (
Ethier et
al., 2006
).
Given their discrete versus continuous control schemes, these
two conceptions of synergies, spatiotemporal and spatial, are too
fundamentally disparate to allow a simple test to determine
which provides a better explanation of the data. Instead, we
sug-gest that they are compatible rather than opposed (
Fig. 4
). In
particular, spatial synergies may be hard-wired and conscripted
together in the form of higher-level, spatiotemporal synergies
(
Drew et al., 2008
). The encoding of groups of synergistic muscles
by subpopulations of motor cortical units (
Yakovenko et al.,
2011
), together with the transient activation of these cells relative
to the more sustained firing of spinal neurons (
Shalit et al., 2012
),
suggest that the cortex could program spatiotemporal sequences
of activity across these muscle groups. The large cortical territory
related to the forelimb in primates may be specialized for solving
how to control this high-dimensional musculoskeletal apparatus
using learned combinations of lower-level primitives (
Berniker et
al., 2009
). The spatial synergies uninvolved in reconstructing
spa-tiotemporal synergies (i.e., the unmatched plots in
Fig. 4
A) may
capture feedback mechanisms or other control processes not
me-diated by spatiotemporal synergies.
In addition to demonstrating that motor cortical activity reflects
recruitment of spatiotemporal synergies, the present investigation is
the first to our knowledge to have applied spatiotemporal
(time-varying) synergy decomposition to single-unit data. Other
dimen-sionality reduction techniques have been used previously, including
locally linear embedding (
Churchland et al., 2007
) or modified
fac-tor analysis (
Santhanam et al., 2009
) including Gaussian-process
factor analysis (
Yu et al., 2009
). However, the non-negative matrix
factorization approach used in synergy decomposition may be better
suited to neural (and EMG) data than the above techniques. This is
both because unit firing rates (like muscular contractions) are
intrin-sically non-negative and because the spatiotemporal version of the
algorithm in particular can isolate temporally extended primitives.
There are important implications for the development of
neu-roprosthetics in our finding that the CNS may build complex
behaviors by combining spatiotemporal synergies (which
them-selves may be built from learned sequences of spatial synergies).
Motor neuroprostheses may allow paralyzed patients to bypass
damaged spinal circuits and control directly virtual or robotic
prostheses or functional electrical stimulation (FES) implants.
Most experiments to date have used subjects’ motor cortical
ac-tivity to continuously control computer cursor movements (
Ser-ruya et al., 2002
;
Taylor et al., 2002
;
Carmena et al., 2003
;
Ganguly
and Carmena, 2009
), robots (
Carmena et al., 2003
;
Hochberg et
al., 2012
;
Collinger et al., 2013
) or FES systems (
Moritz et al.,
2008
;
Pohlmeyer et al., 2009
) of up to four independent
dimen-sions. Researchers hope that, as the stability and density of
re-cording technology improve, subjects will be able to handle more
such degrees of freedom. However, if the CNS is wired to control
only a handful of spatiotemporal synergies, then neuroprosthetic
performance could degrade rapidly as further variables are
added. At the same time, if the brain is built to launch these
spatiotemporal synergies only once per movement rather than
continuously, this biological design feature could radically
sim-plify control architectures for neuroprosthetic systems.
References
Aflalo TN, Graziano MS (2006) Partial tuning of motor cortex neurons to final posture in a free-moving paradigm. Proc Natl Acad Sci U S A 103: 2909 –2914.CrossRef Medline
Bennett KM, Lemon RN (1994) The influence of single monkey corticomo-toneuronal cells at different levels of activity in target muscles. J Physiol 477:291–307.CrossRef Medline
Berger DJ, Gentner R, Edmunds T, Pai DK, d’Avella A (2013) Differences in adaptation rates after virtual surgeries provide direct evidence for modu-larity. J Neurosci 33:12384 –12394.CrossRef Medline
Berniker M, Jarc A, Bizzi E, Tresch MC (2009) Simplified and effective mo-tor control based on muscle synergies to exploit musculoskeletal dynam-ics. Proc Natl Acad Sci U S A 106:7601–7606.CrossRef Medline
Bizzi E, Cheung VC, d’Avella A, Saltiel P, Tresch M (2008) Combining mod-ules for movement. Brain Res Rev 57:125–133.CrossRef Medline
Brochier T, Spinks RL, Umilta MA, Lemon RN (2004) Patterns of muscle activity underlying object-specific grasp by the macaque monkey. J Neu-rophysiol 92:1770 –1782.CrossRef Medline
Brown KS, Grafton ST, Carlson JM (2012) BICAR: A new algorithm for multiresolution spatiotemporal data fusion. PLoS One 7:e50268.
CrossRef Medline
Brown KS, Kasper R, Giesbrecht B, Carlson JM, Grafton ST (2013) Repro-ducible paired sources from concurrent EEG-fMRI data using BICAR. J Neurosci Methods 219:205–219.CrossRef Medline
Carmena JM, Lebedev MA, Crist RE, O’Doherty JE, Santucci DM, Dimitrov DF, Patil PG, Henriquez CS, Nicolelis MA (2003) Learning to control a brain-machine interface for reaching and grasping by primates. PLoS Biol 1:E42.Medline
Cheung VC, Piron L, Agostini M, Silvoni S, Turolla A, Bizzi E (2009) Sta-bility of muscle synergies for voluntary actions after cortical stroke in humans. Proc Natl Acad Sci U S A 106:19563–19568.CrossRef Medline
Churchland MM, Yu BM, Sahani M, Shenoy KV (2007) Techniques for extracting single-trial activity patterns from large-scale neural recordings. Curr Opin Neurobiol 17:609 – 618.CrossRef Medline
Collinger JL, Wodlinger B, Downey JE, Wang W, Tyler-Kabara EC, Weber DJ, McMorland AJ, Velliste M, Boninger ML, Schwartz AB (2013) High-performance neuroprosthetic control by an individual with tetraplegia. Lancet 381:557– 664.CrossRef Medline
d’Avella A, Bizzi E (2005) Shared and specific muscle synergies in natural motor behaviors. Proc Natl Acad Sci U S A 102:3076 –3081.CrossRef Medline
d’Avella A, Saltiel P, Bizzi E (2003) Combinations of muscle synergies in the construction of a natural motor behavior. Nat Neurosci 6:300 –308.
Medline
d’Avella A, Portone A, Fernandez L, Lacquaniti F (2006) Control of fast-reaching movements by muscle synergy combinations. J Neurosci 26: 7791–7810.CrossRef Medline
d’Avella A, Fernandez L, Portone A, Lacquaniti F (2008) Modulation of phasic and tonic muscle synergies with reaching direction and speed. J Neurophysiol 100:1433–1454.CrossRef Medline
d’Avella A, Portone A, Lacquaniti F (2011) Superposition and modulation of muscle synergies for reaching in response to a change in target location. J Neurophysiol 106:2796 –2812.CrossRef Medline
Drew T, Kalaska J, Krouchev N (2008) Muscle synergies during locomotion in the cat: a model for motor cortex control. J Physiol 586:1239 –1245.
CrossRef Medline
Ethier C, Brizzi L, Darling WG, Capaday C (2006) Linear summation of cat motor cortex outputs. J Neurosci 26:5574 –5581.CrossRef Medline
Fetz EE, Cheney PD (1980) Postspike facilitation of forelimb muscle activity by primate corticomotoneuronal cells. J Neurophysiol 44:751–772.
Medline
Fishbach A, Roy SA, Bastianen C, Miller LE, Houk JC (2007) Deciding when and how to correct a movement: Discrete submovements as a decision making process. Exp Brain Res 177:45– 63.CrossRef Medline
Flash T, Hochner B (2005) Motor primitives in vertebrates and inverte-brates. Curr Opin Neurobiol 15:660 – 666.CrossRef Medline
Ganguly K, Carmena JM (2009) Emergence of a stable cortical map for neu-roprosthetic control. PLoS Biol 7:e1000153.CrossRef Medline
Georgopoulos AP, Kalaska JF, Caminiti R, Massey JT (1983) Interruption of motor cortical discharge subserving aimed arm movements. Exp Brain Res 49:327–340.Medline
Georgopoulos AP, Pellizzer G, Poliakov AV, Schieber MH (1999) Neural coding of finger and wrist movements. J Comput Neurosci 6:279 –288.
CrossRef Medline
Giszter SF (2015) Motor primitives-new data and future questions. Curr Opin Neurobiol 33:156 –165.CrossRef Medline
Giszter SF, Mussa-Ivaldi FA, Bizzi E (1993) Convergent force fields orga-nized in the frog’s spinal cord. J Neurosci 13:467– 491.Medline
Graziano MS, Taylor CS, Moore T (2002) Complex movements evoked by microstimulation of precentral cortex. Neuron 34:841– 851.CrossRef Medline
Graziano MS, Cooke DF, Taylor CS, Moore T (2004) Distribution of hand location in monkeys during spontaneous behavior. Exp Brain Res 155: 30 –36.CrossRef Medline
Griffin DM, Hudson HM, Belhaj-Saïf A, Cheney PD (2011) Hijacking cor-tical motor output with repetitive microstimulation. J Neurosci 31: 13088 –13096.CrossRef Medline
Griffin DM, Hudson HM, Belhaj-Saïf A, Cheney PD (2014) EMG activation patterns associated with high frequency, long-duration intracortical mi-crostimulation of primary motor cortex. J Neurosci 34:1647–1656.
CrossRef Medline
Hart CB, Giszter SF (2010) A neural basis for motor primitives in the spinal cord. J Neurosci 30:1322–1336.CrossRef Medline
Hatsopoulos NG, Xu Q, Amit Y (2007) Encoding of movement fragments in the motor cortex. J Neurosci 27:5105–5114.CrossRef Medline
Hochberg LR, Bacher D, Jarosiewicz B, Masse NY, Simeral JD, Vogel J, Had-dadin S, Liu J, Cash SS, van der Smagt P, Donoghue JP (2012) Reach and grasp by people with tetraplegia using a neurally controlled robotic arm. Nature 485:372–375.CrossRef Medline
Holdefer RN, Miller LE (2002) Primary motor cortical neurons encode functional muscle synergies. Exp Brain Res 146:233–243. CrossRef Medline
Kargo WJ, Nitz DA (2003) Early skill learning is expressed through selection and tuning of cortically represented muscle synergies. J Neurosci 23: 11255–11269.Medline
Keele SW (1968) Movement control in skilled motor performance. Psycho-logical Bulletin 70:387– 403.
Klein Breteler MD, Simura KJ, Flanders M (2007) Timing of muscle activa-tion in a hand movement sequence. Cereb Cortex 17:803– 815.Medline
Lee DD, Seung HS (1999) Learning the parts of objects by non-negative matrix factorization. Nature 401:788 –791.CrossRef Medline
Lemay MA, Grill WM (2004) Modularity of motor output evoked by in-traspinal microstimulation in cats. J Neurophysiol 91:502–514.Medline
Mason CR, Gomez JE, Ebner TJ (2002) Primary motor cortex neuronal discharge during reach-to-grasp: Controlling the hand as a unit. Arch Ital Biol 140:229 –236.Medline
Moritz CT, Perlmutter SI, Fetz EE (2008) Direct control of paralysed mus-cles by cortical neurons. Nature 456:639 – 642.CrossRef Medline
Morrow MM, Miller LE (2003) Prediction of muscle activity by populations of sequentially recorded primary motor cortex neurons. J Neurophysiol 89:2279 –2288.Medline
Murata A, Fadiga L, Fogassi L, Gallese V, Raos V, Rizzolatti G (1997) Object representation in the ventral premotor cortex (area F5) of the monkey. J Neurophysiol 78:2226 –2230.Medline
Overduin SA, d’Avella A, Roh J, Bizzi E (2008) Modulation of muscle syn-ergy recruitment in primate grasping. J Neurosci 28:880 – 892.CrossRef Medline
Overduin SA, d’Avella A, Carmena JM, Bizzi E (2012) Microstimulation activates a handful of muscle synergies. Neuron 76:1071–1077.CrossRef Medline
Overduin SA, d’Avella A, Carmena JM, Bizzi E (2014) Muscle synergies evoked by microstimulation are preferentially encoded during behavior. Front Comput Neurosci 8:20.Medline
Pohlmeyer EA, Oby ER, Perreault EJ, Solla SA, Kilgore KL, Kirsch RF, Miller LE (2009) Toward the restoration of hand use to a paralyzed monkey: Brain-controlled functional electrical stimulation of forearm muscles. PLoS One 4:e5924.CrossRef Medline