Università degli Studi di Catania
Dottorato di Ricerca in Fisica – XXII ciclo.
___________________________________________________________
CLAUDIO CHIBBARO
Mono-crystalline Silicon Photovoltaic Cells:
Innovative Technologies toward low Series Resistance
PhD Thesis
PhD Coordinator:
Tutor:
Contents
Introduction...4
Chapter 1 - The Role of Photovoltaic inside the Global Energy Production 1.1 ENERGY ISSUE OVERVIEW...7
1.1.1 Fossil fuels...8
1.1.2 Nuclear power...11
1.2 ENVIRONMENTAL EFFECTS AND GLOBAL WARMING...14
1.3 RENEWABLE ENERGY...16
1.4 PHOTOVOLTAIC ENERGY...19
1.4.1 History of photovoltaics...20
1.4.2 PV technology generations...22
1.4.3 PV market: status and forecast...25
References...29
Chapter 2 - The Photovoltaic Cell: Fundamentals, Working Principles and Electrical Characteristic 2.1 INTRODUCTION...31
2.2 SOLAR IRRADIATION...31
2.3 WORKING PRINCIPLES OF A SILICON PV CELL...32
2.3.1 Photon/Semiconductor interaction...33
2.3.2 Photovoltaic cell fundamentals...34
2.4 PV CELL EQUIVALENT CIRCUIT AND I-V CHARACTERISTIC...35
2.5 THEORETICAL EFFICIENCY...38
2.5.1 Efficiency and band gap...38
2.5.2 Quantum efficiency...40
2.6 SILICON WAFER-BASED PV CELL MANUFACTURING
PROCESS FLOW...45
References...48
Chapter 3 - Simulation of Photovoltaic Cells Electrical Behavior 3.1 INTRODUCTION...49
3.2 ELECTRICAL MODEL USED FOR THE SIMULATION...49
3.2.1 Photogenerated current...50
3.2.2 Diode characteristic...51
3.3 SIMULATIONS RESULTS...52
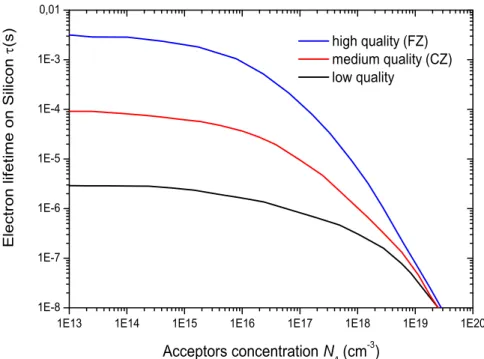
3.3.1 Silicon quality...54
3.3.2 Emitter thickness...57
3.3.3 Emitter doping level...58
3.3.4 Base thickness...60
3.3.5 Base doping level...61
3.3.6 Back surface recombination velocity...63
3.3.7 Parasitic resistances. ...65
References...68
Chapter 4 – A Real Industrial Process for Low-Cost, High Efficiency Silicon PV Cells 4.1 INTRODUCTION. ...69
4.2 MANUFACTURING PROCESS FLOW STEPS ANALYSIS...70
4.2.1 Grinding. ...70
4.2.2 Texturing...72
4.2.3 Emitter diffusion...78
4.2.4 Anti-reflection coating...85
4.2.5 Edge isolation...89
4.2.6 Front and back side contacts... ...92
Contents
4.3.1 Equipment functioning and simulation results...100
4.3.2 ZnO deposited film structural and electrical properties...105
4.3.3 ZnO deposited film optical properties...108
4.3.4 Effect of ZnO coating on PV cell……...114
References...119
Chapter 5 - A New Method to Evaluate the Series Resistance of PV Cells from I-V Characteristics 5.1 INTRODUCTION...121
5.2 STANDARD METHODS...121
5.3 A NEW METHOD: THOERY...124
5.4 APPLICATION TO SILICON PV CELLS...126
5.4.1 Double diode approximation...128
5.4.2 Single diode approximation...130
5.5 RESULTS AND COMPARISON TO OTHER METHODS...130
References...137
An increasing consensus of scientific opinion now agrees that occurring global climate change is caused in large part by human activities and, if left unopposed, it will have catastrophic environmental consequences. The scientific evidence on the need for urgent action on the problem of global warming has today become realistic and convincing. This evidence is reflected also in the conclusions of the Intergovernmental Panel on Climate Change (IPCC), an U.N. institution of more than 1000 scientists providing information to policy makers.
To keep rising temperatures within acceptable limits, mankind needs to significantly reduce, as soon as possible, greenhouse gas emissions (in particular carbon dioxide CO2) related especially to the present dependence on fossil fuels
in energy production. Thus, climate change requires a global energy revolution based on new solutions in the way that energy is produced and distributed. Future solutions are already available today and lie in an intensive use of existing renewable sources.
Inside this context, photovoltaic energy represents a realistic accessible opportunity to accelerate the end of this Petroleum Age and to satisfy the energy requirement of our society by means of a sustainable technology which offers several advantages, in spite of few and acceptable drawbacks.
The role of the photovoltaic energy inside the big picture of the social, economical and environmental questions regarding the global energy production is illustrated in the chapter 1.
The resistance offered today to the development of the photovoltaic energy production on global scale resides mainly in its high costs. Although a photovoltaic module gives back in only few years the energy used to be manufactured, at the present it requires some tens of years to return economically its cost. The building cost of a photovoltaic power plant is much expensive in comparison with that one of an equivalent traditional thermal plant. For example, the cost of a portable oil-stoked electric generator with an output power of 1KW is about one order of magnitude less of the price of a power-correspondent photovoltaic module.
Today, comprehensive cost of energy produced by a conventional silicon wafer-based PV cell is about 2÷5$/Watt. So, in respect of the price of energy traditionally produced by fossil fuels, photovoltaic does not appear economically cost-effective in the short-term.
However, removing the costs related to energy source supplying, the economical benefits connected to solar energy could be observed as time goes by. In fact, considering that a photovoltaic device provides electric power within the time of about twenty years (its common lifetime), energy produced by a photovoltaic module having a power peak of 1W during its entire life is about 30KWh. From this point of view, the price of energy production by photovoltaic generators becomes few cents of dollars per KWh. Adding the costs of modules
Introduction
manufacturing and installation, of the conversion from direct to alternate current and of system maintenance, a comprehensive price of about 10 cents of dollar per KWh is finally obtained.
Others financial considerations, concerning invested capital time return, profits variation due to inflation and so on must be obviously taken into account to privates’ investments. From these, the need of government financial supports to validate economical investments in photovoltaic energy production rises. Nevertheless, a complete estimation of the global costs related to energy production by burning fossils including also environmental and healthy effects (normally not included in standard economical indexes), makes photovoltaic a real and actual reasonable alternative to conventional technologies. Unfortunately, the irresponsible modern logic of capital short-term profit imposes a competition strictly connected to the economical standard parameters which do not evaluate long-term consequences.
Therefore, photovoltaic energy manufacturer today are hardly working in order to reduce considerably the price of produced electric power. Even if technological developments suggest that a target cost of few cents per Watt produced by photovoltaic cells could be reached in the next future by new emerging photovoltaic technologies, first generation devices (single junction, wafer-based cells) still represent the majority of available photovoltaic equipments on the market and crystalline silicon is the most common material used to produce the cells.
The working principles and the electrical characteristic of a single junction silicon photovoltaic cell are explained in chapter 2.
The electric performance of a photovoltaic cell depends on several parameters, often interdependent between themselves. Whatever should be the structure of a cell, the optimization of its structural parameters is necessary to get the higher achievable efficiency. With this purpose, a simulation program of photovoltaic devices electrical behaviour has been developed for exploring the full range of silicon wafer-based cells design options to find the best manufacturing process flow. The realized simulation program has been used to analyze the most important parameters determining silicon photovoltaic cell performance, with the purpose of improving physical and geometrical factors influencing device efficiency.
The simulation program and the relative results are illustrated inside chapter 3. From an industrial prospective, the use of a simulation program is an indispensable R&D technique because it provides several advantages in terms of both cost saving and response time velocity. The primary interest of the main industries engaged in the photovoltaic field is now to remain inside the production sphere of the most common first generation cells, with the principle purposes of finding novel design alternatives directed toward product quality, manufacturing cost reduction and energy saving.
In chapter 4 a real silicon photovoltaic cell industrial manufacturing process is described. The illustrated manufacturing line has been planned and realized in
Catania, by means of a collaboration between Meridionale Impianti (M.I.) S.p.A., UniCt (University of Catania), Advanced Technology Solutions (A.T.S.) S.r.l. and Meridionale Impianti Welding Technology (M.I.W.T) S.r.l.. The project, financed by the Technologic Innovation Fund (F.I.T.) is entitled “R&D
program directed toward the realization of novel high efficiency photovoltaic cells and modules”.
Data obtained by research and simulation activities have permitted to create a prototype productive line, aimed at production of high efficiency and low-cost first generation silicon photovoltaic cells. In order to reach higher quality at lower cost, some innovative solutions have been adopted inside the manufacturing flow to optimize the process steps. The principal innovation concerns the deposition of a thin layer of transparent conductive oxide on cell surface as both front contact and passivation. The deposited film has been optically and electrically characterized with the purpose of getting the best process parameters set up. An evaluation of its effects on cell performance has been also evaluated.
Results are reported again in chapter 4.
One of the most important improvement obtained by using a transparent conductive oxide as surface coating was the decreasing of electrical parasitic resistance due to front contact. The measurement of these very low resistances (in the order of few mΩ) involved several problems regarding measures accuracy and repeatability. The experimental evaluation of such resistance values demonstrated the inadequacy of standard measurement methods because of some their intrinsic limits.
Consequently a new procedure has been developed and realized to overcome these limits. The description of this novel measurement procedure and a series of tests to verify its reliability are reported in chapter 5.
1. The Role of Photovoltaic inside the
Global Energy Production
1.1 - ENERGY ISSUE OVERVIEW
It is well known that people quality of life is directly connected to energy availability. Various statistical indexes show the correlation between energy consumption and human average lifetime, death rate, life expectancy and educational achievement. As the most versatile form of energy we have is electricity, access to and consumption of electricity is closely related with quality of life. Figure 1.1 shows, for example, the Human Development Index (H.D.I.) for over 60 countries (including about 90% of the Earth’s population) as a function of annual per capita electricity use [1].
The H.D.I. measures inter-country development levels on the basis of three so-called “deprivation” indicators: life expectancy, adult literacy and the logarithm of purchasing power.
The growing aspirations of an increasing world population are expected to enlarge world energy demand, even if strong attempts have been made to improve energy efficiency. To progress the quality of life in many countries, as measured by their H.D.I., global electricity consumption demand will raise in
Annual per capita electricity use (kWh)
H u m an d ev el o p m en t in d ex
Annual per capita electricity use (kWh)
H u m an d ev el o p m en t in d ex Italy An nu al p er cap ita el ect ric ity u se (kW h) H um an d ev elo pm en t in de x An nu al p er cap ita el ect ric ity u se (kW h) H um an d ev elo pm en t in de x
the next future by factors of 10 or more, from a few hundred to a few thousand kilowatt-hrs (KWh) per year.
As shown in figure 1.2, the present annual world consumption increasing is about 3%: in 1996 world energy consumption was ~1.1∙105TWh while ten years
later was ~1.4∙105TWh [2]. The International Energy Outlook 2009 (IEO2009)
developed by the U.S. Energy Information Administration (E.I.A.) reports a scenario in which total world consumption of marketed energy is projected to increase by 44% from 2006 to 2030, if current laws and policies will remain unchanged throughout the entire period. The largest increase in energy demand is expected for the developing countries, dominated by Chinese and Indian economies.
projection projection
One of the most critical question mankind has to answer quickly at present, is how to satisfy this energy request. In fact, especially during the last few years, increasing demand and growing consumption has posed several challenges: ensuring sufficient, reliable and safe energy supplies, develop new energy sources (making adequate investments in new technologies) and, above all, dealing with environmental effects.
Therefore, energy issue occupies today a central role in global economy and countries development.
1.1.1 – Fossil fuels
Figure 1.2 shows that majority of energy production today is entrusted to fossil fuels: chemical energy stored in fossil fuels (such as coal, fuel oil, natural gas or
Figure 1.2 World energy consumption from 1980 to 2006 and predictions. Total world consumption of marketed energy is projected to increase by 44% from 2006 to 2030. [2]
Chapter 1 - The Role of Photovoltaic Inside The Global Energy Production
oil shale) is converted at first into thermal energy by burning process, then in mechanical energy and, finally, in electricity. The conversion efficiency of this process chain has obtained a continuous improvement and now globally it is about 40%. Electric energy production by fossil fuels today is the less expensive and covers more than half of energy world demand.
On the other hand, this kind of energy is polluting, renewable, non-sustainable and finally not widely available.
Figure1.3 shows the world proved petroleum reserves known at the end of 2008. On the base of actual consumption, according to oil companies’ reports, is estimated that petroleum could end within next 50 years, natural gas within 60 years and coal within about 200 years [3].
0 100 200 300 400 500 600 700 800
Total Middle East Total Europe & Eurasia
Total Africa Total S. & Cent. America
Total North America
Total Asia Pacific
B ill io n o f b a rr e ls
Nevertheless, these evaluations are optimistic because do not take in account three important factors: real entity of existent reserves, periodical production increment and difficulty in fossil extraction from exhaustion deposits. Resources valuation is not an exact science and every assertion must be provided with a probability degree. OPEC members often enlarge their reports because fossil fuel exportable quantity is proportional to reserves.
Realistic valuations report that global petroleum reserve amount to about 1000 billion of barrels.
Moreover, it’s important to note that a critical phase that could destabilize present consumption rate of fossil fuels will begin not only when reserves will be exhaust, but when production will be reduced. According to the M.King Hubbert model, for any given geographical area, the rate of petroleum
production tends to follow a bell-shaped curve with a peak followed by a decreasing. Petroleum annual production from 1930 and Hubbert predictions are shown in figure 1.4 [4]. A n n u a l p ro d u c ti o n ( b il li o n o f b a rr e ls ) Year A n n u a l p ro d u c ti o n ( b il li o n o f b a rr e ls ) Year
For every area, peak is expected to occur before 2015. At the present, this decreasing has not been still observed because technological improvements have allowed exploiting offshore oilfield more and more deep and fossil deposits with less quality.
However, only few deposits under the ocean abyss and the Antarctic sea remain to be explored and new important deposits improbably will be located. Yet, the recent environmental disaster due to the explosion of the BP platform “Deepwater Horizon” occurred in the Gulf of Mexico has underlined the risks connected to offshore oil extraction.
As shown in figure 1.5 natural reserves appear in evident decline: 80% of petroleum produced today comes from deposits discovered before 1973 and, for this reason, already widely exploited [4].
Figure 1.4 World petroleum productions (with prediction). According to M.King Hubbert model, for any given geographical area the rate of petroleum production tends to follow a bell-shaped curve with a peak followed by a decreasing. [4]
Chapter 1 - The Role of Photovoltaic Inside The Global Energy Production
Figure 1.5 World petroleum reserves. [4]
In spite of that, petroleum global demand is growing continuously and its consumption is increasing, especially in developing countries. Once exceeded the peak of figure 1.4, petroleum production will reduce and exporting countries will be forced to increase prices. So, if petroleum demand will not reduce, in the next future prices will grow very quickly and fossil fuel energy production will not be still economically favourable.
Economical long-term analysis and environmental effects (as will be described inside paragraph 1.2) impose to accelerate the end of this Petroleum Age in order to investigate new kinds of energy production.
1.1.2 – Nuclear power
Today, the most used alternative to fossils fuels is the nuclear energy: in 2009 about 15% of the world's electricity came from nuclear power. This kind of electric energy production is based on controlled nuclear reaction and the most widely used fuel by nuclear plants is Uranium-235, suitable for nuclear fission because its atoms are easily split apart. Even if uranium is quite common, U-235 is relatively rare because less of 1% of uranium ore contains U-235. So, to be used in energy production, uranium must be processed (“enrichment”) to increase the concentration of U-235.
The cost of electricity from nuclear energy is somewhat higher than the cost of electricity by fossils. Amount of the cost comes not from the fuel source but from building and monitoring the plant: the economics of nuclear power are primarily influenced by the high initial investment required to construct a plant. To pay off this cost, it is more profitable to run the plants as long as possible, or
Figure 1.5 World petroleum reserves. 80% of petroleum produced today comes from deposits discovered before 1973. [4]
construct additional reactor blocks inside existing facilities. In 2009, new nuclear power plant construction costs were rising faster than the costs of other types of power plants. In actual market, nuclear power does not appear cost competitive with coal and natural gas.
Today, around the world, nuclear energy production is attracting new interest as countries need to increase the diversity of their energy supplies and improve energy availability, providing alternative to fossil fuels. However, there is considerable uncertainty associated with nuclear power. Uranium is not a renewable source (like fossils) although it is a common metal found in rocks all over the world. It is considered that at actual utilization rate, Uranium reserves will exhaust in about 100÷200 years [5].
In addition, nuclear energy have some intrinsic unresolved issues that restrict its future development. These issues concern above nuclear weapons proliferation, radioactive waste disposal and plant safety.
Manufacturing a nuclear bomb requires fissile material, either Uranium-235 or Plutonium-239. Most nuclear reactors use Uranium as a fuel and produce Plutonium during their operation. It is practically impossible to protect a large reprocessing plant to prevent the diversion of Plutonium to nuclear weapons. A small-scale Plutonium separation plant can be built in four to six months, so any country with an ordinary reactor can produce nuclear weapons relatively quickly.
The result is that nuclear power and nuclear weapons have grown up together. Since international controls on nuclear proliferation began, Israel, India, Pakistan and North Korea have all obtained nuclear weapons, demonstrating the link between civil and military nuclear power. Also the United Nations Intergovernmental Panel on Climate Change (representing the work of 2,500 scientists from more than 130 countries) has notified that the security danger of trying to face climate change with a global fast reactor programme (using Plutonium fuel) “would be colossal”. IPCC specifies that to solve the twin questions of climate change and nuclear weapons proliferation it is necessary to phase out nuclear power and promote sustainable energy [6].
Concerning the issue of radioactive waste disposal, the supporter of nuclear industry declare that nuclear waste can be ‘disposed’ by burying it deep underground. This method is a false solution, because it does not guarantee forever the isolation of radioactive material from the environment: a deep dump only slows down the release of radioactivity into the environment. The most dangerous waste is the highly radioactive waste (or spent) fuel removed from nuclear reactors, which stays radioactive for hundreds of thousands of years. There are about 270,000 tonnes of spent nuclear waste fuel in storage, much of it at reactor sites. Spent fuel is accumulating at around 12,000 tonnes per year, with approximately a quarter of that going for reprocessing (process that leaves behind a highly radioactive liquid waste). No country in the world has a definitive solution for high level waste. The only real solution is to stop producing the waste.
Chapter 1 - The Role of Photovoltaic Inside The Global Energy Production
A nuclear and radiation accident is defined by the International Atomic Energy Agency as "an event that has led to significant consequences to people, the environment or the facility. Examples include lethal effects to individuals, large radioactivity release to the environment, or reactor core melt." [7]. Windscale (1957), Three Mile Island (1979), Chernobyl (1986) and Tokaimura (1999) are only a few of the hundreds of nuclear accidents which have occurred to date. A nuclear chain reaction must be kept under control and dangerous radiation must be contained within the reactor with radioactive products isolated from humans and carefully managed. Nuclear reactions generate high temperatures, and fluids used for cooling are often kept under pressure. Together with the intense radioactivity, these operating conditions make the reactor a very complex tool to manage, where to prevent every potential accident type (coolant losses, equipments failure, human errors, etc.) is impossible.
0 5 10 15 20 25 30 35 1 3 4 5 6 7 8 9 10 11 12 13 14 15 16 17 18 19 20 21 22 23 24 25 26 27 28 29 30 31 32 33 34 35 36 37 38 39 40 41 42 43 Age O p e ra ti n g R e a c to rs
As shown in figure 1.6, most of the world’s reactors are more than 20 years old and, consequently, they are more subjected to age related failures. Many utilities are attempting to extend their life from the about 40 years they were originally designed for, to around 60 years posing new risks [5] [7].
Table 1.1 summarize costs and some limitations and externalities of fossils and nuclear power generation: traditional resources are finite, polluting, and not long-term economically favourable. So it seems clear that to face electricity consumption increasing requirement there is the necessity to find alternative energetic sources, renewable and easily available [2] [8].
Figure 1.6 Nuclear operating reactors by age. Most of the world’s reactors are more than 20 years old. Many utilities are attempting to extend their life from the about 40 years they were originally designed for, to around 60 years. [5]
Table 1.1 - Traditional Power Generation
Method Cents/kWh Limitations and Externalities
Gas Currently supplies around 15% of the global electricity demand. 3.9 - 4.4 Cents$/kWh
A relatively high percentage of the cost/KWh is derived from the cost of the fuel. Due to the current (and projected future) upwards trend in gas prices, there is uncertainty around the cost / KWh over the lifetime of plants.
Gas burns more cleanly than coal, but the gas itself (largely methane) is a potent greenhouse gas. Coal Currently supplies around 38% of the global electricity demand. 4.8 - 5.5 Cents$/kWh
To build new coal plants in the developed world is increasingly difficult due to environmental requirements governing the plants.
The supply of coal is plentiful, but the coal generation method is perceived to make a larger contribution to air pollution than the rest of the methods combined. Nuclear Currently supplies around 24% of the global electricity demand. 11.1 - 14.5 Cents$/kWh
Political difficulties in using nuclear in some nations. Risk of widespread (and potentially lethal) contamination upon containment failure.
Fuel is plentiful, but problematic.
Waste disposal remains a significant problem, and de-commissioning is costly.
1.2 - ENVIRONMENTAL EFFECTS AND GLOBAL WARMING
Production and consumption of any type of energy have environmental consequences. Effects of this kind of human activities are well known for a lot of time, but only in last decades the risks connected to these effects have been realized.
During most of human history (and certainly before human beings emerged as a dominant species in the whole world) all climate changes were the direct result of only natural forces. This condition changed with the start of the industrial revolution, when new agricultural and industrial practices began to modify atmospheric chemical composition altering the global climate.
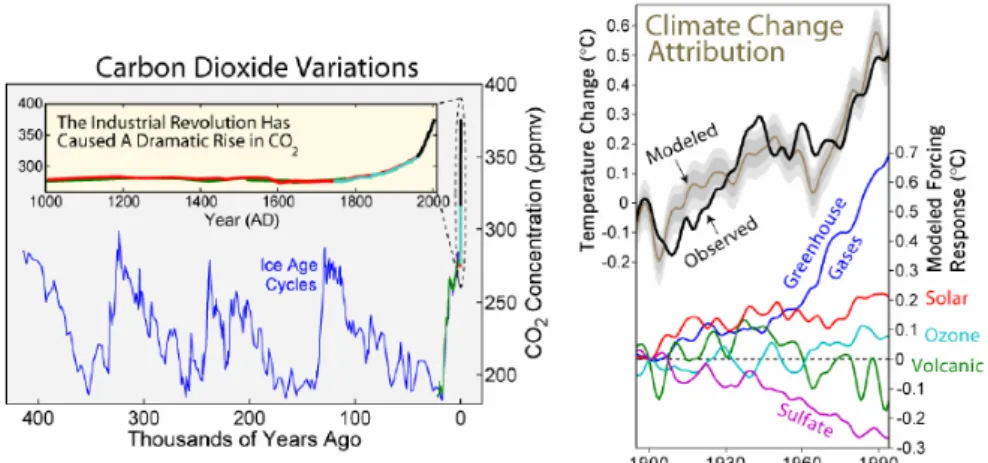
Population growth, deforestation, factory farming, and the widespread use of fossil fuels are creating an excess of greenhouse gases in the atmosphere, contributing to a more and more evident global climate changing. Evidence of this change is shown in figure 1.7 where Carbon dioxide (CO2) variations from
400 thousand of years ago to today (fig.1.7a) and temperature change from 1900 to 1990 (fig.1.7b) are plotted [8].
Chapter 1 - The Role of Photovoltaic Inside The Global Energy Production
Global surface temperature increased 0.74±0.18°C within the 20th century, in accordance with the greenhouse gas concentration trend. This observed increase in the average temperature of the Earth's near-surface air and oceans since the mid-20th century is defined “global warming”.
The IPCC report published in February 2007 stated that human activity "very probably" has been the primary cause of global warming since 1950. The IPCC report illustrates that human activity has been a major contributor to climate change since the start of the industrial revolution in the mid-1700s and that most of the observed temperature increase since the middle of the 20th century was caused by increasing concentrations of greenhouse gases resulting from human activity. The report concludes that variations in natural phenomena such as solar radiation and volcanoes produced most of the warming from pre-industrial times to 1950 and had a small cooling effect after. These basic conclusions have been supported by more than 40 scientific societies and academies of science, including all of the national academies of science of the major industrialized countries.
Climate model projections summarized in the latest IPCC report indicate that the global surface temperature will probably rise from 1.1 to 6.4 °C during the twenty-first century. The uncertainty in this estimate arises from the use of models with differing sensitivity to greenhouse gas concentrations and the use of differing estimates of future greenhouse gas emissions. Most studies focus on the period up to the year 2100. However, warming is expected to continue beyond 2100 even if emissions stop, because of the large heat capacity of the oceans and the long lifetime of Carbon dioxide in the atmosphere [6] [8].
An increase in global temperature will cause sea levels to rise and will change the amount and pattern of precipitation, probably including expansion of
Figure 1.7 a) World CO2 variations from 400 thousand of years ago to today.
b) Temperature changes from 1900 to 1990. Most of the observed temperature increase since the middle of the 20th century was caused by increasing concentrations of greenhouse gases resulting from human activities. [8]
subtropical deserts. The continuing retreat of glaciers, permafrost and sea ice is expected, with warming being strongest in the Arctic. Other possible effects include increases in the intensity of extreme weather events, species extinctions, and changes in agricultural yields.
Political and public debate continues regarding climate change, and what actions to take in response. Most national governments have signed and ratified the Kyoto Protocol aimed at reducing greenhouse gas emissions. In figure 1.8 the annual Carbon emission by Region, from 1800 to 2000 is shown [8].
Consequently renewed attention is now given to the development and utilization of renewable sources of energy in response to the growing interest in climate change and secure and affordable supplies of energy for economic and social development. If expected growing world energy demand will be met only with fossil fuels, carbon dioxide emissions will increase considerably, not decreasing as implied by the IPCC report.
1.3 – RENEWABLE ENERGY
Renewable energy is defined as energy generated from natural resources (such as sunlight, wind, rain, tides and geothermal heat) which are renewable (naturally replenished constantly) not depleted, and that minimize environmental impact.
Renewable energy flow to the Earth's land surface is thousands of times greater than mankind's present rate of total energy use. The use of only a small fraction
Chapter 1 - The Role of Photovoltaic Inside The Global Energy Production
of this resource would provide humanity with an alternative and environmentally path to meet future energy needs. The question is if this flow of energy can be converted to electricity at acceptable costs in a sustainable manner. Table 1.2 illustrates costs, limitations and externalities of conventional renewable power generation [2] [6] [8].
Table 1.2 - Conventional Renewable Power Generation
Method Cents/kWh Limitations and Externalities
Wind
Currently supplies approximately 1.4% of the global electricity demand. Wind is considered to be about 30% reliable.
4.0 - 6.0 Cents/kWh
Wind is currently the only cost-effective alternative energy method, but has several problems. Wind farms are highly subject to lightning strikes, have high mechanical fatigue failure, are limited in size by hub stress, do not function well, if at all, under conditions of heavy rain, icing conditions or very cold climates, and are noisy and cannot be insulated for sound reduction due to their size and subsequent loss of wind velocity and power.
Geothermal
Currently supplies approximately 0.23% of the global electricity demand. Geothermal is considered 90-95% reliable.
4.5 – 30 Cents/kWh
New low temperature conversion of heat to electricity is likely to make geothermal substantially more plausible and less expensive. Generally, costs diminish as plant dimension increases. Cost also depends on the depth to be drilled and on the temperature at the depth. The higher the temperature, the lower the cost per KWh. Cost may also be affect by where the drilling is to take place as concerns distance from the grid and another factor may be the permeability of the rock. Hydro
Currently supplies around 19.9% of the global electricity demand. Hydro is considered to be 60% reliable.
5.1 - 11.3 Cents/kW-h
Hydro is currently the only source of renewable energy making substantive contributions to global energy demand. Hydro plants, however, can (obviously) only be built in a limited number of places, and can significantly damage aquatic ecosystems. Solar
Currently supplies approximately 0.8% of the global electricity demand.
10 - 30 Cents/kWh
Solar power has been expensive, but soon is expected to drop to as low as 3.5 cents/kW-h.
An evaluation of the potential contribution of renewable energies concludes that, given adequate support, renewable energy technologies could meet much of the growing demand at prices lower than those usually forecast for conventional energy. As presented in figure 1.9 and figure 1.10, in a renewables-intensive
global energy scenario, renewable energy could account by the middle of the twenty-first century for three-fifths of the world's electricity market and two-fifths of the market for fuels used directly [9].
0,0E+00 5,0E+01 1,0E+02 1,5E+02 2,0E+02 2,5E+02 3,0E+02 3,5E+02 1985 2025 2050 D ir e c t fu e l u s e ( E x a jo u le p e r y e a r) Coal Petroleum Gas Biomass Renewables
Figure 1.9 The renewables-intensive global energy scenario, 1985-2050: electricity generation. [9]
Figure 1.10 The renewables-intensive global energy scenario, 1985-2050: direct fuel use. [9]
0,0E+00 5,0E+03 1,0E+04 1,5E+04 2,0E+04 2,5E+04 3,0E+04 3,5E+04 4,0E+04 1985 2025 2050 T W h p er y ea r Coal Petroleum Gas Nuclear Hydro Biomass
Chapter 1 - The Role of Photovoltaic Inside The Global Energy Production
Moreover, a transition to a renewables-intensive energy economy would provide environmental and other benefits not measured in standard economic accounts: because renewable energy is expected to be competitive with conventional energy, such benefits could be achieved at no additional cost. These benefits are tabulated below.
Table 1.3 - The benefits of renewable energy not captured in standard economic accounts
Social and economic development
Production of renewable energy, can provide economic development and employment opportunities especially in areas that otherwise have limited opportunities for economic growth. Renewable energy can thus help reduce poverty in rural areas and reduce pressures for urban migration.
Reduced air pollution
Renewable-energy technologies produce virtually no emissions associated with urban air pollution and acid deposition.
Abatement of
global warming Renewable energy use does not produce carbon dioxide and other greenhouse emissions that contribute to global warming. Even the
use of biomass fuels will not con tribute to global warming: the carbon dioxide released when biomass is burned equals the amount absorbed from the atmosphere by plants as they arc grown for biomass fuel.
Reducing the risks of nuclear weapons proliferation
Competitive renewable resources could reduce incentives to build a large world infrastructure in support of nuclear energy, thus avoiding major increases in the production, transportation, and storage of plutonium and other nuclear materials that could be diverted to nuclear weapons production.
Renewable energy sources are perpetual and guarantee a secure supply, minimizing dependency on outside energy suppliers. At the same time, the use of renewable energy cuts emissions of carbon dioxide, addressing environmental concerns. In this context, photovoltaic technology offers a key solution for energy issue due to its unique features: it is safe, clean, robust and proven to be efficient and highly scalable. Photovoltaic is easy to introduce and implement (in “stand-alone” or “grid connected” systems) all over the world, in both developed and developing countries.
1.4 - PHOTOVOLTAIC ENERGY
The majority of renewable energy technologies are powered by the sun. Solar energy (radiant light and heat from the sun) has more distribution across the Earth than other forms of renewables such as wind or hydro that are available only in select places: solar energy is spread out across the entire Earth surface.
The available solar energy resources are 3.8YJ/yr (120,000TW). Less than 0.02% of available resources are sufficient to entirely replace fossil fuels and nuclear power as energy source [2].
Photovoltaics (or “PV”) is the field of technology and research related to the devices which directly convert sunlight into electricity. The elementary building block of the photovoltaic technology is the solar cell which works generating direct current electrical power (measured in Watts) from semiconductors when it is illuminated. The direct conversion of sunlight into electricity is a very elegant process to generate environmentally friendly, renewable energy. This technology presents several advantages compared to conventional fossil fuel energy production: source is vast and essentially infinite, there are no emissions, combustion or radioactive fuel for disposal (does not contribute perceptibly to global climate change or pollution). Photovoltaic systems operate at ambient temperature (no safety issues) and have a very low operating cost because there is no need of any fuel. Moreover PV modules can be installed quickly at nearly any point-of-use, integrated into new or existing building structures and have high reliability (>20 years).
On the other hand, photovoltaics presents some issues and drawbacks: energy source is diffuse (sunlight is a relatively low-density energy), installation costs are very high, and there is a poor reliability of auxiliary (Balance of System) elements. To be noted that several of these disadvantages are non-technical but related to economics and infrastructure (lack of widespread commercially available system integration and installation so far and lack of economical efficient energy storage).
1.4.1 - History of photovoltaics
Although discovered in 1839, the process of producing electric current in a solid material with the support of sunlight was not really understood for more than a hundred years. Only during the second half of the 20th century, the science has been refined and the process has been more fully explained.
The photovoltaic effect was first recognised in 1839 by French physicist Alexandre-Edmond Becquerel. At only 19, Becquerel found that certain materials would produce small amounts of electric current when exposed to light. But this effect remained a curiosity of science for the next three quarters of a century.
It was first studied in solids, such as selenium, by Heinrich Hertz in the 1870s. As a result, Selenium was quickly adopted in the emerging field of photography for use in light-measuring devices. However, it was not until 1883 that the first solar cell was built by Charles Fritts, who coated the semiconductor Selenium with an extremely thin layer of Gold to form the junctions. The device was only about 1% efficient. Major steps toward commercializing PV were taken in the 1940s and early 1950s, when the Czochralski process was developed for producing highly pure crystalline silicon. Russell Ohl patented the modern solar cell in 1946 [10]. Sven Ason Berglund had a prior patent concerning methods of
Chapter 1 - The Role of Photovoltaic Inside The Global Energy Production
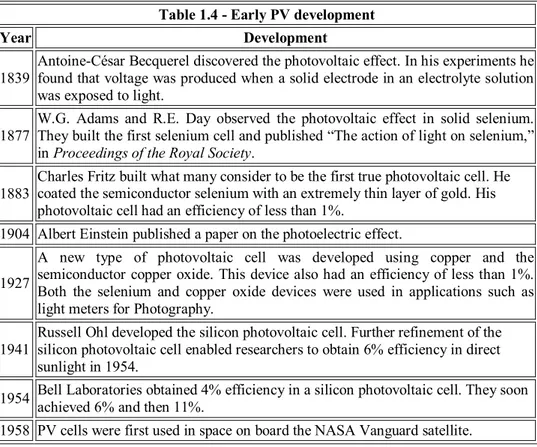
increasing the capacity of photosensitive cells. The modern age of solar power technology arrived in 1954 when Bell Laboratories, experimenting with semiconductors, accidentally found that silicon doped with certain impurities was very sensitive to light. In 1954, in fact, scientists at Bell Laboratories developed the first crystalline silicon PV cell, having an efficiency of 4%. Table 1.4 reports the early steps of the PV development [11].
Table 1.4 - Early PV development
Year Development
1839 Antoine-César Becquerel discovered the photovoltaic effect. In his experiments he found that voltage was produced when a solid electrode in an electrolyte solution was exposed to light.
1877 W.G. Adams and R.E. Day observed the photovoltaic effect in solid selenium. They built the first selenium cell and published “The action of light on selenium,” in Proceedings of the Royal Society.
1883 Charles Fritz built what many consider to be the first true photovoltaic cell. He coated the semiconductor selenium with an extremely thin layer of gold. His photovoltaic cell had an efficiency of less than 1%.
1904 Albert Einstein published a paper on the photoelectric effect. 1927
A new type of photovoltaic cell was developed using copper and the semiconductor copper oxide. This device also had an efficiency of less than 1%. Both the selenium and copper oxide devices were used in applications such as light meters for Photography.
1941 Russell Ohl developed the silicon photovoltaic cell. Further refinement of the silicon photovoltaic cell enabled researchers to obtain 6% efficiency in direct sunlight in 1954.
1954 Bell Laboratories obtained 4% efficiency in a silicon photovoltaic cell. They soon achieved 6% and then 11%. 1958 PV cells were first used in space on board the NASA Vanguard satellite.
During PV technology development, various materials have been investigated in order to obtain high-quality photovoltaic cells, evaluated by two fundamental criteria: efficiency (ratio of the electric power output to the light power input) and production cost. According to this criteria, cells have been developed following three main ways, called ‘generations’ in the industry, defined by the types of semi-conductors and manufacturing techniques used.
First generation refers to single junction, high quality and low defect single crystal photovoltaic devices. These cells have high efficiencies and are approaching to the efficiency limit for single band gap devices. As shown in figure 1.11, such devices are not expected to get lower than 1$/W [12].
Second generation technology involves low cost and low energy intensity growth techniques such as vapour deposition and electroplating. Such processes can bring costs down to a little under 0.50$/W but because of the defects
inherent in the lower quality processing methods, second generation cells have much reduced efficiencies compared to first generation.
Third generation derives from the progression of photovoltaic know-how and it is somewhat ambiguous in the technologies that it includes. Third generation PV cells are potentially able to overcome the efficiency limit of 31-41% for single band-gap PV cells.
Presently, there is concurrent research into all three generations but first generation devices (single junction, wafer-based cells) still represent the majority of available photovoltaic equipment on the market and crystalline silicon is the most common material used to produce PV cells.
1.4.2 - PV technology generations
The first photovoltaic generation consists of a large-area, single layer n-p junction diode, which is capable of generating usable electrical energy from light sources with the wavelengths of sunlight. Self supporting semiconductor wafers (polycrystalline or mono-crystalline) of ~300µm thick are fabricated and then soldered together to form a module.
These cells are typically made using a silicon wafer: silicon wafer-based technology was first developed more than 50 years ago at Bell Laboratories in New Jersey. Mono-crystalline silicon wafers are normally made using the Czochralski process and most commercial mono-crystalline cells have efficiencies on the order of 16%.
Single crystal cells tend to be expensive, and because they are cut from cylindrical ingots, they cannot completely cover a module without a substantial waste of refined silicon. Poly or multi crystalline are made from cast large
Figure 1.11 Efficiency and cost projections for the three generations of photovoltaic technology. [12]
Chapter 1 - The Role of Photovoltaic Inside The Global Energy Production
blocks of molten silicon carefully cooled and solidified. These cells are cheaper than single crystal cells, but also rather less efficient. However, they can easily be formed into square shapes that cover a greater fraction of a panel than mono-crystalline cells, and this compensates their lower efficiencies.
The first generation technology is technically proven and reliable and represents the dominant technology in the commercial production of photovoltaic cells, accounting for more than 86% of the solar cell market.
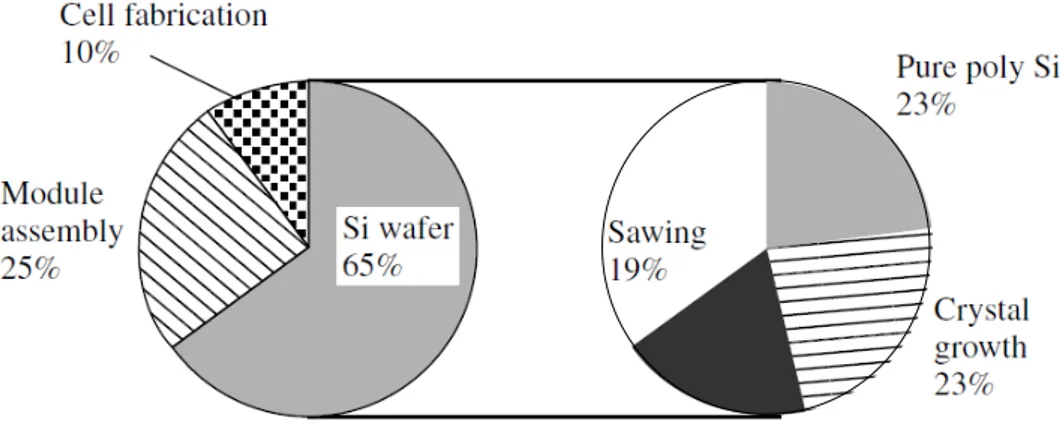
Nevertheless, there are several inherent limitations and drawbacks to this generation. Silicon wafers are fragile, making processing difficult and limiting potential applications. The process is very laborious and energy intensive and manufacturing plant capital costs are high. Finally, because materials represent more than 60% of manufacturing costs and silicon supply is finite, the long term potential for cost reduction is insufficient to deliver broadly affordable energy. Figure 1.12 shows breakdown of costs in the fabrication of silicon wafer-based PV modules [13].
The second generation of photovoltaic cells is based on the use of semiconductors thin-film deposits produced generally using chemical vapour deposition techniques, typically plasma enhanced (PE-CVD). These devices were initially designed to be high-efficiency, as multiple junction photovoltaic cells. Later, the main advantage of using a thin-film of semiconductor was noticed to be the reduction of the mass of the material required and, consequently, the reduction of manufacturing cost. Currently there are different technologies and materials under investigation such as amorphous silicon, poly-crystalline silicon, micro-poly-crystalline silicon, cadmium telluride, copper indium selenide/sulfide (CIS). Amorphous silicon and CIS are the two most important thin-film approaches at present in production, with efficiencies around 8% and 11% respectively.
Figure 1.12 Breakdown of costs in the fabrication of a Si-wafer-based PV module. The right side presents the wafer costs. Materials represent more than 60% of manufacturing costs. [13]
Typically, the efficiencies of thin-film solar cells are lower compared with silicon (wafer-based) solar cells, but manufacturing costs are also lower, so that a lower price in terms of $/Watt of electrical output can be achieved. The semiconductor mass reduction allows also to fit panels on light materials or flexible materials but the loss of efficiency causes the necessity to enlarge the module area to obtain a suitable output current.
Third generation contains a series of new devices based on innovative technologies. These new devices include quantum dot cells, tandem/multi-junction cells, intermediate band solar cells, hot-carrier cells and non-semiconductor cells (polymer solar cells, dye-sensitized titania solar cells, organic photovoltaics). It has been estimated that third generation PV technologies will achieve higher efficiencies and lower costs than first or second generation.
Figure 1.13 illustrates the various commercial large-area module energy conversion efficiencies and the best laboratory efficiencies obtained for various materials and technologies [14] [15].
The most efficient solar cells devices developed to date are the one based on multijunctions. As organic cells technology (built from thin films of organic semiconductors such as polymers and small-molecule compounds) is quite new, it is difficult to predict their development.
Despite the numerous attempts to produce better solar cells by using new materials and technologies, today the photovoltaics market is still dominated by
Figure 1.13 Best-research-cell efficiency. The most efficient solar cells devices developed to date are the one based on multijunctions. [15]
Chapter 1 - The Role of Photovoltaic Inside The Global Energy Production
silicon wafer-based solar cells (first-generation solar cells). Consequently, a large field of research is currently committed to create silicon wafer-based solar cells that can achieve higher conversion efficiency without an excessive increase in production cost. The aim of the research is to achieve the lowest $/Watt solar cell design that is suitable for commercial production.
The propose of today’s PV research and manufacturing is to produce a low cost PV system, that mean not only low-cost-efficient solar cells, but also low cost efficient system including mounting hardware, power conditioning electronics, storage, tracking, and so on (Table 1.5).
Table 1.5 - Goals of current solar cell research and manufacturing • Use less semiconductor material by making thinner cells.
• Use less expensive semiconductor materials.
• Improve solar cell performance with less expensive, less perfect semiconductors. • Even with this poorer material keep a high production yield, that is, reduce the number of cells or modules rejected by the quality control.
• Increase material utilization by reducing waste in semiconductor and cell fabrication. • Increase solar cell flux on the solar cells by using concentrators without increasing cost or optical losses too much. In this way, less semiconductor material is used.
• Increase solar radiation utilization by absorbing more of the spectrum efficiently. • Increase speed and throughput of manufacturing processes.
• Simplify processing steps (this reduces fabrication costs and increases the yield) and reduce equipment costs.
• Reduce costs and improve reliability of BOS (auxiliary elements).
1.4.3 - PV market: status and forecast
Solar power is one of the worldwide fastest-growing sources of renewable energy. Many nations, concerned about the environmental impacts of electricity generation from fossil fuels, nuclear plant or hydroelectric plants, have been turning to solar power as an environmentally alternative. The potential for large-scale applications of solar power has improved considerably in recent years. At present, the cost of electricity produced from photovolatics generally is too high to compete with extensive electricity. On the basis of installed price per megawatt, photovoltaic installations are relatively costly, because the panel components are expensive and the conversion of solar energy to electricity in the cells still is inefficient. From conversion efficiencies of 4% to 6% for the first solar cells built in the 1950s, there has been an improvement to efficiencies of about 16% for modern commercial wafer-silicon cells. This efficiency gain, coupled with other technological progresses, has reduced the cost of photovoltaic capacity from approximately 300$ per Watt in 1956 to less than 5$ per Watt in 2009. EIA’s Annual Energy Outlook 2009 projects that, by 2030, capacity costs for new generating plants using solar photovoltaics will be 37% lower than the 2009 costs. In addition, the efficiency of solar PV applications is expected to improve as the technology continues to be developed.
Nevertheless, prices for electricity from photovoltaics may not become widely competitive with prices for electricity from conventional generating technologies within the next 25 years. They may be competitive with high retail electricity prices just in sunny regions where the cost can be as low as 0.23$/KWh and may compete with the delivered price of electricity to retail customers in areas where electricity prices are high, as they are in California, Southern Spain, and Italy [2] [16] [17].
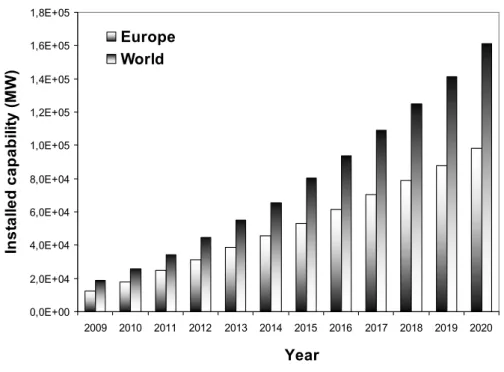
However, the current levels of dependence on fossil fuels, the need of reducing the Carbon dioxide emissions associated with energy production and the prospects of developing a new and extremely innovative technology sector, make photovoltaics increasingly attractive. As shown in figure 1.14, in the last years the photovoltaic market expanded extensively. The annual world growth in sales of photovoltaics was over 33% per year from 1995 to 2000. In 2007 grid-connected photovoltaic electricity was the fastest growing energy source, with installations of all photovoltaics increasing by 83% in 2009 to bring the total installed capacity to 15 GW. Assuming that our rate of usage in 2005 remains constant, we could run out of conventional oil in 40 years (2045), coal in 154 years (2159) [17]. 0,0E+00 2,0E+04 4,0E+04 6,0E+04 8,0E+04 1,0E+05 1,2E+05 1,4E+05 1,6E+05 1,8E+05 2009 2010 2011 2012 2013 2014 2015 2016 2017 2018 2019 2020 Year In s ta lle d c a p a b ili ty ( M W ) Europe World
Figure 1.14 Evolution and forecast of World and European PV market. The annual
world growth in sales of photovoltaics was over 33% per year from 1995 to 2000. In 2007 grid-connected photovoltaic electricity was the fastest growing energy source, with installations of all photovoltaics increasing by 83% in 2009 to bring the total installed capacity to 15 GW. [17]
Chapter 1 - The Role of Photovoltaic Inside The Global Energy Production
The growth trend of the principal solar PV countries guides the investors to their investment decisions. Photovoltaic technology is gaining market share in countries where diminishing prices and government-backed financial incentives have led to increase usage. Solar technologies have benefited from much research and development over the past two decades, bringing down the delivered price of solar electricity.
Photovoltaic systems today are more than 60% cheaper than they were in the 1990. The focus lies now on cost reduction in order to reach competitiveness with all sources of electricity in the medium term. In the 1997 White Paper, the European Commission set a target of 3GW of photovoltaic capacity to be installed in Europe by 2010. The White Paper target, already exceeded in 2006, has been more than tripled in 2008, with a total cumulative capacity of more than 9.5GW achieved. This illustrates an increase of 200% compared to 2006. In 2010 the total cumulative capacity installed in the European Union could be as much as 16GW.
The European photovoltaic industry currently has an important role in photovoltaic technology development, capturing about 30% of the world market of photovoltaic modules. More than 56% of the EU photovoltaic installations are located in Germany that is the leader in photovoltaic installation: after the renewable energy law came into effect in 2004 with a feed-in tariff of 27cents per KWh, profits from photovoltaics have risen more than 10 times since 2003. The market stagnated somewhat in 2006 with installed capacity of 830 MW compared with 866 MW in 2005. There are more than 80 companies involved in production of thin-layer technology in Germany [18].
In order to increase the adoption of photovoltaics and its competitiveness in all EU Member States, it is necessary to create an attractive financial support that could encourage the growth of the PV industry. The possibilities are wide, ranging from investment support (capital grants, tax exemptions or reductions on the purchase of goods) to operating support (price subsidies, green certificates, tender schemes and tax exemptions or reduction on the production of electricity). Another crucial aspect is the reduction of administrative difficulties and grid barriers.
In summary, it is very probable that photovoltaics will become in the next half century one of the most important source of world electricity. Public support and global environmental concerns will keep photovoltaics viable, visible, and vigorous both in new technical developments and user applications. Nations which encourage photovoltaics will be leaders in this shining new technology, leading the way to a cleaner, more equitable twenty-first century, while those that ignore or suppress photovoltaics will be left behind in the green, economic energy revolution. The technical potential of PV electricity is high enough to contribute considerably to the abatement of the human-made global CO2
problem. With the help of medium-term financial supports and long-term energy taxes (motivated by external costs), the technical potential may be exploited economically. Under grid-coupled operation, photovoltaics will most probably
become cost-effective for distributed peak power production and for applications in the building sector (as cladding element). Solar electricity generation has to grow by three orders of magnitude before it encounters a (extrapolated) 10% level of the global electricity demand. Assuming ambitious growth rates, this process of transformation will take some decades.
Chapter 1 - The Role of Photovoltaic Inside The Global Energy Production
References
[1] Benka S., Phys. Today (2002).
[2] U.S. EIA – U.S. Energy Information Administration, International
Energy Outlook 2009.
[3] BP, Statistical Review of World Energy 2009. [4] Tozzi M., L’Italia a secco (2006).
[5] The Uranium Institute - Twenty Fourth Annual International Symposiums - Supply of Fuel for Nuclear Power, Present Situation
and Perspectives (1999).
[6] Fourth Assessment Report of the Intergovernmental Panel on Climate Change (IPCC) (2007).
[7] IAEA - International Atomic Energy Agency (2010).
[8] U.S. Department of Energy (DOE) - Carbon Dioxide Information Analysis Center (CDIAC).
[9] Johansson, T. B., H. Kelly, A. K. N. Reddy, and R. H. Williams (eds.). 1993. Renewable Energy: Sources for Fuels and Electricity. Washington, D.C.: Island Press.
[10] "Light sensitive device" U.S. Patent 2,402,662.
[11] D. M. Chapin, C. S. Fuller, and G. L. Pearson; J. Appl. Phys. 25, 676 (1954).
[12] M.A. Green, Third Generation Photovoltaics: Ultra-High Efficiency at
Low Cost, Springer-Verlag, Berlin (2003).
[13] Luque A., Hegedus S., Handbook of photovoltaic science and
engineering, John Wiley & Sons, New York, NY (2003).
[14] M. A. Green, Third Generation Photovoltaics: Advanced Solar
Energy Conversion (2003).
[15] Lawrence Kazmerski, NREL - National Renewable Energy Laboratory (2010).
[16] John G., Global Solar Photovoltaic Market Analysis and Forecasts
to 2020 (2009).
[17] EER – Emerging Energy Research, Global Renewable Power Generation Forecasts: 2010-2025 (2010).
2. The Photovoltaic Cell:
Fundamentals, Working Principles
and Electrical Characteristic
2.1 – INTRODUCTION
Basically, semiconductor photovoltaic cells are very simple devices. Semiconductors have the capacity to absorb light and to utilize a portion of the energy absorbed from incident photons to generate charge carriers (electron-hole pairs); a semiconductor diode separates and collects the photo-generated carriers and conducts the electrical current preferentially in a specific direction.
Thus, a solar cell is simply a semiconductor diode designed and constructed to efficiently absorb and convert light energy from the sun into electrical energy. Inside this chapter the fundamental notions indispensable to understand the working of a PV cell (theoretical model, equivalent circuit, electrical characteristic) are explained. Finally, a brief description of the silicon wafer-based PV cell manufacturing process flow is given.
2.2 – SOLAR IRRADIATION
Development, optimization and characterization of photovoltaic cells involve a certain knowledge of the used energy source: the sun.
Sun surface behaves like a black body at about 5800K with an emission peak situated on a wavelength of 500nm and a power of about 60MW/m2. Just above
Earth’s atmosphere the radiation intensity is about 1.35kW/m2; on Earth surface,
instead, this irradiance is weighted over different factors: absorption by molecules composing atmosphere, climatic conditions, season and latitude of observation site [1]. Gas like Ozone (for wavelength lower than 0.3μm) carbon dioxide and water vapour (for infrared below 2μm) absorb energies close their bonding energy causing “holes” inside visible solar spectrum on soil. Moreover, dust and aerosol induce an absorption distributed almost on entire spectral range, leading a global reduction of incident power.
To compare and unify performances of photovoltaic cells it has been instituted the notion of Air Mass. The Air Mass is a measure of how absorption in the atmosphere affects spectral content and intensity of the solar radiation reaching Earth’s surface. The Air Mass number is given by
cos
1
where θ is the angle of incidence (θ=0° when the sun is directly overhead). As defined, the Air Mass number is always greater than or equal to one at Earth’s surface. A widely used standard for comparing PV cell performance is the AM1.5 spectrum normalized to a total power density of 1kW/m2.
The spectral content of sunlight at the Earth’s surface has also a diffuse, indirect component (due to scattering and reflection in the atmosphere and surrounding landscape) which can account up to 20% of the light incident on a PV cell. The Air Mass number is consequently further defined in accordance with the measured spectrum, if it includes or not the diffuse component. An AM1.5g (global) spectrum includes the diffuse component, while an AM1.5d (direct) does not.
Black body (T = 5762 K), AM0, and AM1.5g radiations spectra are shown in figure 2.1 [1] [2]. Wavelength (μm) In ci d en t P o w er ( W /c m 2/μ m )
2.3 – WORKING PRINCIPLES OF A SILICON PV CELL
The generation of electric current in a solid material with the aid of sunlight is made by devices using photon/semiconductor interaction. The photovoltaic effect is the physical process through which a solar cell converts sunlight into electricity.
Figure 2.1 The radiation spectrum of a black body at 5762K compared
Chapter 2 - The Photovoltaic Cell: Fundamentals, Working Principles and Electrical Characteristic 2.3.1 – Photon/Semiconductor interaction
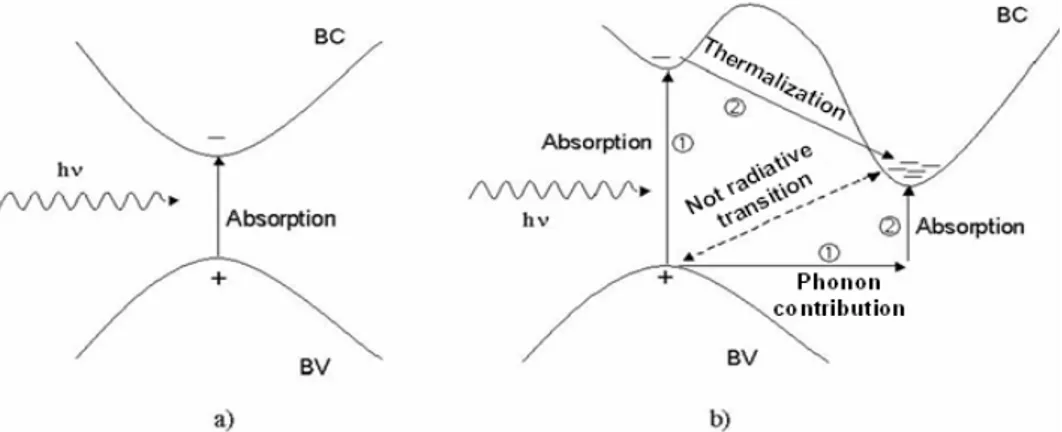
The presence of a gap in the energy band structure is the fundamental characteristic of semiconductors material that allows making use of photovoltaic effect. Figure 2.2 shows the different possible transitions according to gap nature. When the minimum of the conduction band (BC) and the maximum of the valence band (BV) have the same crystal momentum value, the gap is called direct. When they do not align, the gap is said to be indirect. Transitions inter bands in the case of direct band-gap occur “vertically” and are radiative: this kind of transition is illustrated in figure 2.2a.
This process is impossible in an indirect band gap, because conservation of crystal momentum would be violated. Consequntely radiative transition process in an indirect band gap material must also involve absorption or emission of a phonon (figure 2.2b). In the case of indirect band-gap (as in silicon) electronics transitions between bands limits are “oblique” and involve a change of electron
k-vectors.
The interaction between photons and semiconductor is explained by an essential characteristic of the material: the absorption coefficient. It indicates the number of photons absorbed per unit of thickness as a function of incident wavelength (or energy). Figure 2.3 shows the silicon absorption coefficient and photons penetration depth inside silicon versus incident wavelength [3].
Figure 2.2 Inter bands electronics transitions inside a semiconductor. a) Direct band gap
semiconductor. b) Indirect band gap semiconductor. Transitions inter bands in the case of direct band-gap occur “vertically” and are radiative. Transition process in an indirect band gap material must involve the absorption or emission of a phonon to guarantee the conservation of the crystal momentum
A b so rp tio n c o ef fici e n t ( cm -1) Wavelength (nm) P e n etr a tio n d e pth (μ m ) A b so rp tio n c o ef fici e n t ( cm -1) Wavelength (nm) P e n etr a tio n d e pth (μ m )
For wavelength lower than 365nm, majority of incident photons is absorbed inside first 100Å of material. For longer wavelength direct transitions are no more possible: it’s necessary that at least a phonon would be emitted or absorbed so that electron could drop to conduction band. This process reduces transition probability so the silicon absorption coefficient decreases on increasing of wavelength. When photons energy becomes smaller than band gap energy, transition can not occur and photons are not absorbed.
2.3.2 – Photovoltaic cell fundamentals
The absorption mechanism at the origin of the photovoltaic cell working is the creation of electron-hole pairs by means of incident photons energy transfer to semiconductor crystal lattice. Solar energy conversion in electric energy via photovoltaic cell is based on to two steps:
photons (with energy higher than band-gap energy Egap) absorption inside semiconductor by creation of electrons-holes pairs
collection of photogenerated charges.
The most common PV cell is configured as a silicon n-p junction that, for simplicity, could be imagined as constituted by the direct contact between a layer of n-type silicon with a layer of p-type silicon. When an n-p junction is formed, since there is a concentration difference of holes and electrons between the two types of semiconductors, holes diffuse from the p-type region into the
n-Figure 2.3 Silicon absorption coefficient and photons penetration depth. For wavelength lower than 365nm, majority of incident photons is absorbed inside first 100Å of material. [3]

![Figure 2.12 Silicon wafer-based PV cell typical process flow. [8]](https://thumb-eu.123doks.com/thumbv2/123dokorg/4519214.34855/48.892.217.663.341.601/figure-silicon-wafer-based-cell-typical-process-flow.webp)