December 2014
International PhD Program in
Neuropharmacology
XXVII Cycle
Neuroprotective effects of PACAP, VIP and NAP
against hyperglycaemic retinal damage
PhD thesis
Soraya Scuderi
Coordinator: Prof. Salvatore Salomone
Tutor: Prof. Velia D’Agata
Department of Biomedical and Biotechnological Sciences
University of Catania - Medical School
2
3 TABLE OF CONTENTS ACKNOWLEDGEMENTS………..………..……..4 LIST OF ABBREVIATIONS………...………..……..5 ABSTRACT……….………..…….7 GENERAL INTRODUCTION……….………..……..9
Diabetic retinopathy and visual impairment………9
Current treatment of diabetic retinopathy .……….11
Neurodegeneration in the diabetic retina.………...12
Neuropeptides and diabetic retinopathy.………19
Models for testing neuroprotective drugs………...23
AIMS ………..………...25
CHAPTER I - Different retinal expression patterns of IL-1 α, IL-1 β, and their receptors in a rat model of type 1 STZ-induced diabetes………..26
CHAPTER II - Davunetide (NAP) protects the retina against early diabetic injury by reducing apoptotic death………...50
CHAPTER III - Ameliorative effect of PACAP and VIP against increased permeability in a model of outer blood retinal barrier dysfunction………...80
GENERAL DISCUSSION AND CONCLUSIONS...106
GENERAL LIST OF REFERENCES...110
4
ACKNOWLEDGEMENTS
First, I would like to thank my mentor, Professor Velia D'Agata, Univeristy of Catania, who introduced me to the world of research and scientific thinking. Without her invaluable support and encouragement, I would have never successfully completed this project.
I am also grateful to Professor Filippo Drago and Professor Salvatore Salomone, Univeristy of Catania, for the opportunity to attend this exciting and dynamic PhD program, a very important period of scientific and personal growth.
I am thankful to Professor Bucolo Claudio, Univeristy of Catania, for his kind support and useful advice for the in vivo animal model of DR in the first and second study.
Thanks to all my co-authors who contribute to these works sharing with me their knowledge.
I would like to express my gratitude to my mentors, Professor Flora Vaccarino and Professor Hanna Stevens, Yale University, for their guidance throughout my research experience abroad.
My very sincere thanks to all the staff, friends and colleagues of the Department of Biomedical and Biotechnological Sciences Univeristy of Catania; Child Study Center Yale University, with whom I shared many valuable experiences.
Thanks to Doctor Alessandro Castorina, Doctor Salvo Giunta and Doctor Agata Grazia D’Amico for their friendship and positive attitude towards my research activity.
Finally I take this opportunity to be grateful to my parents and Letterio, for their love, support, patience and understanding
5
LIST OF ABBREVIATIONS
AC Adenylate Cyclase
ADNF Activity-Dependent Neurotrophic Factor
ADNP Activity-Dependent Neuroprotective Protein
ARVO Research In Vision And Ophthalmology
AS Angiostatin
BRB Blood-Retinal Barrier
CAT Catalase
DMO Diabetic Macular Oedema
DR Diabetic Retinopathy
EPO Erythropoietin
ERK 1/2 Extracellular Signal-Regulated Kinase 1/2
GABA γ-aminobutyric acid
GCL Ganglion Cell Layer
GPCR G-Protein Coupled Receptor
GSH Glutathione
IDDM Insulin-Dependent Diabete Mellitus
IL-1α Interleukin -1α
IL-1β Interleukin -1β
IL-1Ra Interleukin-1 receptor antagonist
IL-1RI Interleukin -1 receptor type I
IL-1RII Interleukin-1 receptor type II
INL Inner Nuclear Layer
IPL Inner Plexiform Layer
JNK c-Jun-N-terminal kinase
MAPKs Mitogen-Activated Protein Kinases
NAP Davunetide
6
NIDDM Non-Insulin-Dependent Diabete Mellitus
ONL Outer Nuclear Layer
OPL Outer Plexiform Layer
OS/IS Outer and inner segments of rods and cones
PACAP Pituitary adenylate cyclase-activatingpeptide
PDGF Platelet-derived growth factor
PDR Proliferative diabetic retinopathy
PEDF Pigment epithelium-derived factor
PHI Peptide histidine-isoleucine
PKA Protein kinase A
PKC Protein kinase C
RGCs Retinal ganglion cells
ROS Reactive oxygen species
RPE Retinal pigmented epithelium
SOD Superoxide dismutase
STZ Streptozotocin
TNF- α Tumor necrosis factor-α
VIP Vasoactive intestinal polypeptide
7
ABSTRACT
Diabetic retinopathy (DR), one the most significant and disabling chronic complications of diabetes mellitus, has mainly been regarded as a microcirculatory disease of the retina. However, there is emerging evidence to suggest that a primary and early neurodegenerative process characterizes DR. The reason for the retinal degeneration resides in the metabolic changes caused by hyperglycemia and in the decreased capability of the retina to adapt to this environment. This situation leads to altered expression patterns of neuropeptides, growth and transcription factors, apoptosis, increased oxidative stress, inflammatory response, angiogenesis and disruption of the blood-retinal barrier (BRB). All major cell types of the retina are affected: neuronal as well as the glial cells and pigment epithelial cells.
Pituitary adenylate cyclase activating polypeptide (PACAP), vasoactive intestinal peptide (VIP) and davunetide (NAP) are three pleiotropic related neuropeptides also expressed in the retina. Their protective role has been shown in different retinal injuries, but little is known about the relationship between these peptides and DR.
The aim of the present thesis was to investigate, using both in vitro and in vivo model of DR, the role of these peptdides on retinal layers by monitoring apoptotic events by western blot and confocal microscopy analysis and measuring the integrity of the outer blood retinal barrier with permeability and transepithelial electrical resistance assay. The underlying signal transduction pathways activated by each peptide and the impact of hyperglicaemia on the expression and distribution at retinal levels of the inflammatory IL-1 mediators were also evaluated. Diabetes was mimicked in adult rats by intraperitoneal injection of streptozotocin (STZ) and human retinal pigment epithelial cells
8
(ARPE19) were cultured for 26 days in high glucose (25mM of D-glucose) and IL-1β.
The results confirmed that hyperglycemia induced early apoptotic death in the cellular components of the neuroretina, breakdown of the outer blood retinal barrier (BRB) and dysregulation of several components of the metabolic and signaling pathways. The neuropeptides tested activate promising pathways useful for the treatment of this retinal degenerative disease. In particular, PACAP and VIP promote the integrity of the outer BRB, possibly through the modulation of proteins related to tight junctions. Davunetive is able to reduce apoptosis in the diabetic retina by activating the anti-apoptotic p-Akt, p-ERK1, p-ERK2, Bcl-2 and decreasing levels of the pro-apoptotic elements, such as cleaved caspase-3. These results raise the opportunity for the use of these peptides as a possible therapeutic or preventive methods in treating diabetes.
9
GENERAL INTRODUCTION
Diabetic retinopathy and visual impairment
The prevalence of diabetes is increasing worldwide. According to the World Health Organization (WHO), the total number of people with diabetes is expected to rise to an estimated 300 million cases by the year 2025 [1]. The onset of diabetes immediately increases the possibility for the patient to develop a broad spectrum of irreversible complications [2].
The term diabetes mellitus indicates a group of metabolic disorders characterized by hyperglycaemia and impaired insulin signalling. The disease is usually classified into type 1 diabetes, type 2 diabetes, and other specific types including gestational diabetes. Type 1 diabetes, also known as insulin-dependent diabetes, constitutes about 5-10% of all cases of diabetes. It is characterized by the destruction of β-pancreatic cells, leading to absolute insulin deficiency. This failure to produce insulin can be autoimmune-mediated or idiopathic. Type 2 diabetes, also known as non-insulin-dependent diabetes, constitutes 90-95% of all diabetes cases and results from insulin resistance, inadequate compensatory insulin secretory response, or both. It is characterized by reduced responsiveness of the cells in the body to insulin and consequently less ability to transfer glucose out of the circulation [3]. Complications resulting from diabetes can be largely divided into microvascular or macrovascular categories. Microvascular complications include diabetic retinopathy, diabetic neuropathy, and diabetic nephropathy. Macrovascular complications include
10
cerebrovascular disease, coronary heart disease, and peripheral vascular disease.
Diabetic retinopathy (DR) is one of the most significant and disabling chronic complications of diabetes mellitus [4]. DR can be divided into two clinical stages: nonproliferative and proliferative diabetic retinopathy (PDR). During thr nonproliferative stage of DR, altered permeability of capillaries leads to the formation of microaneurysms, the earliest visible sign of retinal damage. Abnormal capillary permeability results in leakage of fluid and solutes into the surrounding retinal tissue, which accumulate around the macula; causing macular oedema (DMO). As the severity of DR increases, the growth of new capillaries on the surface of the retina from preexisting vascular beds (neovascularization) causes vascular irregularities in the retina, like the occlusion of capillaries and ischaemia. This process defines PDR. However, these vessels are fragile and haemorrhage easily, and the resulting accumulation of blood in the vitreous cavity causes serious visual impairments in diabetic patients. It has been estimated that without treatment for PDR, 50% of all patients will become blind within 5 years following the diagnosis [5]. About one-third of the diabetic population has signs of DR, and one-tenth has vision-visual impairments form DMO and PDR. Tight control of blood glucose levels and blood pressure are essential in preventing or arresting the progression of DR. However, these therapeutic objectives are difficult to achieve, even with strict glycemic control, and as a consequence, PDR and DMO still appears at proportionately high rates in patients with both type I (insulin-dependent diabete mellitus, IDDM) and type 2 (non-insulin-dependent diabete mellitus, NIDDM) diabetes during the evolution of the disease [6]. Population studies indicate that DR afflicts approximately 93 million people worldwide and this number is
11
expected to increase as the prevalence of type 2 diabetes continues to climb, representing a significant socioeconomic cost for healthcare system worldwide [7].
The global prevalence of DR highlights the importance of searching for new approaches beyond the current standards of treatment for diabetes. Furthermore, there is abundant data to suggest that diabetes not only affects the entire neurovascular unit of the retina, but causes an early loss of neurovascular function, gradual neurodegeneration, gliosis, and neuroinflammation before any observable vascular damages. Therefore, the study of the underlying mechanisms that lead to neurodegeneration will be essential for identifying new therapeutic targets in the early stages of DR.
Current treatments for Diabetic Retinopathy
E maintenance and restoration of functions of the eye, the main sense organs by which people receive 80% of their information about theenvironment, is among the central issues of modern medicine. Visual functions are integral fo most professional and everyday activities, and thus, out of all the senses, their decline or loss has the largest negative impact on the quality of life. Furthermore, DR is the third leading cause of visual impairment overall. Loss of vision due to diabetic retinopathy results from DMO, vitreous hemorrhage and fibrous tissue leading to retinal detachment.
In its earliest stages, DR usually has no symptoms. However, some retinal lesions indicate a risk of progression. Laser photocoagulation, vitreoctomies, intravitreal injections of corticosteroids and anti vascular endothelial growth factor (VEGF) drugs are the present standard
12
strategies used in the treatment of DR and DMO. However, intravitreal injections are invasive procedures and can have adverse effects like infection, glaucoma, retinal detachment and cataract formation. While anti-VEGF treatments have not proven wholly succeddful, this strategy encourages the development of alternative treatmentsfocusing the other factors that are altered in the vitreous fluid of DMO and PDR patients: increased proangiogenic factors [e.g. platelet-derived growth factor (PDGF), erythropoietin (EPO)] or decreased antiangiogenic factors [e.g. angiostatin (AS), pigment epithelium-derived factor (PEDF)] [8, 9]. The goal for the future is to better understand early pathophysiological changes that lead to visual loss in diabetic patients, and develop new, less-invasive pharmacological to maintain good vision. Above all, retinal neurodegeneration may be the most promising new target, and intensive research is needed to further elucidate the underlying mechanisms that lead to retinal degeneration and its relationship with microvasculature impairment.
Neurodegeneration in the diabetic retina
The retina is a complex structure with several layers of neurons interconnected by synapses (neuroretina) and a monolayer of pigmented cells called the retinal pigmented epithelium (RPE). The RPE is situated between the neuroretina and the choroids, which are essential for the functionality of the neuroretina [10]. The photoreceptors cells, rodes and cones, are the only neurons that are directly sensitive to lights. Their role is to facilitate the process of phototransduction, the translation of light information into neural signals. The somata of second-order neurons (bipolar and horizontal cells), the so-caled
13
amacrine celle, and the main glial element (Muller cells) constitute the inner nuclear layer. The innermost cellular layer contains the ganglion cells and amacrine cells and is termed the ganglion cell layer. Photoreceptors form synapses with bipolar and horizontal cell processes in the outer plexiform layer. The inner plexiform layer consist of the axon of bipolar cells and the dendrites of the amacrine and ganglion cells. The choroid and the retinal circulation provide oxygen and nutrients to the human retina and most mammals. Retinal neural tissue is protected by harmful molecules by the inner and outer BRB, which are respectively constituted by endothelial cells and RPE cells.
Figure 1 Schematic of the mammalian retina. a There are seven main cell
types in the mammalian retina: pigmented cells, rods, cones, horizontal cells, bipolar cells, amacrine cells and retinal ganglion cells. They have a laminar distribution Figure adapted from Livesey FJ and Cepko CL (2001) and Wässle H (2004).
14
The retinal pathway carrying processed visual information to the brain can be described as a chain of neurons and their synapses. Neural signals, from rodes and cones, undergo processing in the retina and action potentials are generated in retinal ganglion cells (RGCs), the axons of which form the optic nerve. These synapses use glutamate as their neurotransmitter, while the horizontal and amacrine cell modulate the cascade and use glycine and γ-aminobutyric acid (GABA) as their main transmitters [11-14].
For many decades, DR has been considered a microangiopathic disease of the retina with key clinical features: vascular leakage and pre-retinal neovascularization, resulting from breakdown of the blood retinal barrier (BRB) [15]. However, there is a mounting evidence to suggest that the pathogenesis of DR may also comprise neuroinflammatory and neuropathic processes which contribute to visual impairment [16]. Loss of neuroretinal adaptation to the diabetic metabolic environment and neural apoptosis may occur in DR prior to any clinically detectable microvasculopathy, in both human and animal models [17].
There are clear indications that retinal function, which depends on a complex integral network of multiple neuronal subtypes, is disturbed soon after the onset of diabetes, and that neurodegeneration is an ongoing component of DR.
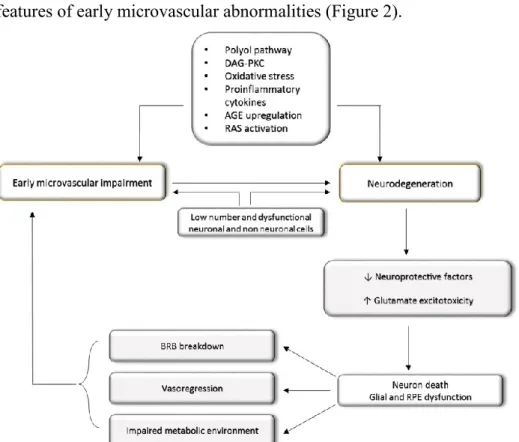
Several interconnected factors induce retinal neuronal degeneration. Among these, hyperglicaemia is considered the main culprit compromising neural and vascular function. The numerous metabolic pathways triggered by hyperglicaemia such as the polyol pathway, the hexosamine pathway, the DAG-PKC pathway, lead to extracellular glutamate accumulation, oxidative stress and reduction of neuroprotective factors synthesized by the retina [18]. All of these mediators are involved in pathways that lead to neuronal apoptosis and
15
glial dysfunction, hallmarks of retinal neurodegeneration, and to BRB breakdown and altered microvascular system, which are the main features of early microvascular abnormalities (Figure 2).
Figure 2. Diagram of the main mechanisms leading to diabetic retinopathy (DR). Figure adapted from Simò R and Hernàndez C (2014).
Furthermore, the major excitatory neurotransmitter in the retina, glutamate was found elevated in the extracellular space in experimental model of diabetes, as well as in the vitreous fluid of diabetic patients with PDR. This extracellular glutamate accumulation, known as excitotoxicity, is deleterious on retinal neurons [19].
Increased generation of reactive oxygen species (ROS) in the retina of patients with DR has also been described. Although the retina contains a robust pool of antioxidant molecules (GSH, Vitamin C and E) and endogenous enzymes (SOD, CAT and Glutathione peroxidase) able to
16
quench ROS and maintain normal cellular homeostasis, during diabetes an imbalance between pro-oxidants and anti-oxidants is evident and leads to oxidative stress. [20]. Oxidative stress has been associated with cellular inflammation and the release of important inflammatory cytokines [e.g. tumor necrosis factor-α (TNF- α), interleuikin-1β (IL-1β)] that can interact with transcription factor Nuclear factor-kappa β (NF-k β) able to initiate the transcription of many genes involved in apoptosis, like Caspase-3 in the retina [21].
All neuronal cell types in the retina seem to be susceptible to hyperglicemia-induced apoptosis. Over time, neurons in retinal layers lose their capacity to adapt to diabetic metabolic alterations of the environment and succumbs to cellular stress, as evidenced by reduced axonal and dendritic branching, apoptotic cell death, neural and vascular inflammation, cell loss and retinal layer thinning [9].
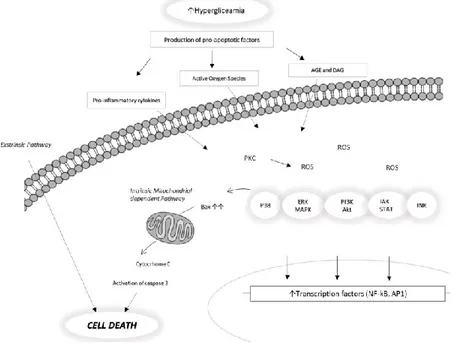
Apoptosis is a distinct form of cell death, regulated by genetic programs and characterized by morphological changes including cell shrinkage, plasma membrane blebbing and nuclear and cytoplasmic condensation, with apoptotic body formation. It consists of two distinct signalling pathways, the extrinsic and intrinsic one, both of which have a common final stage, the execution pathway- This final step is which is mediated by the activation of caspases. Caspases belong to the conserved cysteine protease family and catalyze the cleavage of their downstream targets at sites on the carboxyl side of aspartic acid residues. Fourteen caspases have been identified in mammals; they are classified into initiators and effectors. Among the effectors, Caspase-3 has been described as a pivotal molecular player in the execution-hase of apoptosis [22]. It has been demonstrated that, an imbalance between proapoptotic and survival signalling exists in the neuroretina of diabetic patients in the early stages of DR. Increased numbers of apoptotic neurons and
up-17
regulated expression of caspases-3, Bax and p53 have been identified in STZ rat retinas and in post mortem human diabetic retinas when compared to controls [23]. The proposed apoptotic pathway in DR is summarized in Fig. 3.
Retinal ganglion cells (RGCs), located in the inner retina are the first apoptotic cells detected in DR. Among all the retinal neuronal cell types, RGCs seem to be the most susceptible to hyperglyceamic stimulation and the most sensitive to cellular damage and neurotoxicity [24]. This results, in a reduced thickness of the retinal nerve fiber layer, and has been detected in STZ-induced diabetes animal models, and diabetic patients without DR [25, 26]. BRB disruption is another core element of retinal dysfuntion in DR patients. It involves both structural and functional changes to the barrier. The tight junction of RPE cells are an important component of the outer BRB, and can be distrupted by inflammatory and oxidative changes associated with hyperglycaemia.
Figure 3. Proposed apoptotic pathway in diabetic retinopathy. Figure adapted from Zhang X et al., (2013).
18
Neuropeptides and diabetic retinopathy
The presence of neuropeptides in the human retina has mostly been studied through immunohistochemical and chromatographic assays. Around 20 neuropeptides have been identified in the human retina (Table 1). Neuropeptides are produced from both neural and non-neural cells, and some peptides are produced by extra-retinal cell sources. In particular, among retinal nerve cells, amacrine cells are the only cells able to release their products within the retina, because ganglion cells, send their axons towards the brain [27]. It has become clear that the neuropeptides described in the retina can be divided into two categories: peptides that promote the development of DR symptoms, and others that are able to prevent, delay or eliminate them. Disturbed retinal balance between these neurotoxic and neuroprotective factors is crucial in accounting for neuronal cell death in the diabetic retina. Downregulation of neuroprotective factors may compromise natural neuroprotection against neurotoxic executors involved in neurodegeneration [28].
A, amacrine cell; dA, displaced amacrine cell; G, ganglion cell; U, unidentified cell type; +, present; ++, present in high quantity; unknown, not certified. Table adapted from Gabriel R., (2013).
19
Pituitary adenylyl cyclase-activating polypeptide (PACAP) and vasoactive intestinal polypeptide (VIP), two similar neuropeptides that belong to the secretine, glucagon and peptide histidine-isoleucine (PHI) superfamily, are widely present in the retina. The sequences of VIP and the PACAP peptides are highly conserved across species. Two PACAP isoforms have been identified, a 38 amino acid form (PACAP38) and a C-terminally truncated 27 amino acid form (PACAP27). Analysis of retinal tissue, by electron and light microscopy, reveals the presence of PACAP and VIP, as well as their respective receptors. In particular, PACAP immunopositivity was observed in amacrine, horizontal and ganglion cells while VIP immunopositivity was observed in amacrine and displaced amacrine cells. Ultrastructural studies show that PACAP immunoreactivity is visible near the plasma membrane, in the rough endoplasmic reticulum, and the cytoplasmic matrix [29-31]. The receptors for PACAP and VIP are G protein-coupled receptors, and can be classified into two main groups PAC1, which binds PACAP with high affinity and VPAC, which bind both peptides with high affinity (includingVPAC1 and VPAC2 subtypes). Through adenylate cyclase (AC) activation, they elevate cyclic 3,5-adenosine monophosphate (cAMP), and activates protein kinase A (PKA), which can activate the mitogen activated protein kinase (MAPK) pathway [32]. PAC1 receptor binding can stimulate various downstream executors of PKA and and protein kinase C (PKC), ion channels and β-arrestin. These, and other pathways regulated by PAC1 receptors are different in distinct cell types depending on the expressed splice variant, the peptides concentration and other factors present in the cells. VPAC receptors couple to Gs proteins resulting in activation of AC; other signaling pathways downstream of cAMP or independent of cAMP are
20
associated with VPAC receptor activation depending on the tissues in which they are expressed [33-36].
One of the many functions of PACAP and VIP is their strong cytoprotective role, promoting survival in many type of neuronal and non-neuronal cell and tissue, including lymphocytes and endothelial cell; in the liver, lungs and ovaries [37, 38]. Both peptides influences apoptotic signalling at various levels, from initiation to downstream cytosolic and mitochondrial pathways and finally affecting executor caspases [39, 40]. Findings demonstrated that neuroprotection by subpicomolar levels of PACAP38 involves ERK type MAPK, whereas neuroprotection by nanomolar levels PACAP38 is mediated by the activation of cAMP [41].
Furthermore PACAP and VIP neuroprotective actions are mediated by two different glial derived proteins: activity-dependent neurotrophic factor (ADNF) [42], and activity-dependent neuroprotective protein (ADNP) [43, 44]. Davunetide (AL-108, NAP) is the acetate salt of an eight aminoacid peptide (NAPVSIPQ) derived from ADNP, a growth factor released from glia in response to exposure to VIP and PACAP. In cell cultures, femtomolar concentrations of davunetide have potent neuroprotective effects on cell death and microtubule disruption from a variety of toxic insults [45-49]. NAP has been shown to be involved in microtubule re-organization and in transient increases of non-phosphorylated tau levels [46]. It has also been demonstrated to promotes neuronal growth and differentiation, and its protective actions are mediated by the activation of MAPK/ERK and PI-3K/AKT [50]. The role of the above peptides has been investigated in various models of retinal injuries. Previous studies have shown that PACAP and VIP protect the retina from excitotoxic, ischemic, and UV-A-induced retinal degeneration [51-53]. Changes in the retinal expression of PACAP/VIP
21
and their receptors have been reported during the earliest phases of STZ-induced diabetes [54]. Furthermore PACAP treatment could protect the retina against the harmful effects of diabetes, especially through its well-known caspase-inhibiting effect [55]. However, whether these peptides are also involved in maintenance of outer BRB function during DR remains to be clarified. NAP protects retinal ganglion cells against damage induced by retinal ischemia and optic nerve crush [56], it prevents hypoxia-induced injuries to rat retinal Muller cells, and promotes retinal neuronals growth [57]. Although it prevents some diabetes-related brain pathologies in the STZ injected rat model [58], to date there are not evidences in literature regarding the effect of NAP in DR.
Models for testing Neuroprotective drugs
There are several different species of animal models used to study DR from tiny zebrafish to monkeys. Different rodent models of DR have been used for the investigation of the mechanisms of retinal damage and preclinical drug screening. The advantage of using rodent models is the similarity of their genetic background to humans. Currently, the most used model to study early neurodegeneration in the diabetic retina is a rat receiving intraperitoneal injections of streptozotocin (STZ). Rats have been used more often than mice as an experimental model of DR and retinal degeneration because rats are less resistant to the STZ effect and they have higher eyecups and a higher degree lesion of lesions compared to mice (mice need from 3-5 doses of STZ to induce diabetes compare to rats where one dose is sufficient) [59]. STZ, a toxic glucose analogue compound, derived from Streptomyces achromogenes
22
is used clinically as a chemotherapeutic agent in the treatment of pancreatic β cell carcinoma. STZ has been used in both type 1 and type 2 diabetes animal models. STZ damages pancreatic β cells, accumulating in them via the GLUT2 glucose transporter, resulting in hypoinsulinemia and hyperglycemia, and greatly affecting the β-cell mass. Similarly, a variation for β-cell mass in both type 1 and type 2 diabetes exists in humans [60-62].
Although the above method is often used to make a diabetes model, pathological neovascularization caused hyperglicaemia, which is a typical finding in severe diabetic patients, does not appear in these animals. However, since neurodegeneration is an early event in the pathogenesis of DR, it is not necessary to use animal models, with subsequent microangiopathic complications, to test the efficacy of neuroprotective factors [63, 64]. Furthermore, STZ-induced diabetes model shows apoptosis of the inner retinal neurons, such as ganglion cells and amacrine cells, and the activation of the Müller glial cells in the retina [10, 11].
In addition, many models have been generated in vitro mimicking the diabetic metabolic environment using human or nonhuman tissues [65]. The in vitro culture systems allow easier manipulation of the retina and a immediate variation of the experimental conditions.
23
AIMS
Chapter I To characterize the in vivo model of DR used in this work,
focusing on the inflammatory process. We study the effect of hyperglicaemia on the IL-1 family elements expression and distribution in retinal layers of STZ-induced diabetic rats.
Chapter II To investigate the possible ameliorative effect of NAP in
streptozotocin-induced diabetic retinopathy and to evaluate its anti-apoptotic effect in this model of early retinal neurodegeneration. NAP has been shown to have protective effects against different retinal injuries, but its role has not been investigated in DR.
Chapter II To provide evidence that PACAP and VIP are also outer BRB
protective peptides. A large body of evidence establishes the retinoprotective effects of both peptides. However, little is known about the relationship between them and one of the most common DR complications: the disruption of the outer BRB. In this study, an in vitro model of outer BRB was used.
25
26
submitted
Different retinal expression patterns of IL-1 α, IL-1 β, and
their receptors in a rat model of type 1 STZ-induced diabetes
Soraya Scuderi1, Agata Grazia D’amico1, Concetta Federico2, SalvatoreSaccone2, Gaetano Magro4, Claudio Bucolo3, Filippo Drago3, and Velia
D’Agata1*
1 Department of Bio-Medical Sciences, Section of Anatomy and Histology,
University of Catania,
2 Department of Biological, Geological and Environmental Sciences, Section
of Animal Biology, University of Catania
3 Department of Clinical and Molecular Biomedicine, Section of
Pharmacology and Biochemistry, University of Catania
4 G.F. Ingrassia Department, Section of Anatomic Pathology, University of
Catania
Abstract
Diabetic retinopathy (DR), a common complication of diabetes, remains a major cause of blindness among working-age population. Considerable amounts of evidences suggest that DR resembles an inflammatory disease. Increased levels of pro-inflammatory cytokines, including interleukin-1β (IL-1 β), were found in the vitreous of diabetic patients and in the retina of diabetic rats. However, in this context, no attention has been given to the other main IL-1 family members: IL-1α, two transmembrane receptors IL-1RI and IL-1RII, and the natural antagonist receptor IL-1Ra. Despite they actively participate in the IL-1 mediated-inflammation process, their role in DR has not been described. Thus, we investigated by western blot and confocal laser scanning microscopy analysis the effect of hyperglycaemia on the IL-1
27
molecules regulation in retinal layers, using an in vivo model of type 1 diabetes. Diabetes was induced in adult rats by intraperitoneal injection of streptozotocin (STZ). Exposure to hyperglycaemia causes changes in the expression and distribution levels of all IL-1 family members studied. It induces a significantly increase in the proteins expression of IL-1β, IL-1RI, IL-RII and IL-1Ra but not of IL-1α. Moreover, high glucose alters their distribution pattern in the rat retina. The compromised layers, with an upset IL-1 inflammatory scenario, are the photoreceptor, the inner plexiform and ganglion cell layers. These findings point to all of these IL-1 molecules, as key elements in the pro-inflammatory cascade triggers by hyperglycaemia in the early phase of DR.
Keywords: interleukin-1α; interleukin-1β; , IL-1 Receptor I; IL- Receptor II; IL-1 Receptor antagonist; diabetic retinopathy; streptozotocin
28
1. Introduction
Diabetic retinopathy (DR) is a major cause of visual impairment and acquired blindness among patients with type 1 and type 2 diabetes [66, 67]. DR has mainly been considered as a microvascular disease, caused by a range of hyperglycemia-linked pathways [68] and characterized by basement membrane thickening of retinal vessels, loss of pericytes and endothelial cells, blood-retinal barrier breakdown (BRB) [69, 70]. However, there are emerging evidences to suggest that neurodegenerative processes may occur prior any detectable microvascular alterations of the retina. All neuronal cell types are susceptible to hyperglicaemia-induced biochemical alterations that lead to oxidative stress, apoptosis and inflammation [54, 71]. Inflammation has been recognized as a trigger element in the early and late stages of DR [72, 73]. In fact, varieties of physiological and molecular abnormalities, consistent with inflammation, have been found in the retinas or vitreous humor of diabetic animals and patients. These include macroglial and microglial activation, leukostasis, increased vascular permeability, acute phase proteins, vasoactive peptides [74-76] and increased levels of inflammatory cytokines, such as Interleukin-1beta (IL-1β) and tumor necrosis factor-α (TNF-α) [77-80].
Interesting reports on the correlation of dysfunctional IL-1β signalling with incident of many pathologies, including DR [21, 75, 81], have diverted our attention to reveal whether the other members of this family play a role during early phase of diabetes.
The 1 family includes seven ligands with agonist activity (1α and IL-1β, IL-18, IL-33, IL-36α, IL-36β, IL-36γ), three receptor antagonists (IL-1Ra, IL-36Ra, IL-38), and an anti-inflammatory cytokine (IL-37). Members of the IL-1 Receptor (IL-1R) family include six receptor chains forming four
29
signaling receptor complexes, two decoy receptors (IL-1R2, IL-18BP), and two negative regulators (TIR8 or SIGIRR, IL-1RAcPb) [82]. The best studied are IL-1α and IL-1β, both pro-inflammatory cytokines, and the endogenous receptor antagonist IL-1Ra [83].
All IL-1 ligands are produced as pro-peptides, and while IL-1β requires proteolytic cleavage for its activity, IL-1α possesses limited activity prior to processing [84]. The IL-1Ra is released by the cell, as an active molecule of 25 KDa without a requirement for processing. Once released and cleaved, IL-1 ligands elicit a multitude of effects on target cells, binding to two different types of transmembrane receptors (IL-1R type I and IL-1R type II) [85] that lead to tissue damage [86]. IL-1RII is a decoy receptor, which lacks the cytoplasmatic domain and cannot signal, but binds to IL-1RI and thus limits its biological availability. IL-1Ra competes with IL-1 for the binding to IL-1 receptor, but unlike IL-1, this binding does not induce any signal transduction [87].
In the present work, we used an in vivo model of streptozotocin-induced diabetes type I and by immunohistochemistry and Western blotting analysis, three weeks after the onset of hyperglicaemia, we investigated the expression patterns of IL-1α, IL-1β, IL-receptor antagonist and their receptors (IL-1RI e IL-1RII) both in nondiabetic and diabetic rat retina.
2. Materials and Methods
2.1 Rats
Male Sprague–Dawley rats, three months old, weighing approximately 200 g each, obtained from Charles River (Calco, Italy) were used for the present study. All the animals were treated according to the Association
30
for Research in Vision and Ophthalmology (ARVO) Statement for the Use of Animals in Ophthalmic and Vision Research. The animals were fed with standard laboratory chow and were allowed free access to water in an air–conditioned room with a 12 h light / 12 h dark cycle. Final group sizes for all measurements were n = 6–9.
2.2 Induction of Diabetes
Diabetes was induced with a single intraperitoneal injection of streptozotocin (STZ) (Sigma – Aldrich, St. Louis, MO, USA) as previously described [78]. Briefly, after twelve hours of fasting, a group of animals received a single injection of STZ (60 mg/kg body weight) in 10 mM sodium citrate buffer, pH 4.5 (1 mL/kg dosevolume). Nondiabetic animals were fasted and received citrate buffer alone. Twenty four hours post STZ injection blood glucose levels was measured and rats showing blood glucose levels greater than 250 mg/dL were considered as diabetic [88] and selected for the study. We monitored throughout the study the diabetic state by evaluating glycemia daily using a blood glucose meter (Accu–CheckActive; Roche Diagnostic, Milan, Italy) and by the weight loss. All experiments were performed three weeks after the induction of diabetes. For subsequent experiments, rats were killed with a lethal i.p. dose of sodium pentobarbital. Retinas were immediately removed and homogenized in ice cold buffer for Western blot analysis and others were fixed in 4% paraformaldehyde for histological and immunohistochemical analysis.
2.3 Measurement of Blood Retinal Barrier Breakdown
In a separate set of animals the Blood Retinal Barrier breakdown was measured using Evans blue dye (Sigma-Aldrich, St. Louis, MO) three weeks post STZ injection as previously reported [89]. Rats were killed and
31
the retinas were carefully dissected and thoroughly dried in a concentration/drying system (SpeedVac; Thermo Fisher Scientific, Milan, Italy). The dry weight was used to normalize the quantitation of Evans blue leakage. Evans blue was extracted from each retina and the samples used for spectrophotometric measurements. The background-subtracted absorbance was determined by measuring each sample at 620 nm (the maximum absorbance for Evans blue in formamide) and 740 nm (the minimum absorbance). The concentration of dye in the extracts was calculated from a standard curve of Evans blue in formamide. BRB breakdown was calculated using the following equation, with results being expressed in µL plasma × g retina dry weight-1 × h-1.
We expressed results as percentage of control.
2.4 Western blot analysis
Western blot analysis was performed to determine the relative levels of the Interleukin-1 family ligands and receptors using specific antibodies. Analysis was performed as previously described by D’Amico et al. (2013b). Briefly, proteins were extracted with buffer containing 20 mM Tris (pH 7.4), 2 mM EDTA, 0.5 mM EGTA; 50 mM mercaptoethanol, 0.32 mM sucrose and a protease inhibitor cocktail (Roche Diagnostics) using a Teflon-glass homogenizer and then sonicated twice for 20 sec using an ultrasonic probe, followed by centrifugation at 10.000 g for 10 min at 4 °C. The Quant-iT Protein Assay Kit (Invitrogen) determined protein concentrations. Sample
32
proteins (30 μg) were diluted in 2X Laemmli buffer (Invitrogen, Carlsbad, CA, USA), heated at 70°C for 10 min and then separated on a Biorad Criterion XT 4-15% Bis-tris gel (BIO-RAD) by electrophoresis and then transferred to a nitrocellulose membrane (BIO-RAD). Blots were blocked using the Odyssey Blocking Buffer (LI-COR Biosciences) and probed with appropriate antibodies: rabbit anti-β-tubulin (sc-9104, Santa Cruz Biotechnology; 1:500), rabbit anti-IL-1α (sc-7929, Santa Cruz Biotechnology; 1:200); goat anti-IL-1 β (sc-1250, Santa Cruz Biotechnology; 1:200), rabbit anti-IL-1RI ( sc-688, Santa Cruz Biotechnology; 1:200), rabbit anti- IL-1RII ( sc-292522, Santa Cruz Biotechnology; 1:200), mouse anti-IL-Ra (sc-376094, Santa Cruz Biotechnology; 1:200). The secondary antibody goat anti-rabbit IRDye 800CW (#926-32211; LI-COR Biosciences), donkey anti-goat IRDye 800CW (#926-32214 LI-COR), goat anti-mouse IRDye 680CW, (#926-68020D; LI-COR Biosciences) were used at 1:20000. Blots were scanned using an Odyssey Infrared Imaging System (Odyssey). Densitometric analysis of Western blot signals was performed at non-saturating exposures and analyzed using the ImageJ software (NIH, Bethesda, MD; available at http://rsb.info.nih.gov/ij/index.html).
2.5 Immunolocalization
Eyes were enucleated and fixed overnight with 4% paraformaldehyde in 0.1 M sodium phosphate (pH 7.6). Analysis was performed as previously described by [54]. Before immunofluorescence staining, paraffin-embedded retinas sections (14µm) mounted on glass slides, were dewaxed in xylene and rehydrated through graded alcohols. Sections were put into Rodent Decloaker 1X retrieval solution (RD913, BIO-CARE MEDICAL) in a slide container and then incubated with the anti IL-1 β, IL-1α, IL-1R type I and II, IL-1Ra primary antibodies. Tissue sections were then incubated with Alexa fluor 488 goat anti-rabbit and Alexa fluor 488 donkey anti-goat secondary antibodies,
33
respectively for 1.5 h at room temperature and shielded from light. DAPI (diamidino-2-phenylindole) was used to stain nuclei (#940110 Vector Laboratories). Images of the central retina were taken with a confocal laser scanning microscope (CLSM) (Zeiss LSM700 with a x20, x40, and x63 objectives, as previously described [90] and analysed using the ZEN 2011 software. Experiments were repeated at least three times to confirm results.
2.6 Statistical analysis
Statistical analyses were performed using specific software GraphPad Prism-5. Paired t tests were used to determine whether differences were significant. The level of significance for all statistical tests was p≤ 0.05
34
3. Results
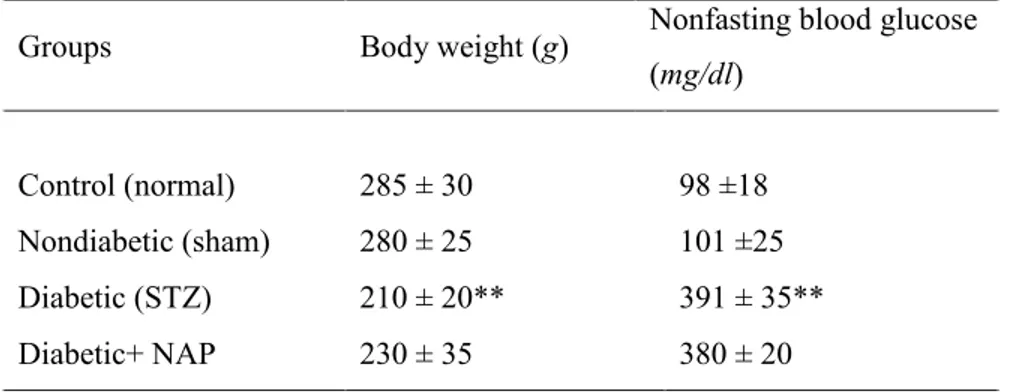
3.1 Changes in the body weight and blood glucose levels after 3 weeks of STZ administration
Table 1 shows the effects of STZ treatment on body weight and non-fasting blood glucose levels in rats after 3 weeks. Body weight and glycemia of rats before treatments were approximately 200g and 100mg/dL respectively. The statistical analysis revealed a significant decrease in body weight 3 weeks after STZ injection (p<0.01 vs. nondiabetic control group). Three weeks after onset of diabetes, blood glucose values in diabetic rats were significantly (p<0.01) higher than corresponding values in non diabetic rats (391 ± 35 and 98 ±18 mg/dL respectively).
Groups Body weight (g) Non fasting blood glucose (mg/dl)
___________________________________________________________________________
Control 270 ± 27 98 ± 18
Diabetic 205 ±20* 391 ± 35*
__________________________________________________________________________ Data are expressed as mean ± SD.
*p<0.01 vs. control.
Table 1. Effects of STZ-induced diabetes on body weight and blood glucose levels after 3 weeks. Control (non-diabetic) group represents normal rats injected with the vehicle used to dissolve STZ. Diabetes was induced by 60 mg/kg STZ injection.
3.2 Blood Retinal Barrier Breakdown
Increased BRB permeability is an early event in rats with hyperglycemia. Evans Blue permeability was measured 3 weeks after STZ-diabetes induction.
35
Figure 1 shows that Evans blue leakage from retinas of diabetic rats was 2-fold higher than that from non diabetic rats (p< 0.01).
Figure 1 BRB breakdown The Evans Blue leakage increases 2-fold in diabetic rats compared to nondiabetic (*p<0.01), 3 weeks after STZ hyperglycemia induction.
3.3 Effects of STZ–induced diabetes on IL-1 family member protein expression
The expression of IL-1 family members was examined by western blot analysis. Figure 2 showed that IL-1 receptor type I and IL-1β levels were significantly increased in diabetic rats retina, compared with nondiabetic (***p<0.001). STZ administration resulted also in a small but significant induction of the IL-1 receptor type II and of the receptor antagonist IL-Ra (respectively *p<0.05 and **p<0.01 vs. retina from nondiabetic rats) but no effect was observed on IL-1α expression (Figure 2 A, B).
36
Figure 2 - Hyperglycemia increases the proinflammatory IL-1 signalling, in rat retina. Rats were injected with STZ (60mg/kg, i.p.) and levels of Interleukin-1 alpha (IL-1α), Interleukin-1beta (IL-1β), Interleukin-1 receptor antagonist (IL-1Ra), Interleukin receptor type I (IL1-RI) and type II (IL1-RII) were determined by Western blot analysis. Levels of total IL-1α, IL-1β, IL-1Ra, IL1-RI and IL1-RII were determined to control (β-tubulin) for loading differences. (A) Representative Western blot images for each protein are shown. (B) Results were quantified and are the mean ± SEM, percent of control (n = 6 animals; *p <0.05, **p<0.01 and ***p<0.001 compared with control, Student t test).
3.4 Regional distribution of IL-1 family members
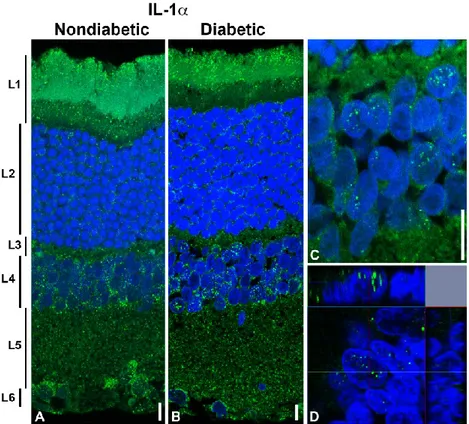
The distribution of the IL-1α, IL-1β, IL-1Ra, IL-1RI, and IL-1RII was detected, using specific antibodies, in the retina of rats after three weeks of STZ injection. The IL-1α is widely distributed in the retina (Figure 3). IL-1α immunoreactivity was mostly found in the photoreceptor layer (layer 1), inner nuclear layer (layer 4), inner plexiform layer (layer 5) and ganglion cell layer (layer 6) but differences are not appreciable between groups, nondiabetic and diabetic retina (Figure 3 A, and B). In a more detail, in the case of the photoreceptor layer, IL-1α is located in the more peripheral part of the outer cone/rod segments. Moreover, in the case of the inner nuclear layer, the fluorescent signals were also observed inside the nuclei of the some cells (Fig. 3 C, and D).
37
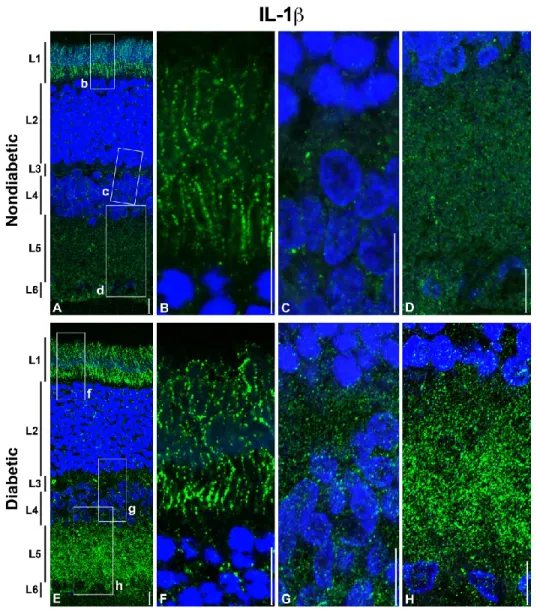
The IL-1β expression and the distribution in retinal layers is different in the nondiabetic respect to the diabetic retina (Figure 4). In the nondiabetic retina, IL-1β is prevalently located in the photoreceptor layer (layer 1), and in a lesser extent in the inner plexiform and in the ganglion cell layers (layer 5 and 6, respectively). In the diabetic retina, the fluorescent signals for IL-1β increased in all layers except in the outer nuclear layer (Fig. 4, A and E). The hybridization signals observed in the photoreceptor layer (layer 1) are present in both inner and outer segments of the cone/rods, and the location seems to be along the cytoplasmic membrane (see Figure 4 B, and F).
IL-1Ra was observed only in the photoreceptor (layer 1) and in the outer plexiform (layer 5) layers, but an increased expression was detected in diabetic retina respect to the non diabetic one (Fig. 5 A, and E). In a more detail, in the plexiform layer (layer 5) we observed IL-1Ra immunoreactivity in the proximal area of the outer nuclear layer (see Fig. 5 G).
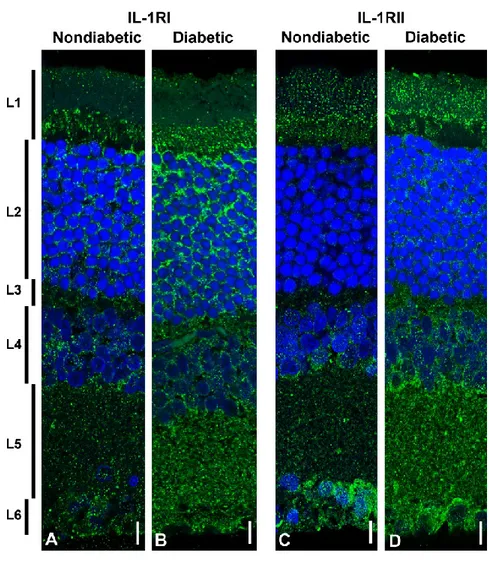
A different expression pattern is evident for the IL-1RI (Figure 6A, and B) and IL-1RII (Figure 6C, and D) in nondiabetic retina. IL-1RI (Figure 6A) is distributed in all retinal layers, being almost absent in the outer segment of the photoreceptor layer (layer 1). Instead, IL-1RII is particularly evident in the entire photoreceptor layer (layer 1), in the ganglion cell layer (layer 6), and in the region of the plexiform layer (layer 5) close to the inner nuclear layer (layer 4). The hyperglycemic condition induced by STZ, determines an overall expression of both IL-1RI, and IL-1RII in all the retina layers (Figure 6B, and 6D), with a larger amount of the former respect to the second (see also figure 2A). In the case of IL-1RI, the increase is very evident in the outer nuclear layer (layer 2) on the contrary to that observed for IL-1RII whose increment in the outer nuclear layer (layer 2) is lesser massive than IL-1RI (Figure 6B, and 6D).
38
Figure 3 - Distribution of IL-1 α in the normal and diabetic rat retina
Representative images showing distribution of IL-1α in retinal layers of control (A), diabetic rats (B). Retinal distribution of IL-1α was detected using a rabbit anti-IL-1α primary antibody revealed with Alexafluor488 goat anti rabbit (green fluorescence). Cell nuclei were stained with DAPI (blue fluorescence). Images shown are representative results taken from different fields from randomly selected slides and scanned by CLSM. Retinal layers are indicated, on the left part of the figure, as follows: L1: photoreceptors outer and inner segment; L2: outer nuclear layer; L3: outer plexiform layer; L4: inner nuclear layer; L5: inner plexiform layer; L6: ganglion cell layer. C, and D: cells from the inner nuclear layer (diabetic retina) where fluorescence signals are visible in some nuclei. Orthogonal vision of cells from the same layer is shown in panel D. Scale bars: 10 μm.
39
Figure 4 - Distribution of IL-1β in the normal and diabetic rat retina
Representative images showing distribution of IL-1β in the retinal layers of control rats (A, B, C, and D), and diabetic rats (E, F, G, and H). IL-1β was detected using a rabbit anti- IL-1 β primary antibody revealed with Alexafluor488 mouse anti goat (green fluorescence). Cell nuclei were stained with DAPI (blue fluorescence). Images shown are representative results taken from different fields from randomly selected slides and scanned by CLSM. Retinal layers are indicated, on the left of the figure, as follows: L1: photoreceptors outer and inner segment; L2: outer nuclear layer; L3: outer plexiform layer; L4: inner nuclear layer; L5: inner plexiform layer; L6: ganglion cell layer. B, C, and D show the enlarged sectors indicated in the panel A. F, G, and H show the enlarged sectors indicated in the panel E. Scale bars: 10μm.
40
Figure 5 - Distribution of IL-1Ra in the normal and diabetic rat retina
Representative images showing distribution of IL-Ra in the retinal layers of control rats (A, B, C, and D), and diabetic rats (E, F, G, and H). IL-Ra was detected using a rabbit anti- IL-1 β primary antibody revealed with Alexafluor488 mouse anti goat (green fluorescence). Cell nuclei were stained with DAPI (blue fluorescence). Images shown are representative results taken from different fields from randomly selected slides and scanned by CLSM. Retinal layers are indicated, on the left of the figure, as follows: L1: photoreceptors outer and inner segment; L2: outer nuclear layer; L3: outer plexiform layer; L4: inner nuclear layer; L5: inner plexiform layer; L6: ganglion cell layer. B, C, and D show the enlarged sectors indicated in the panel A. F, G, and H show the enlarged sectors indicated in the panel E. Scale bars: 10μm.
41
Figure 6 - Distribution of IL-1RI and IL-1RII in the normal and diabetic rat retina
Representative images showing the distribution of IL-1RI (A, and B), and IL-1RII (C, and D), in the retinal layers of control rats (A, and C) and diabetic rats (B, and D) after three weeks of hyperglycaemia. Retinal distribution of IL-1RI and IL-1RII was detected using a rabbit anti- IL-1 RI and anti- IL-1 RII primary antibody revealed with Alexa fluor 488 goat anti rabbit (green fluorescence). Cell nuclei were stained with DAPI (blue fluorescence). Images shown are representative results taken from different fields from randomly selected slides and scanned by CLSM. Retinal layers are indicated, on the left of the figure, as follows: L1: photoreceptors outer and inner segment; L2: outer nuclear layer; L3: outer plexiform layer; L4: inner nuclear layer; L5: inner plexiform layer; L6: ganglion cell layer. Scale bars: 10μm.
42
4. Discussion
A conceivable contribution of inflammation to the pathogenesis of DR developed out when diabetic patients treated with salicylates for rheumatoid arthritis had a lower-than-expected incidence of DR [91]. Since then, varieties of physiological and molecular abnormalities that, are consistent with inflammation, have been found altered in the retinas or in the vitreous humor of diabetic animals and patients (Yuuki, et al., 2001). Hyperglycaemia has recognized as the main committer of both neural and vascular inflammation in DR. Thus, during hyperglycemic conditions excessive oxidative stress and reduce neutralizing mechanisms lead to generation of important inflammatory molecules. Increased proinflammatory cytokines, such as interferon-gamma (IFNγ), tumor necrosis factor-alpha (TNFα) and interleukin-1-β (IL-1β) have been found in DR and other ocular diseases [79, 91, 92]. Although IL-1β has been well described in literature, as a mediator of early retinal damage in DR [21, 75, 81], in this context, no attention has been given to the other IL-1 family members, whom all together, participate and modulate the inflammatory cascade. In the present study, we show that hyperglycaemia affects most of the IL-1 molecules analyzed, and we point out their importance, in the inflammatory scene of DR. Diabetic retinas showed a significant increased levels of IL-β and IL-1RI (p<0.001) and in lesser extent of IL-Ra and IL-1RII (p<0.01 and p<0.05 respectively) compared to nondiabetic ones (Figure 1). IL-1β results are consistent with previous data, that have also demonstrated that once released, IL-β triggers other inflammatory mediators and lead to tissue damage [86]. Notable, IL-1β is able to induce its own synthesis via autocrine/paracrine auto stimulation, acting as an amplifier of inflammation [93]. The observed up regulation of IL-1RI, essential IL-1β transduction element, apparently seems to be in contrast with a previous work [94] in which the authors described a decrease
43
of IL-1RI under diabetic conditions as well as its nuclear translocation. However, it is important to consider the experimental model used, an in vitro model of retinal endothelial cells, a condition reasonable more different if compared to the whole scenario of the retina, analyzed here.
Hyperglycaemia alters also the expression of the other 1 antagonist, IL-1Ra and IL-1RII. Since its discovery, IL-IL-1Ra was considered the major natural inhibitor of IL-1 action and an important in vivo regulator of IL-1 action [82]. Furthermore, it has been demonstrated that IL-1Ra protects retinal endothelial cells against the degeneration induced by nitric oxidative stress and cell death induce by glucose [21]. However, our results demonstrate that, its expression even if follow the trend of the other inflammatory trigger elements, seems to be not sufficient to counteract their overwhelming effects. This is supported also, by our earlier works in which, soon after establishment of diabetes, we demonstrated that features of retinal neurodegeneration (e.g. apoptosis) are already present together with impaired signalling survival pathways and overexpression of activated caspase 3 and p53 [54, 95]. As expected, apoptotic retinal cell death resulting from the inflammatory cascade, causes a reduction in the thickness of various layers i.e. ganglion cell layer, inner and outer nuclear layer. This observation were made both in animal models of DR and clinically [96, 97]. Similarly, we found decreased thickness of retina especially in the ganglion cell layer of diabetic retina (Fig 3).
This is the first detailed immunohystochemical study on the distributions of 1 family members in the retina. All receptors examined (1RI and IL-1RII) are present in the retina and show partially overlapping distribution, between retinal layers. IL-1RI is almost absent in the outer segment of the photoreceptor layer where instead IL-1RII is particularly abundant. IL-1α is widely distributed in the retina, especially in the photoreceptor layer, inner
44
nuclear layer, inner plexiform layer and ganglion cell layer, while IL-1β is prevalently located in the photoreceptor layer, and in a lesser extent in the inner plexiform and in the ganglion cell layers.
The hyperglycemic condition determines not only changes at protein expression levels, but also affect the regional distribution of these inflammatory elements. In fact, in the diabetic retina, IL-1RI become detectable in the outer nuclear layer, and this change is concomitant with the increased expression of IL-1β in the same retinal layer. This highlights the hyper-activation of an important inflammatory pathway, in an anatomical region strictly connected with the BRB, seriously compromised during DR. Moreover, nuclear retention of IL-1α was observed in the inner nuclear layer of the diabetic retina. The finding that IL-1α can be immobilized in nuclear was previously demonstrated [98], and the same authors proposed it as a mechanism for attenuating inflammation caused by the death of IL-1α-expressing cells.
Taken together, these findings indicate that all of these IL-1 molecules may play distinct roles in the context of retinal damage and homeostasis during DR. The inflammatory scenario is clearly compromised by hyperglycaemia even though are present mechanisms that attempt to negatively regulate the inflammatory response in DR.
Our studies offer a new rational approach to develop new IL-1β receptor antagonists (already being tested for other inflammatory and immune disorders) capable to cross the blood retinal barrier and inhibit the development of inflammatory process of DR in each specific retinal layers.
45
Intensive and systemic glycemic control remains the most effective therapy for DR. However, localized treatment of the retina is required for vision threatening retinopathy and certainly, the IL-1 signaling system is an attractive therapeutic target that might be implemented.
6. Acknowledgements
Dr. Soraya Scuderi was supported by the International PhD Program in Neuropharmacology, Medical School, University of Catania, Catania, Italy. The study was supported by Ministry of University and Research (MIUR), grant PRIN 2009BM7LJC_005 and grant PON 01-00110. These experiments were also accomplished using equipments provided in by the City Hall of Catania (ICT-E1 project).
7. References
1. Hoerger, T.J., Segel, J.E., Gregg, E.W., Saaddine, J.B., 2008. Is glycemic control improving in U.S. adults?, Diabetes care 31, 81-86.
2. Saydah, S.H., Fradkin, J., Cowie, C.C., 2004. Poor control of risk factors for vascular disease among adults with previously diagnosed diabetes, JAMA : the journal of the American Medical Association 291, 335-342. 3. Safi, S.Z., Qvist, R., Kumar, S., Batumalaie, K., Ismail, I.S., 2014.
Molecular mechanisms of diabetic retinopathy, general preventive strategies, and novel therapeutic targets, BioMed research international 2014, 801269.
4. Cunha-Vaz, J.G., 2004. The blood-retinal barriers system. Basic concepts and clinical evaluation, Experimental eye research 78, 715-721.
5. Scuderi, S., D'Amico, A.G., Castorina, A., Imbesi, R., Carnazza, M.L., D'Agata, V., 2013. Ameliorative effect of PACAP and VIP against increased permeability in a model of outer blood retinal barrier dysfunction, Peptides 39, 119-124.
6. Giunta, S., Castorina, A., Bucolo, C., Magro, G., Drago, F., D'Agata, V., 2012. Early changes in pituitary adenylate cyclase-activating peptide, vasoactive intestinal peptide and related receptors expression in retina of streptozotocin-induced diabetic rats, Peptides 37, 32-39.
46
7. Lieth, E., Gardner, T.W., Barber, A.J., Antonetti, D.A., Penn State Retina Research, G., 2000. Retinal neurodegeneration: early pathology in diabetes, Clinical & experimental ophthalmology 28, 3-8.
8. Kern, T.S., 2007. Contributions of inflammatory processes to the development of the early stages of diabetic retinopathy, Experimental diabetes research 2007, 95103.
9. Feenstra, D.J., Yego, E.C., Mohr, S., 2013. Modes of Retinal Cell Death in Diabetic Retinopathy, Journal of clinical & experimental ophthalmology 4, 298.
10. Chakrabarti, S., Cukiernik, M., Hileeto, D., Evans, T., Chen, S., 2000. Role of vasoactive factors in the pathogenesis of early changes in diabetic retinopathy, Diabetes/metabolism research and reviews 16, 393-407.
11. Krady, J.K., Basu, A., Allen, C.M., Xu, Y., LaNoue, K.F., Gardner, T.W., Levison, S.W., 2005. Minocycline reduces proinflammatory cytokine expression, microglial activation, and caspase-3 activation in a rodent model of diabetic retinopathy, Diabetes 54, 1559-1565.
12. Rungger-Brandle, E., Dosso, A.A., Leuenberger, P.M., 2000. Glial reactivity, an early feature of diabetic retinopathy, Investigative ophthalmology & visual science 41, 1971-1980.
13. Abu el Asrar, A.M., Maimone, D., Morse, P.H., Gregory, S., Reder, A.T., 1992. Cytokines in the vitreous of patients with proliferative diabetic retinopathy, American journal of ophthalmology 114, 731-736.
14. Bucolo, C., Leggio, G.M., Drago, F., Salomone, S., 2012. Eriodictyol prevents early retinal and plasma abnormalities in streptozotocin-induced diabetic rats, Biochemical pharmacology 84, 88-92.
15. Demircan, N., Safran, B.G., Soylu, M., Ozcan, A.A., Sizmaz, S., 2006. Determination of vitreous interleukin-1 (IL-1) and tumour necrosis factor (TNF) levels in proliferative diabetic retinopathy, Eye 20, 1366-1369. 16. Yuuki, T., Kanda, T., Kimura, Y., Kotajima, N., Tamura, J., Kobayashi,
I., Kishi, S., 2001. Inflammatory cytokines in vitreous fluid and serum of patients with diabetic vitreoretinopathy, Journal of diabetes and its complications 15, 257-259.
17. Carmo, A., Cunha-Vaz, J.G., Carvalho, A.P., Lopes, M.C., 2000. Effect of cyclosporin-A on the blood--retinal barrier permeability in streptozotocin-induced diabetes, Mediators of inflammation 9, 243-248. 18. Kowluru, R.A., Odenbach, S., 2004. Role of interleukin-1beta in the
development of retinopathy in rats: effect of antioxidants, Investigative ophthalmology & visual science 45, 4161-4166.
19. Garlanda, C., Dinarello, C.A., Mantovani, A., 2013. The interleukin-1 family: back to the future, Immunity 39, 1003-1018.
20. Arend, W.P., Palmer, G., Gabay, C., 2008. IL-1, IL-18, and IL-33 families of cytokines, Immunological reviews 223, 20-38.
47
21. Kim, B., Lee, Y., Kim, E., Kwak, A., Ryoo, S., Bae, S.H., Azam, T., Kim, S., Dinarello, C.A., 2013. The Interleukin-1alpha Precursor is Biologically Active and is Likely a Key Alarmin in the IL-1 Family of Cytokines, Frontiers in immunology 4, 391.
22. Sims, J.E., Dower, S.K., 1994. Interleukin-1 receptors, European cytokine network 5, 539-546.
23. Rothwell, N.J., Luheshi, G.N., 2000. Interleukin 1 in the brain: biology, pathology and therapeutic target, Trends in neurosciences 23, 618-625. 24. Irikura, V.M., Lagraoui, M., Hirsh, D., 2002. The epistatic
interrelationships of IL-1, IL-1 receptor antagonist, and the type I IL-1 receptor, Journal of immunology 169, 393-398.
25. Sedaghat, R., Roghani, M., Ahmadi, M., Ahmadi, F., 2011. Antihyperglycemic and antihyperlipidemic effect of Rumex patientia seed preparation in streptozotocin-diabetic rats, Pathophysiology : the official journal of the International Society for Pathophysiology / ISP 18, 111-115.
26. Bucolo, C., Ward, K.W., Mazzon, E., Cuzzocrea, S., Drago, F., 2009. Protective effects of a coumarin derivative in diabetic rats, Investigative ophthalmology & visual science 50, 3846-3852.
27. D'Amico, A.G., Scuderi, S., Saccone, S., Castorina, A., Drago, F., D'Agata, V., 2013. Antiproliferative effects of PACAP and VIP in serum-starved glioma cells, Journal of molecular neuroscience : MN 51, 503-513.
28. Tang, J., Kern, T.S., 2011. Inflammation in diabetic retinopathy, Progress in retinal and eye research 30, 343-358.
29. Brucklacher, R.M., Patel, K.M., VanGuilder, H.D., Bixler, G.V., Barber, A.J., Antonetti, D.A., Lin, C.M., LaNoue, K.F., Gardner, T.W., Bronson, S.K., Freeman, W.M., 2008. Whole genome assessment of the retinal response to diabetes reveals a progressive neurovascular inflammatory response, BMC medical genomics 1, 26.
30. Toda, Y., Tsukada, J., Misago, M., Kominato, Y., Auron, P.E., Tanaka, Y., 2002. Autocrine induction of the human pro-IL-1beta gene promoter by IL-1beta in monocytes, Journal of immunology 168, 1984-1991. 31. Aveleira, C., Castilho, A., Baptista, F., Simoes, N., Fernandes, C., Leal,
E., Ambrosio, A.F., 2010. High glucose and interleukin-1beta downregulate interleukin-1 type I receptor (IL-1RI) in retinal endothelial cells by enhancing its degradation by a lysosome-dependent mechanism, Cytokine 49, 279-286.
32. Scuderi, S., D'Amico, A.G., Castorina, A., Federico, C., Marrazzo, G., Drago, F., Bucolo, C., D'Agata, V., 2014. Davunetide (NAP) Protects the Retina Against Early Diabetic Injury by Reducing Apoptotic Death, Journal of molecular neuroscience : MN.
48
33. Cabrera DeBuc, D., Somfai, G.M., 2010. Early detection of retinal thickness changes in diabetes using Optical Coherence Tomography, Medical science monitor : international medical journal of experimental and clinical research 16, MT15-21.
34. Martin, P.M., Roon, P., Van Ells, T.K., Ganapathy, V., Smith, S.B., 2004. Death of retinal neurons in streptozotocin-induced diabetic mice, Investigative ophthalmology & visual science 45, 3330-3336.
35. Luheshi, N.M., McColl, B.W., Brough, D., 2009. Nuclear retention of IL-1 alpha by necrotic cells: a mechanism to dampen sterile inflammation, European journal of immunology 39, 2973-2980.
49